經理人自信程度與公司績效 - 政大學術集成
80
0
0
全文
(2) 謝. 誌. 誠摯感謝指導教授周行一老師,在論文撰寫的過程中給予指導,使學生的論 文順利進行並完整呈現。不論在學業上或生活上,周老師都給予我相當大的啟發 與教導,並且讓學生在看待事物時能更為全面並認真。也非常感謝徐政義老師、 陳虹伶老師,在口試時提供寶貴意見,使本論文更為完整。同時,也感謝給予我 指導的張元晨老師、周冠男老師,讓我對論文探討內涵更為了解。最後,謝謝每 一位和我討論的同學們,你們的聆聽和建議都能幫助我完成這篇論文。. 政 治 大 與每個陪伴我與我討論課題、生活的同學們,讓我在這兩年收穫良多並充滿歡 立. 研究所兩年中,感謝每位曾經教導我、提攜我的政大財務管理學系教授們,. ‧. ‧ 國. 學. io. sit. y. Nat. n. al. er. 笑。. Ch. engchi. i n U. v. 李 孟 玲. 謹誌於. 政治大學財務管理研究所 中華民國一百零一年一月. i.
(3) 摘. 要. Anand M. Goel and Anjan V Thakor 於最近的財務學刊中提出理性且風險趨避的 經理人會放棄部分正報酬但風險高的投資,造成投資不足問題,使得公司價值未 能極大化。然而,極端過度自信的經理人投資正負報酬皆有的計畫,造成過度投 資,使得公司價值遞減。只有中度自信的經理人能為公司價值帶來極大化效果。 本篇研究採用台灣上市櫃公司近二十年資料,以公司經理人對公司持股的變化來 衡量其過度自信的程度,探討公司經理人自信程度對公司獲利能力與公司價值的 影響。實證研究發現,極端過度自信的經理人與極端保守的經理人使公司的績效. 政 治 大 的影響,並為公司理財課題帶來新的貢獻。 立. 與成長性減少,降低公司價值。此研究增加我們了解經理人自有特徵對公司價值. ‧ 國. 學. 關鍵字:過度自信、公司績效、高階經理人持股變化. ‧. n. er. io. sit. y. Nat. al. Ch. engchi. ii. i n U. v.
(4) Abstract Former literature theorized that excessively overconfident CEOs and excessively diffident CEOs reduce the firm value for underinvestment and overinvestment problems and moderate overconfident CEOs willing to take risky but positive NPV projects increase the firm value. This paper conducts an empirical research by using the change of purchase and sale on own company stocks took by CEOs to measure CEO overconfidence level in Taiwanese listing companies and find that the profitability and stock performance of firms led by excessively overconfident CEOs. 政 治 大 CEOs. The result contributes to the understanding of the impact on firm valuation by 立 and excessively diffident CEOs decrease compared to by moderate overconfident. CEO idiosyncratic characteristics and offers new evidence to behavior finance on. ‧ 國. 學. corporate management.. ‧. y. sit. io. n. al. er. shareholding.. Nat. Keywords: Excessively overconfident, Excessively diffident, Firm value, CEO. Ch. engchi. iii. i n U. v.
(5) Content I.. Introduction .................................................................................................................... 6. II.. Literature review and hypothesis ................................................................................. 12. III. Measures of CEO’s confidence level ........................................................................... 15 3.1 Measures of excessive overconfident, moderate overconfidence, and excessive diffident ............................................................................................... 15 3.2 Alternative Explanation .............................................................................. 19 IV. Sample description and summary statistics ................................................................. 21. 政 治 大 Statistic Summary 立.......................................................................................22. 4.1 Sample......................................................................................................... 21 4.2. Results .......................................................................................................................... 26. ‧ 國. 學. V.. 5.1 Firm valuation ............................................................................................. 26. ‧. 5.2 Stock performance ...................................................................................... 30. sit. y. Nat. VI. Conclusion ................................................................................................................... 37. n. al. er. io. References ............................................................................................................................ 39. Ch. engchi. iv. i n U. v.
(6) Tables of Content Appendix A .......................................................................................................................... 43 Table 1: Sample frequency of excessively overconfident CEO and excessively diffident CEO...................................................................................................................................... 44 Table 2: Summary Statistics of CEO characteristics and firm valuation ............................. 46 Table 3: Summary Statistics of CEO characteristics and stock performance ...................... 51 Table 4: Correlations of different measure of excessive overconfident and excessive diffident CEOs ..................................................................................................................... 55 Table 5: Correlations of confidence level with firm valuation measure .............................. 56. 政 治 大. Table 6: Correlation of confidence level with firm stock performance measure ................. 58. 立. Table 7: Excessively overconfident CEOs and excessive diffident CEOs vs. firm. ‧ 國. 學. valuation by Q ...................................................................................................................... 60 Table 8: Excessively overconfident CEOs and excessive diffident CEOs vs. firm. ‧. valuation by ROA ................................................................................................................ 65. y. Nat. io. sit. Table 9: Excessively overconfident CEOs and excessive diffident CEOs vs. firm. n. al. er. valuation by ROE ................................................................................................................. 69. i n U. v. Table 10: Performance-Attribution regression for excessively overconfident CEO. Ch. engchi. portfolio and excessive diffident CEO portfolio .................................................................. 73 Table 11: Excessively overconfident CEOs and excessive diffident CEOs vs. firm stock performance ......................................................................................................................... 75. v.
(7) I.. Introduction Former literature theorized firm value is higher with a moderately overconfident. CEO than a rational risk adverse CEO. However, an extremely overconfident CEO decreases firm’s value (e.g., Anand M. Goel and Anjan V. Thakor (2008)). I demonstrate the theory by conducting the research on the relationship between managers’ confidence level and firms’ valuations and stock market performances and find out the equation do exist.. 政 治 大 confidence intervals” (Larwood and Whittaker (1997); Kidd (1970); Moore (1977)), 立. Self-attributed bias, both in terms of “better than average effect“ and “narrow. is a prevalent characteristics in executives. In Malmendier and Tate (2005),. ‧ 國. 學. overconfident CEOs are defined tend to overstate their acumen relative to the average. ‧. and attribute good outcome to their success but bad outcomes to bad luck. Thus, they. sit. y. Nat. are too optimistic about the outcomes of their decision. Goel and Thakor (2008). io. er. review overconfident CEOs overestimate the precision of their information and underinvest in information acquisition. I follow the theory and model proposed by. al. n. v i n C hthat the value ofUcompanies led by excessively Goel and Thakor to hypothesize engchi. overconfident CEOs and excessively diffident CEOs reduces and then make an empirical research on their new classification of CEO’s confidence and the influence on firm value. It has not been discussed until recently that personal behavior led by irrationality has vital influence on individual investment and financial management in academy. Furthermore, there are quite many literatures researching on the relationship between overconfident managers and corporate strategies in the recent decade but quite few papers studied the influence of CEO confidence level on firm performance directly. Also the former study results on corporate strategies are mixed and ambiguous. 6.
(8) Malmendier and Tate (2005) are precursors examining and discovering the personal characteristics of CEOs lead to distortion in corporate investment policies. They found overconfident managers have a heightened sensitivity of corporate investment to cash flow: they conduct more merger and acquisitions thus exacerbate the company’s value without financial constraint. Hirshleifer, Low, and Teoh (2010) and Mueller (2009) certified that overconfident CEOs overcome investment constraints and achieve greater returns and innovation. The former mixed results make the theory grow scattered.. 政 治 大 different impact on corporate strategies and firm performance. Under the optimal 立. Goel and Thakor (2008) address new distinction within CEO confidence and its. compensation, a rational, risk-adverse CEO forego some positive NPV but risky. ‧ 國. 學. projects to shareholder profit maximum since increasing project risk increases the risk. ‧. of the wage making CEO considered to be conservative without promotion concerns,. sit. y. Nat. causing underinvestment. However, a moderate overconfidence approaching to risk. io. er. neutral reduces the underinvestment problem, leading value enhancing by exercising the risky but positive NPV projects. As CEO’s overconfidence increases, he/she is. al. n. v i n willing to invest in portfolios C that have low probabilities h e n g c h i U of the high payoff and. produce smaller marginal increases in shareholders’ wealth. Firm value increases with CEO overconfidence at a decreasing rate up to a point and eventually declines as overconfidence cause accept value destroying project leading to non-monotonic impact. In the same time, Hackbarth (2008) develops a trade-off model of capital structure decision and certified that overconfident CEOs commit cash flows to debt thus reduce suboptimal investment and agency problem to increase firm value. Excessively overconfident CEOs commit too much cash flow to debt payments, creating the debt overhang issue thus reduce firm value. Above models develop a non-monotonic relation between CEO confidence level and firm value. 7.
(9) I hypothesize that CEOs who display excessive overconfidence and CEOs who display excessive diffidence cause firm performance declining. The sample consists of all CEOs in firms registered in Taiwan Stock exchange and Over-the-Counter from Taiwan Economic Journal database into three confidence level: excessive overconfidence, moderate overconfidence, and excessive diffidence. Wright and Philip (1980, 1978) discovered that Asia subjects are more overconfident than western subjects and the success of Taiwan exporting processing business is well-known makes me choose to study the behavior of Taiwanese managers.. 政 治 大 applied by Campbell, Johnson, Rutherford, and Stanley (2009) as the measure of 立 I applied Net Stock Purchases proposed first by Malmendier and Tate (2005) and. confidence. As a CEO purchases his own company stock, he is considered confident. ‧ 國. 學. on firm prospect under his leadership making him to use own money to buy the. ‧. company stocks. Otherwise CEO is considered diffident or conservative on future. sit. y. Nat. return when he sells the company stocks. Different from Campbell et al. (2009), the. io. er. measure is modified by setting several cutoffs to classify CEO confidence level but not just focus on a specific cutoff to understand the effect on firm profitability and. al. n. v i n C htop (bottom) 40%,U 30%, 20%, and 10% end of stock performance. By classifying engchi continuum of the distribution of Net Stock Purchases by all CEOs in a given year as. excessive overconfidence (excessive diffidence), I testify the influence of CEO confidence on firm value when approaching to the extreme end of continuum. Besides a simple calculation on the change of shares held by CEO, the activities such as pledge are needed to be considered in the calculation since it is popular among CEOs in Taiwan to avoid making an adverse signal from selling company stocks directly. The distribution of stock dividends and employee bonus as stock also affects the change of net stock purchases as these kinds of compensation are also general in Taiwan companies. After considering the pledge and stock dividends, the 8.
(10) measure of excessive overconfidence could be retrieved stronger and purer; nevertheless, the measure of excessive diffidence becomes biased much more for liquidity-motivated sale needs. When examining the results, those of Net Stock Purchases excluding stock dividends after pledge as excessive overconfidence measure and of Net Stock Purchase as excessive diffidence measure are emphasized. My results strongly support Goel and Thakor’s prediction and the hypothesis that firm value decreases when excessively overconfident CEO or excessively diffident CEO is in charge. Industry-adjusted Tobin’s Q, ROA, and ROE are the proxies of firm. 政 治 大 Purchases excluding stock dividends after pledge are adverse to firm profitability and 立. probability. From the study, excessively overconfident CEOs measured by Net Stock. the adverse effect enlarges when closing to the top extreme end of e continuum: Q in. ‧ 國. 學. excessively overconfident CEO firms by top 10% cutoff is 113% less than in. ‧. moderate overconfident firms, ROA is 452% less, and ROE is 148% less. The. sit. y. Nat. excessively diffident CEOs measured by Net Stock Purchases are also adverse to firm. io. er. value significantly though non-monotonic as close to the bottom end of continuum: Q in bottom 10% cutoff excessively diffident CEO firms is 27% less than in moderate. al. n. v i n C hless, and ROE is U overconfident firms, ROA is 164% 47% less. As the results shown, engchi. the adverse effect on firm profitability is stronger in excessively overconfident CEO firms than in excessively diffident CEO firms. I also identify the effect on stock performance by excessively overconfident CEOs firms and excessively diffident CEO firms and found that excessively overconfident and diffident CEOs measured by Net Stock Purchases excluding stock dividends after pledge are adverse to the company stock performance as compared to moderate overconfidence. From performance-attribution regression, the abnormal returns in excessively overconfident CEO portfolio and excessively diffident CEO portfolio are significantly negative more than that in moderate overconfident CEO 9.
(11) portfolio though the adverse effect is non-monotonic and reduced when approaching to the extreme cutoff. From Fama-Macbeth Regression, the adverse effect of excessively overconfident CEOs are significantly at 10% in the top 40% and 30% cutoffs of the distribution and the trend is downward: Stock return from top 40% end to 30% end excessively overconfident CEO firms is 68% less to 89% less than in moderate overconfident CEO firms. The adverse effect of excessively diffident CEOs are significantly at 1% in bottom 30% end of the distribution: Stock return in bottom 30% excessively diffident CEO firms is 112% less than moderate overconfident CEO. 政 治 大 and diffident CEOs is smaller than 立. firms. However, the pattern is not clear and the significance of excessively overconfident CEOs. Q, ROA, and ROE,. manifesting that the personal characteristics of CEOs though do have some adverse. ‧ 國. 學. impact on stock return but not a main driver in all round manner.. ‧. My results extend the literature on the influence of CEO overconfidence on firm. y. Nat. value. Although there is a lot of literature discussing the relation between CEO. er. io. sit. overconfidence and firm’s investment and financing activities, there is few to empirically study the effect on firm performance directly. My research directly. al. n. v i n C hwe care in investment reviewed the most important affair and corporate management. engchi U. We could make more sound investment and management when possibly discerning what factors influence firm value and applying good ones and disposing bad ones. As above, the impact from the characteristic of CEO, overconfidence and diffidence specifically, on firm value and performance is consistent with Goel and Thakor’s and Hackbarth’s theory. Also from the research CEO compensation may unable to completely offset suboptimal levels of managerial overconfidence proposed by Gervais, Heaton, and Odean (2007). So far there is no one discussing the relationship between CEO confidence and firm value by applying their new classification on confidence level of CEOs as I know. The measure of overconfidence by dividing 10.
(12) sample to excessive overconfidence and excessive diffidence as dynamic cutoffs on the distribution of their net stock purchases helps understand how excessively overconfident CEOs and excessively diffident CEOs are detrimental to the company. Finally, my research is quite comprehensive as considered the contingent factors such as stock pledge activities and/or stock dividends that will influence our confidence measure in Taiwan. Without considering those activities prevailing in Taiwan business market, the results may be bias and imprecise as conduct. According to my research, there is some ambiguity needed to be solved or. 政 治 大 examine why the effect of excessive diffident CEOs on firm value is non-monotonic, 立 further defined. On the dimension of corporate finance, the future research could. which is the reason why the more extreme diffident CEOs are not harm the company. ‧ 國. 學. that much. On the dimension on asset management, the further research could be. ‧. conducted on the reason why there is no clear pattern when approaching to the. sit. y. Nat. extreme end of overconfidence and diffidence on stock performance and the results. io. er. are less significant especially after proving that excessively overconfident CEOs and excessively diffident CEOs adversely affected the company profitability if the market. al. n. v i n C h smart to senseUthe CEOs’ characteristics and is efficient. The questions are investors engchi do they know the impact may be interesting extension in the future work.. The remainder of the paper is organized as follows. Section Ⅱ retraced some related literature and set up my hypothesis. Section Ⅲ describes the measures of excessive overconfident, moderate overconfidence, and excessive diffident, and the alternative explanation on the measure. In section Ⅳ, I elaborate sample data and statistic summary. At last, I presented the empirical results of firm profitability and stock performance influenced by CEO confidence level in section Ⅴ and made a conclusion in Section Ⅵ.. 11.
(13) II.. Literature review and hypothesis Malmendier and Tate (2005) are precursors examining and discovering the. personal characteristics of CEOs lead to distortion in corporate investment policies. Their paper studied on unique option dataset clarifying the exact strike price, the maturity, and number of underlying shares from 477 large publicly traded US firms from 1980 to 1994 and found overconfident managers overestimate the returns to their investment projects and have a heightened sensitivity of corporate investment to cash flow. They implied that overconfident CEO feeling undervalued by capital market and. 政 治 大. thus reluctant to issue risky securities to finance his project. So an influx of cash. 立. would enable overconfident CEO to undertake these forgone projects. In their. ‧ 國. 學. research, overconfidence of CEOs helps to explain the “investment-cash flow sensitivity puzzle” in the corporate finance literature.. ‧. Malmendier and Tate (2005b) also provided the related evidence on real effects. y. Nat. sit. of overconfidence: In the absence of financial constraint, overconfident CEOs. n. al. er. io. conduct more merger and acquisitions thus exacerbate the company’s value. Mueller. i n U. v. (2009) certified that corporate investment is positively related to free cash flows to the. Ch. engchi. firms and overconfidence attributes to corporate investment variation along the business cycle: significant effect on higher corporate investments in early expansion phase, in upswing phase of the business cycle lead to overcome investment constraints, to bring corporate investment to optimal level and achieve positive returns. Ben-David, Graham, and Harvey (2007) show the evidence that managerial overconfidence is associated with aggressive corporate policies, including investments, financing and executive compensation. Hirshleifer, Low, and Teoh (2010) studied the overconfident CEO to innovation activities by examining the applied patent count and patent citation count, discovering that firms with overconfident 12.
(14) CEOs have greater return volatility, invest more in innovation and achieve greater innovation than non-overconfident managers only in innovation industries without inferior performance. From above, the former empirical studies presented differentiated and conflict results making me wonder the actual effect on firm value. Goel and Thakor (2008) address further new distinction within overconfidence and its different impact on corporate strategies and performance. Their definition of overconfidence is related to the manager overestimates the precision of the forecast of the project payoff by overestimating the precision of the project signal. In their. 政 治 大 manager. However, managerial. research, rational ability filtering process inside firm’s promotion mechanism chooses the highest perceived ability. 立. ability cannot be. observed and firms promote managers with the highest realized returns from the. ‧ 國. 學. project. To show one’s ability up, the managers take riskier projects to win the. ‧. filtering tournament and believe the higher risk project presents their profound. sit. y. Nat. abilities than others. Thus confident managers have been selected and the. io. er. characteristic also has been raised and strengthened through the promotion hierarchy. Then, a board of directors in a company selects qualified CEO from a small group of. al. n. v i n C h and appointsUthe one with highest perceived bias managers (overconfident managers) engchi ability. In the whole process, the overconfident manager stands out in the process. when competing with otherwise rational managers. Graham, Harvey, and Puri (2010) demonstrated that overconfident is prevalent attribute among CEOs than in the lay population. Goel and Thakor then considered that board offers the CEO payoff-contingent compensation to incent him/her to develop an accepted portfolio at a personal cost. Under the optimal compensation, a rational, risk-adverse CEO forego some positive NPV but risky projects to shareholder profit maximum since increasing project risk increases the risk of the wage or even reduces the mean wage making CEO 13.
(15) considered to be conservative without promotion concerns, causing underinvestment. However, a moderate overconfidence approaching to risk neutral reduces the underinvestment problem, leading value enhancing by exercising the risky but positive NPV projects. Moderately confident CEO also caps the cost of compensation package down because he/she regarded himself destined to maximize the shareholders’ profit so the inspiration activities lessen but maintain the effects. As CEO’s overconfidence increases, he/she is willing to invest in portfolios that have low probabilities of the high payoff and produce smaller marginal increases in. 政 治 大 rate up to a point and eventually declines as overconfidence cause accept value 立 shareholders’ wealth. Firm value increases with CEO overconfidence at a decreasing. destroying project leading to non-monotonic impact.. ‧ 國. 學. Gervais, Heaton, and Odean (2007) find CEO overconfidence naturally realigns. ‧. his incentives with those of shareholders and as a result less convexity is required in. sit. y. Nat. compensation for him to make firm value increasing. Moderate levels of. io. er. overconfidence lead firm to offer flatter compensation contracts providing with better insurance and resolve moral hazard problems with executive compensation and. al. n. v i n C h (2008) develops thereby enhancing firm value. Hackbarth a trade-off model of capital engchi U. structure decision in which CEOs can have some degree of overconfidence. He certified that overconfident CEOs underestimate the risk associate with debt and commit larger amounts of cash flows to fixed payment thus reduce the ability of the CEO to make suboptimal investment and conflict between manager and shareholders enough to increase firm value. Excessively overconfident CEOs commit too much cash flow to debt payments, which increases bankruptcy risk and creates the debt overhang issue. Therefore, the expected costs of debt may exceed the benefits of debt in reducing managerial discretion and thereby lead to lower firm value. All leads to a non-monotonic relation between CEO overconfidence and firm value. 14.
(16) My confidence foundation is centered on the model proposed by Goel and Thakor (2008) and the hypothesis that CEOs who display excessively overconfident and CEOs who display excessively diffident reduce the firm performance.. III. Measures of CEO’s confidence level. 3.1 Measures of excessive overconfident, moderate overconfidence, and excessive diffident. 政 治 大. Measuring CEO confidence level is quite difficult empirically because it cannot. 立. be observed directly thus the relative researches are conducted until recently.. ‧ 國. 學. Malmendier and Tate (2005) take company stock-option as the measurement of the overconfidence. As CEOs persistently exercise options later though deep in the money,. ‧. they are inferred to be overconfident in their abilities to keep companies’ stock prices. y. Nat. sit. rising and then get profits from expected return by holding the options. In the same. n. al. er. io. time, they take firms’ equity increase by CEOs as the proxies of overconfidence since. i n U. v. they underdiversified their investment in the company with their human capital.. Ch. engchi. Malmendier and Tate (2008) developed a measure based on the CEO’s portrayal in the media. Catherine and Zechman (2007) use the investment decisions of the firm or industry as overconfident CEOs might be attracted by riskier firms. Lin, Hu, Chen (2008) use the predictions made by the executive with regards to the firm’s future prospect. Overconfident CEOs would release better than realized revenues since they overestimate their ability on firms’ future prospects. Ben-David, Graham, and Harvey (2008) use detailed survey-response data on future market prospect to classify chief financial officers’ overconfidence. To construct the measure of overconfidence, I exploit the overexposure of typical 15.
(17) CEOs to the idiosyncratic risk of the firms. Since the value of their human capital is intimately linked to the firm’s performance, the underdiversified CEOs should avoid acquiring additional equity, leading to classify CEOs who habitually increase their holdings of company stock as overconfident. CEOs believe their leadership more than they objectively should expect by overestimating the future returns of their investment projects, resulting in even buying additional company stock to benefit personally from expected future gains. The measure of overconfidence conducted by Malmendier and Tate (2005) is Net Stock Purchase units (purchase minus sales). They define a CEO as. 政 治 大 or more tenure in the sample period. Campbell, Johnson, Rutherford, and Stanley 立 overconfident if the net purchases measure is positive over the first five years of ten. (2009) further classified CEOs as excessively overconfident (diffident) if in a given. ‧ 國. 學. year the net stock purchase number are in the top (bottom) quintile of the distribution. ‧. of net purchases ranked by all CEOs and those purchase increases (decreases). io. er. classified is classified as moderately overconfident.. sit. y. Nat. ownership by at least 10% of their stock ownership in the firm. Rest of the CEOs not. As the purpose is to testify excessively overconfident CEOs and excessively. al. n. v i n C the reduce value, I use the progressive h efirm ngchi U. diffident CEOs actually. method to. examine the influence of excessively overconfidence and diffidence. By applying the method proposed by Campbell et al. (2009), I classify the level of confidence of all CEOs in a year into three groups: excessive overconfidence, moderate overconfidence, and excessive diffidence. The upper end of continuum of the distribution of Net Stock Purchases would be defined as excessive overconfidence level as CEOs bought more firm share among all CEOs in a given year indicating he might overestimate the future value of own company under his leadership thus purchased relatively more shares of the company stocks than other CEOs. Contrarily, the bottom end of continuum of the distribution of Net Stock Purchases is defined as excessive diffidence indicating 16.
(18) CEOs bought less even sold firm’s shares among all CEOs in a given year showing the CEOs might underestimate the future firm value due to conservatism thus reduce the more shareholding of his own company than other CEOs. The middle range of the distribution not classified as excessive overconfidence and excessive diffidence is defined as moderate overconfidence. Difference from Campbell et al. (2009)’s method, the several cutoffs are set to classify CEO confidence level help examine the effect of confidence level on firm performance. By narrowing down the cutoffs from top 40%, 30%, 20%, to 10% of the. 政 治 大 overconfidence preference would be intense; in the same way, CEO’s diffidence 立. distribution of Net Stock Purchases by all CEOs in a given year, CEO’s. preference would be intense by narrowing down the cutoffs from bottom 40%, 30%,. ‧ 國. 學. 20%, to 10% of the distribution of Net Stock Purchases by all CEOs in a given year.. ‧. The dynamic examination could help understand the influence of CEO’s confidence. y. Nat. level thus demonstrate whether the characteristics of CEOs have the vital influence on. er. io. sit. the company. The advancing test avoids setting a restriction on CEO’s ownership but still could understand the influence from CEO’s overconfidence level on firm value.. al. n. v i n As the sample restricted inCTaiwan listing companies, h e n g c h i U distributing stock options. is not a common compensation method in all industries such as food, retail, and. cement. Also unlike the measure problem based of stock options such that some CEOs who have all of their options out of money or have no options at all in a given are not be classified, we classify all CEOs in our full sample. However, employee bonus as stock distributed by the companies every year is a kind of prevalent compensation method in Taiwan to reward for management team resulting in the change of shareholding of company stocks by CEOs. Also Taiwanese companies often distribute stock dividends per year to shareholders to make a positive signal generally thus CEOs who has company stocks would also get many stock dividends influencing the 17.
(19) change of shareholding in a year. Therefore, some stock purchases are related to stock dividend acquisition. In constructing an indicator of CEO confidence, there are potential advantages and disadvantages to including these. If CEOs who get the dividends but not sell immediately in the year lead to the increase of net purchase unit, it might express the CEOs consider the stock price could rise up to the level they optimistically expect manifesting their optimistic expectation on future firm value. While calculating Net Stock Purchase excluding the stock dividend could extract purer overconfidence level of CEOs since the CEOs must have high level of. 政 治 大 besides the stock dividends. In sum, the measure of Net Stock Purchase including the 立. confidence to the outlook of the company making them to purchase company’s shares. stock dividends could show the confidence level of CEOs while that excluding stock. ‧ 國. 學. dividends shows much stronger evidence on CEO overconfidence.. ‧. Besides stock dividends, I construct separate measures considering the effect of. sit. y. Nat. pledge. Pledge could be considered a widespread method to sell company stocks by. io. er. CEOs in Taiwan because they could transfer the stocks to the third parties usually banks getting the money but prevent from making a negative signal when selling. al. n. v i n C more shares directly. If a CEO were set as U pledge, CEO may be considered h e nowngstock i h c. take conservative idea on company’s outlook. As CEOs reduced the pledge level, it would be considered having more confidence on future firm value making them to hold the company stocks to the expected condition. However, in same conditions it may be considered CEOs sense the stock reaching the selling point making them redeem the pledged shares and sell in the market in the same time. Rather than trying to resolve whether inclusion or exclusion of such pledge activities is best, I construct separate measures including and excluding the pledge related transactions. However, after considering the stock dividends and pledge took by CEOs, personal liquidity-motivated sale needs let the excessively diffident sample biased to positive 18.
(20) effect on firm value since misperceiving liquidity-motivated sales as excessive diffidence introduces measurement error. As Campbell et al. (2009), I tighten the classification rules to stress the persistency of the behavior, besides applying the confidence classification to every CEO every year in the sample. If the years of a CEO classified as excessively overconfident are more than half of tenure within the sample and he had never been distributed to excessively diffident, the classification keeps going forward. Contrarily, if the years of a CEO classified as excessively diffident are more than half and had. 政 治 大. never been distributed to excessively overconfident, the classification keeps going forward.. 立. One may argue that CEO actions underlying my overconfidence measure are. ‧ 國. 學. endogenously related to selection and/or retention on CEO position boards made.. ‧. Boards may even take overconfidence into account in choosing a CEO. However,. sit. y. Nat. endogeneity does not affect the adverse influence on corporate performance.. io. n. al. er. 3.2 Alternative Explanation. i n U. v. Consider some alternatives explanation on the measure of overconfidence:. Ch. engchi. 1) Inside information. A CEO may not decrease exposure to company risk even increase because of private information about future stock prices. Since the information has not been incorporated into the market price, the firm’s stock is undervalued being attractive. The key distinction between overconfidence and information is persistence. Information is likely to be short term and transitory. The short term effect on positive information is unlikely that the same CEO would repeat buy the stocks. While the characteristic of extreme overconfidence and diffidence maintains persistently on CEO. Moreover, the factor leading CEO to purchase additional 19.
(21) company stock still affects the company performance in a disjoint future time period. However, the return of stock prices does not enhance, actually the average return of the company forward one year led by overconfident CEOs are minus 5% around but that of full sample is minus 2%, and the return forward one month led by overconfident CEOs is as same minus 2% as that of full sample, showing that inside information is not the reason why the CEO increase the company’s stocks. 2) Signaling. CEO may hold company risk is to convey a costly signal to capital market that the firm’s prospects are better than the prospects of similar firms.. 政 治 大 additional company shares, just remain the same shareholdings. 立. However, this would not inspire them to increase company exposure by purchase. 3) Risk tolerance. One might said my measure of overconfidence as measure of risk. ‧ 國. 學. attitude. However, CEO would not habitually buy additional stocks of his. ‧. company as high risk tolerance and would need to be risk seeking but justified. sit. y. Nat. high investment – cash flow sensitivity to overconfidence (Malmendier and Tate. io. er. (2005)) should not be in the same case. Any level of overconfidence no matter within risk-neutral or risk loving will lead to excessive risk and reduce firm value. al. n. v i n (Goel and Thakor (2008)). C There are already a lot h e n g c h i U of empirical evidence saying managers are risk adverse (Grund and Sliwka (2006), Khambata and Liu (2006),. Suto, Menkhoff, and Beckmann (2005)). However, firm value decreases monotonically in CEO risk aversion, while overconfidence affects shareholder wealth non-monotonically when CEOs are risk aversion. As risk aversion decreases, the cost of bearing risk decreases, because it enables contracts with greater payoff-dependence and better incentives, and is being cheaper for the shareholders to incent the CEO to accept good portfolios, thus increasing the firm value. In addition, overconfidence exerts an independence effect on outcomes. Grinblatt and Keloharju (2006) find that overconfidence has a large effect on 20.
(22) investors’ decisions on trading but this is not driven by risk aversion difference. Barber and Odean (2001) document men trades with greater overconfidence than women but not risk aversion level. 4) Procrastination. Inertia on CEOs’ personal account my carry over to the corporate account of the firm in a reluctance to conduct equity issues so CEO should not habitually purchase company equity under my measure. 5) Tax consideration: Jin and Kothari (2008) find the tax burden is a major factor inducing CEOs to sell stocks. However, there is only security trading taxes levied. 政 治 大 Moreover, to purchase a stock would also be taxed over showing the confidence 立. by trading stocks in our sample Taiwan market reducing the tax problem.. level of the CEOs.. ‧. ‧ 國. 學. IV. Sample description and summary statistics. y. sit. io. n. al. er. Sample. Nat. 4.1. i n U. v. The sample is selected from public traded Taiwanese companies listing on. Ch. engchi. Taiwan Stock Exchange (TSE) and Over-the-Counter (OTC) market. Since Wright and Philip (1980, 1978) discovered that Asia subjects are more overconfident than western subjects and the success of Taiwan exporting processing business is well-known makes me choose to study the behavior of Taiwanese managers. To measure a persistent characteristic on CEOs, I first collect CEOs shareholding data of their own companies from 1990 to 2010 from the Taiwan Economic Journal (TEJ), a special complete Taiwan database, and compute the Net Stock Purchase every year every CEOs in every firms. TEJ also consist CEOs’ pledge activities and employee bonus as stock dividends distribution statements. As distributed stock dividends for 21.
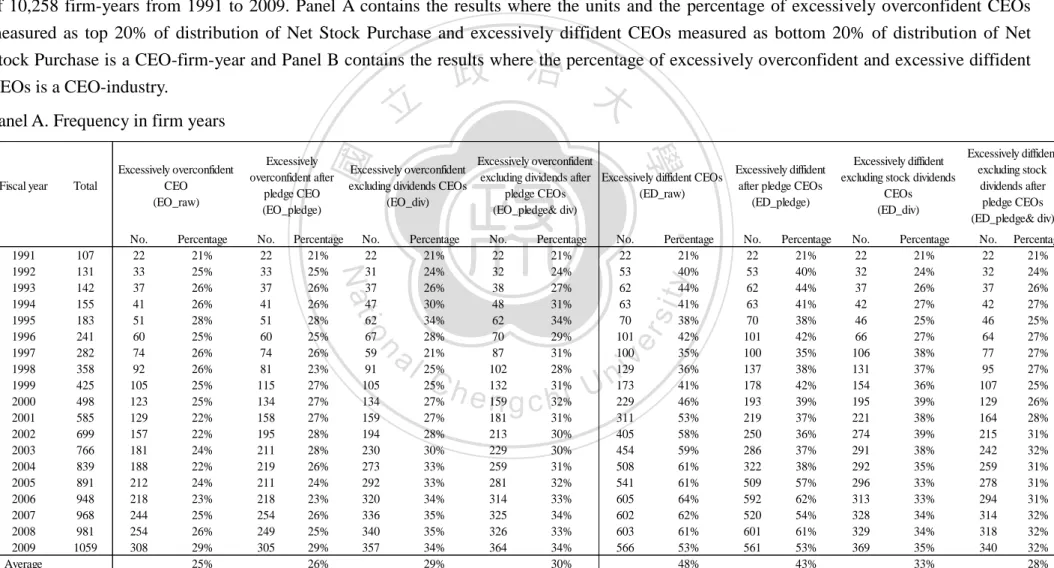
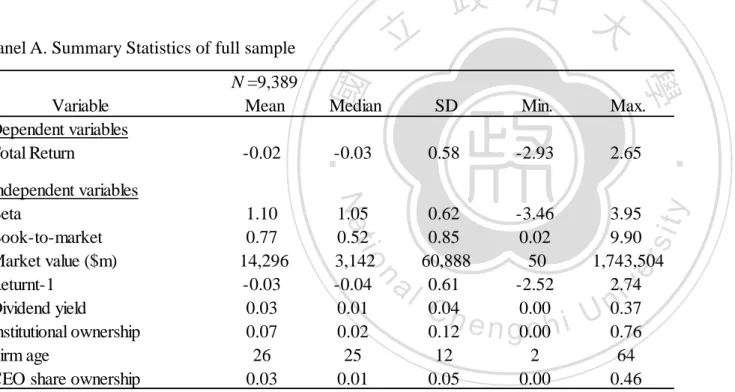
(23) shareholders each year in each firm, they are computed by announced stock dividends per share multiplying the original shares got by CEOs. There are 11,802 total CEO-year observations over a maximum time period of 20 years for any individual CEO. The financial information of the companies, including sales revenues, research and development expense (R&D), book assets, book common stocks, deferred taxes, earnings before interest and taxes and depreciation and amortizations, and cash dividends are from TEJ- Finance DB. The stock price, return, shares outstanding and. 政 治 大 information of companies are from TEJ- Company DB. The factor premium data of 立 institutional ownership are from TEJ- Equity DB. The personal data of CEO and basic. equity market are from TEJ- Multiple equity factor DB. Excluding the missing data. ‧ 國. 學. for any of the above measures yields a sample of 10,258 CEO-year observations. Statistic Summary. sit. y. Nat. 4.2. ‧. across 1,217 firms over a maximum of 18 years for any individual CEOs.. n. al. er. io. Table1 presents summary statistics for the confidence measure. Panel A of Table. i n U. v. 1 contains the results where the units and the percentage of excessively overconfident. Ch. engchi. and excessively diffident CEOs measured as top and bottom 20% cutoff of distribution of Net Stock Purchase is a CEO-firm-year and Panel B contains the results where the units and percentage of excessively overconfident and excessive diffident CEOs is a CEO-industry. As shown in Panel A, the average of frequency of excessive overconfident CEOs in fiscal years is 25% measured by Net Stock Purchases (EO_raw), 26% measured by Net stock purchases after pledge (EO_pledge), 29% measured by Net stock purchases excluding stock dividends (EO_div) and 30% measured by Net stock purchases excluding stock dividends after pledge (EO_pledge& div). The average of frequency 22.
(24) of excessive diffident CEOs in fiscal years is 48% by Net stock purchases (ED_raw), 43% by Net stock purchases after pledge (ED_pledge), 33% by Net stock purchases excluding stock dividends (ED_div), and 28% by Net stock purchases excluding stock dividends after pledge (ED_pledge& div). Despite the fact that we use upper and lower quintile cutoffs to define excessive overconfidence and excessive diffidence respectively, the resulting sample distribution should not necessarily be 20% each because the quintile breakpoints are computed using CEO-year observations each year but the excessive overconfidence (diffidence) would remain forward unless they are. 政 治 大 more in Net stock purchases excluding stock dividends after pledge (EO_pledge& div) 立 be classified to opposite group. From the panel, excessive overconfidence persists. than in rest measures since the average frequency deviates largest from quintile cutoff,. ‧ 國. 學. certifying that the purer trait of CEO’s overconfidence is measured out. However, the. ‧. trait of CEO’s diffidence is blurred by liquidity-motivated sale bias when the measure. sit. y. Nat. considers stock dividends and pledge, resulting in excessive diffidence persists more. io. er. in Net stock purchases. While compared the frequency of excessive diffidence to of excessive overconfidence, higher frequency of excessive diffidence may indicate the. al. n. v i n Ch sample is biased to moderate overconfident group, making the results may also bias. engchi U. In panel B, Taiwanese listed companies are divided into 26 industry groups based. on Taiwan Stock Exchange’s classification and found out that excessively overconfident CEOs are higher in Electronics industry: 14% in Electronic Components, 13% in Semiconductors, and 11% in PC Electronics and excessively diffident CEOs are higher in Traditional industry: 9% in Textile and 7% in Construction. As we know, riskier industries such as electronics need overconfident CEOs to take more risk in investment thus attract overconfident CEOs to do the job. Table 2 shows the summary statistics of sample firm and CEO characteristic on firm profitability as industry-adjusted Q, ROA, and ROE. Panel A shows the mean, 23.
(25) median, standard deviation, minimum, and maximum of full sample, Panel B shows that of excessively overconfident and excessively diffident CEOs sample measured by Net stock purchases, Panel C shows that of those measured by Net stock purchases after pledge sample, and Panel D shows that of measured by Net stock purchases excluding stock dividends after pledge. Considering the different characteristic existing in different level of excessive overconfidence and excessive diffidence, Rows 1 show the statistics of excessive overconfident and diffident CEOs by top and bottom 40% end of the distribution of Net stock purchases and rows 2 show those by top and. 政 治 大 and ROE in excessively overconfident CEO sample are statistically over than those in 立 bottom 10% end. As shown in Panel A, B and C, the means and medians of Q, ROA,. excessively diffident CEO sample and full sample, so as Sales, R&D, and CEO. ‧ 國. 學. ownership and Firm age is smaller, manifesting that excessively overconfident CEOs. ‧. are centered in young companies help value creation consistent with Mueller’s. y. Nat. predictions but excessively diffident CEOs reduce the profitability same as Goel and. er. io. sit. Thakor’s prediction.. In addition, profitability measure decreases when approaching to the extreme end. al. n. v i n continuum,C certifying the prediction hengchi U. top 10% of the. that more extremely. overconfident CEO reduce firm profitability, but the situation does not exist in excessively diffident CEO firms. However, the means and medians of Q, ROA, and ROE in excessive overconfident CEO firms in Panel D are lower than those of Q, ROA, and ROE in full sample and in excessively diffident CEO sample, showing that excessively overconfident CEOs might harm the company after using stricter measure on overconfidence classification. Nevertheless the results of excessively diffident CEO sample in Panel D are affected by liquidity selling problems. Table 3 presents the summary statistics of sample firm and CEO characteristic on stock performance and related control variables. Panel A, B, C and D of Table 3 are 24.
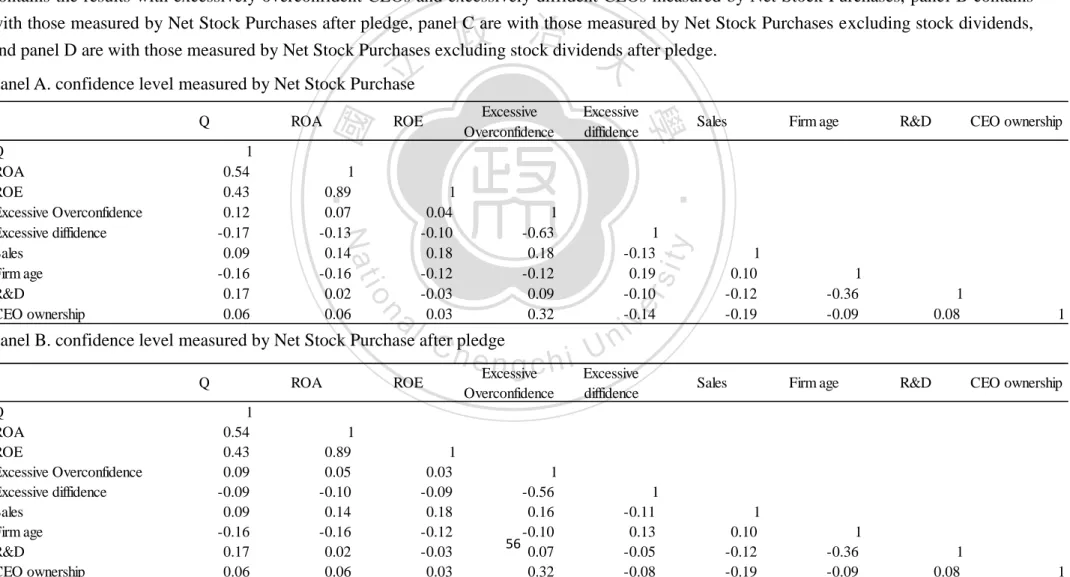
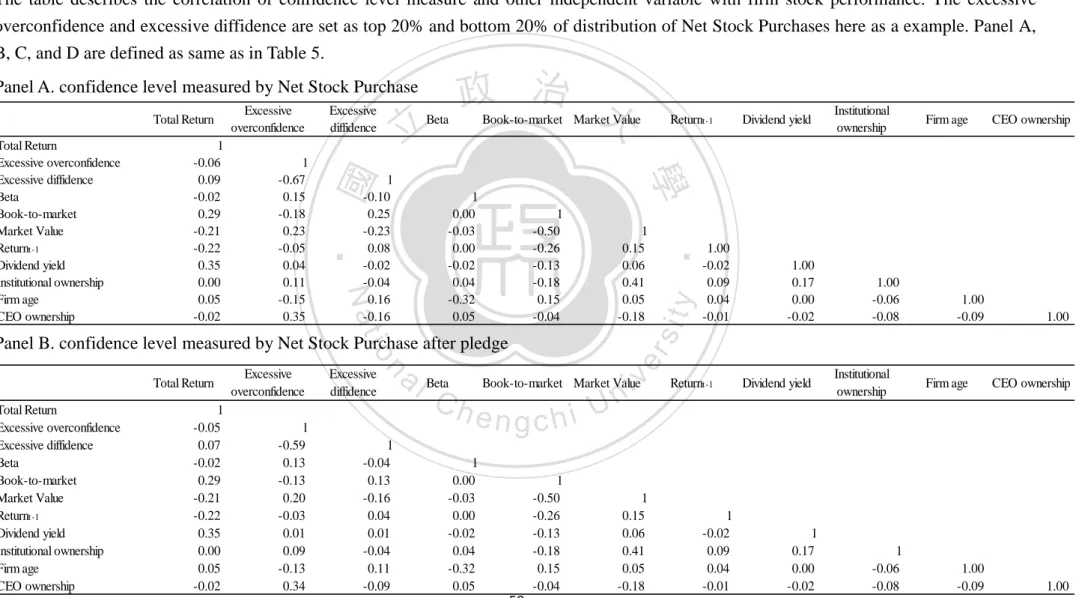
(26) defined as same as Table 2. The total stock return of excessively overconfident CEO firms is worse than of full sample in all confidence measure method indicating that excessively overconfident CEO may let the company value go down but the effect seems lessen when approaching to the extreme cutoff. Contrarily, the total return of excessively diffident CEO firms is higher than of full sample maybe due that the excessively diffident CEOs are not really diffident as the measure is bias by liquidity-motivated sale activities. However, the trend is going down when approaching to the extreme cutoff, showing the extremely diffident CEOs make the. 政 治 大 growth-oriented companies with lower book-to-market value, higher market value, 立. value downward moving. In addition, excessively overconfident CEOs are centered in. and younger firms.. ‧ 國. 學. To understand the difference among my four measures of confidence level:. ‧. Confidence including stock dividends (confidence raw), Confidence including stock. sit. y. Nat. dividends after pledge (confidence pledge), Confidence excluding stock dividends. io. er. (confidence div), and Confidence excluding stock dividends after pledge (confidence pledge& div), a correlation of four measures by top and bottom 20% cutoff is. al. n. v i n described in Table 4. As shownC in table, the differenceUamong four measures enlarged hengchi. after considering stock dividends. Moreover, higher correlation among excessive overconfidence measures than excessive diffidence manifests CEOs have different consideration between purchases and sales of firm stocks. Table 5 reports the correlation of excessive overconfidence, excessive diffidence and profitability measure and other related control variables. As shown in the tables, industry-adjusted Q, ROA, and ROE have certain positive correlation as same as finance theories. Confidence measure no matter excessive overconfidence or excessive diffidence does not have significant correlation with other variables. Excessive overconfidence measured including stock dividends no matter before or 25.
(27) after pledge are positive to the profitability but excessive diffidence negative while that measured considered stock dividends are reverse consistent the results from statistics summary. Sales and R&D are positive correlated with Q, ROA and ROE and firm age are negative. Table 6 also reports the correlation of excessive overconfidence, excessive diffidence and stock performance and other related control variables. Between the excessive overconfidence and excessive diffident, the total return is negative correlated with excessive overconfidence but positive with excessive diffidence no matter before or after pledge but excessive overconfidence and. 政 治 大 dividends, moving to my prediction. 立. excessive diffidence are all negative correlated to total return after excluding stock. ‧. ‧ 國. Results. 學. V.. sit. y. Nat. In this section, I conduct regressions to examine the relationship between. io. 5.1 Firm valuation. al. n. and stock performance.. er. excessively overconfident CEOs /excessively diffident CEOs and firm profitability. Ch. engchi. i n U. v. To understand the influence of CEO characteristic on firm value, I therefore examine the effect of confidence on future Tobin’s Q, Return on Assets, and Return on Equity (used by Hirshleifer, Low, and Teoh (2010), Fahlenbrach (2007)). Earlier study found that overconfidence increases R&D, which is expensed and therefore mechanically reduces the book value of assets in the short term. Since my three proxies contain assets and equities in the denominator, it is important to control for lagged related expenses in test with these dependent variables. Also factors would not affect firm profitability immediately thus all independent variables are lagged one 26.
(28) period with respect to dependent variables. Considered there is differential effect from varies industries, three dependent variables are industry-adjusted to manifesting the idiosyncratic effect of CEOs. Three regression specifications are defined as:. 立. 政 治 大. For test industry-adjusted Q I approximated by the ratio of the market value of. ‧ 國. 學. assets to the book value of assets and then deduct industry’s median Q. The market. ‧. value of assets is calculated as the sum of the book value of assets in the end of current. sit. y. Nat. fiscal year and the market value of common stocks that stock prices in the end of. io. er. working day of current calendar year less the book value of common stocks and deferred taxes. The end of a fiscal year is similar to the end of working day of calendar. al. n. v i n year thus there is no deviation.C The variable measuring h e n g c h i U the excessively overconfident. CEOs (EO) (excessively diffident CEOs (ED)) is dummy variable that is one if the CEO of the firm is classified as excessive overconfidence (diffidence) and zero otherwise. To testify different influence of different excessive overconfidence (diffidence) level, I set top (bottom) 40%, 30%, 20%, and 10% end cutoffs on the distribution of Net Stock Purchases to examine the influencing trend of confidence level. I show the results in Table 7 where I control the firm characteristic as the natural logarithm of sales and firm age (FA) and R&D scaled by book assets in the beginning of the year in column 1 to 4 and then control for the CEO characteristics as CEO share 27.
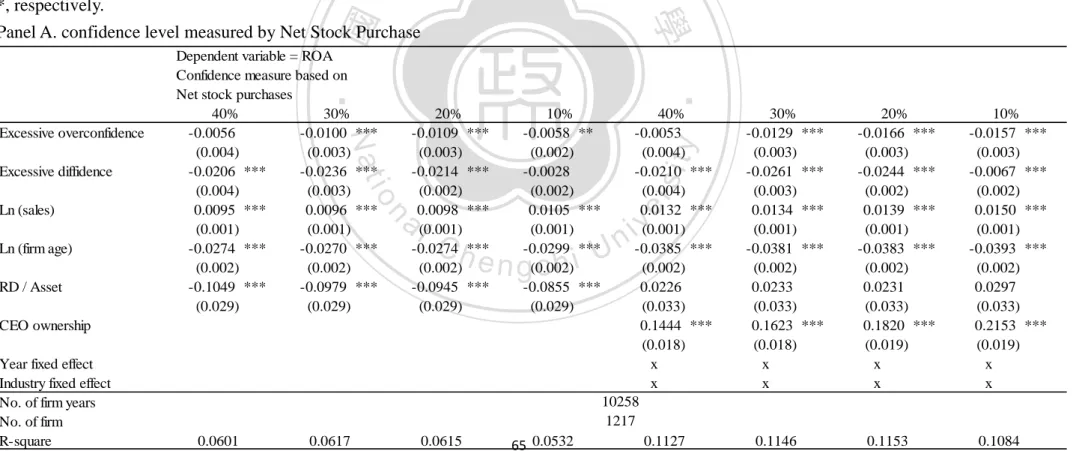
(29) ownership (COW) and conduct year-fixed effect and industry-fixed effect in column 5 to 8. Panel A of Table 7 shows the regression results of Net Stock Purchases, Panel B of Net Stock Purchases after Pledge, Panel C of Net Stock Purchases excluding stock dividends, and Panel D of Net Stock Purchases excluding stock dividends after pledge. As shown in Panel A and B, the coefficients of excessively overconfident CEOs are positive to negative large scale but non-monotonic: the effect of excessive overconfidence rebounds in top 20% cutoff and then goes deeply negative after controlling CEO characteristics. Nevertheless, after strictly measure CEO’s confidence. 政 治 大 conform to the expectation that the coefficients go down to deeply negative straight 立. by excluding stock dividends, the trend of excessively overconfident CEOs on Q. and significant at 1% level in panel C and D. For excessive diffidence, the coefficients. ‧ 國. 學. are negative significantly at 1% but non-monotonic when approaching to the extreme. ‧. cutoffs in Panel A and B and those migrates from positive to negative significantly at. sit. y. Nat. 10% in Panel C and D after considering the stock dividends.. io. er. The excessive overconfident and excessively diffident CEOs are adversely affected firms’ potential growth. The stricter measure of excessively overconfident. al. n. v i n C h excluding stock CEOs measured by Net stock purchases dividends after pledge tells engchi U the coefficients of top 10% is -0.1632 significant at 1%, which suggests that Q in. excessively overconfident CEO firms is 113% less than in moderate overconfident CEO firms. The reasonable measure of excessive diffident CEOs measured by Net stock purchases tells the coefficient of bottom 10% is -0.0396 significant at 5%, which suggests that Q in excessively diffident CEO firms is 27% less than in moderate overconfident firms. Moreover, adverse effect on Q is bigger in excessively overconfident CEO firms than excessively diffident CEO firms. For the second profitability measure industry-adjusted ROA, it is calculated as the ratio of earnings before interests, taxes, depreciation and amortization to book 28.
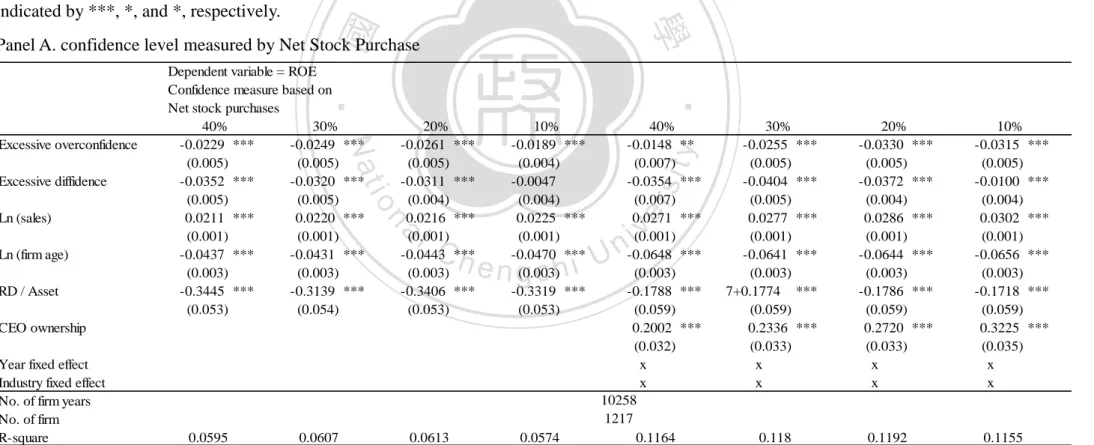
(30) value of asset in the beginning of the year and then adjusted by deducting industry median ROA. All control variables are the same as above of Q and the results are shown in Table 8 with panel A to D. As same as the effect on Q, the coefficients of excessively overconfident CEO are negative to large scale and significantly at 1% but non-monotonic in panel A and B, but those are negative downward straight to large scale and significantly at 1% in panel C and D after considering stock dividends. Also the coefficients of excessively diffident CEO are all negative significantly at 1% but non-monotonic in panel A and B and those moves from positive to negative straight. 政 治 大 As shown in Table 8, the excessive overconfident and excessively diffident 立. and significant at 5% in panel C and D.. CEOs are adversely affected firms’ ROA. The stricter measure of excessively. ‧ 國. 學. overconfident CEOs measured by Net stock purchases excluding stock dividends after. ‧. pledge tells the coefficient of top 10% is -0.0185 significant at 1%, which suggests. sit. y. Nat. that ROA in excessively overconfident CEO firms is 452% less than in moderate. io. er. overconfident CEO firms. The reasonable measure of excessive diffident CEOs measured by Net stock purchases tells the coefficient of bottom 10% is -0.0067. al. n. v i n C hthat ROA in excessively significant at 1%, which suggests diffident CEO firms is engchi U. 164% less than in moderate overconfident CEO firms. Same as Q that adverse effect on ROA is bigger in excessively overconfident CEO firms than excessively diffident CEO firms. Third measure of firm profitability, industry-adjusted ROE, is defined as the ratio of earnings before interests, taxes, depreciation and amortization in the end of the year to the book value of equities in the beginning of the year and then adjusted by industry median ROE. The coefficients of excessively overconfident CEOs are negative monotonic to large scale significant at 1% in Panel B to D and those of excessively diffident CEOs are downward moving significant at 1% but 29.
(31) non-monotonic same as the effect on industry-adjusted ROA. From Table 9, the excessive overconfident and excessively diffident CEOs are adversely affected firms’ ROE. The stricter measure of excessively overconfident CEOs measured by Net stock purchases excluding stock dividends after pledge tells the coefficient of top 10% is -0.0312 significantly at 1% which suggests that ROE in excessively overconfident CEO firms is 148% less than in moderate overconfident CEO firms. The reasonable measure of excessive diffident CEOs measured by Net stock purchases tells the coefficient of bottom 10% is -0.01 significantly at 1%, which. 政 治 大 overconfident CEO firms. Same as Q and ROA that adverse effect on ROE is bigger 立 suggests that ROE in excessively diffident CEO firms is 47% less than in moderate. in excessively overconfident CEO firms than excessively diffident CEO firms.. ‧ 國. 學. From the above three measures of firm profitability, the excessively. ‧. overconfident CEOs do harm the companies and the adverse effect enlarges when. sit. y. Nat. approaching the extreme cutoffs. Like Goel and Thakor (2008)’s prediction, drastic. io. er. overconfident CEOs would overinvest in the projects no matter the positive or negative NPV by overestimate their ability and future firm value under their. al. n. v i n C h diffident CEOsUalso decrease firm profitability. leadership. In the same way, excessive engchi. However, there is weaker effect of excessively diffident CEOs on firm performance, indicating that the underinvestment problem may not obvious or the results are positively biased for liquidity-motivated sales need.. 5.2 Stock performance To understand the performance led by excessively overconfident CEOs and excessively diffident CEOs, two methods Fama-French portfolio and Fama-Macbeth Regression are used in the paper ever applied by Fahlenbrach (2007).. 30.
(32) First, Performance-attribution regression is applied by examining monthly excess return over risk free rate of three equal-weighted portfolios, excessive overconfident CEO portfolio, moderate overconfident CEO portfolio, and excessively diffident CEO portfolio, in the sample from 1992 to 2010. The method to classify CEO confident level is the same as that to proxy firm valuation and described in Appendix A and then assigned firm having one specific confident level CEO measured by lagged one year to the portfolio of that confident level CEO. The portfolio is reset annually. Former literature contributes that several equity characteristics of firms have. 政 治 大. been certified to be significant in forecasting future returns, including market factor,. 立. size, book-to-market ratio and past returns (Fama and French (1992), Fama and. ‧ 國. 學. French (1993), and Carhart (1997)). Thus I estimate above four factor model and focus on the estimated intercept coefficient as the abnormal return to demonstrate. ‧. whether there is a CEO characteristic factor to influence firm stock performance. The. y. Nat. io. sit. four factor premium data is collected from multiple equity factor database of TEJ and. n. al. er. calculated by the method used by Fama and French (1993), and Carhart (1997).. i n U. v. Market factor (RMRF) is the market premium calculated by gross market return over. Ch. engchi. risk-free rate per month, size factor (SMB) the market capitalization premium per month, book-to-market factor (HML) the book-to-market ratio premium per month, and past return factor (Momentum) the annual stock return premium before past two months per month. The dependent variable Excess Return (ER) is the monthly gross return in excess of the risk-free rate, one month time deposit saving rate, from equal-weighted investment portfolios. The simplified result is shown in Table 10 with columns 1 to 4 describing the results of three confidence level portfolios measured by Net Stock Purchases, columns 5 to 8 describing that of three confidence level portfolios measured by Net Stock 31.
(33) Purchases after pledge, columns 9 to 12 describing that measured by Net Stock Purchases excluding stock dividends, and columns 13 to 16 describing that measured by Net Stock Purchases excluding stock dividends after pledge. As the results shown in Table 10, monthly alphas in excessive overconfident CEO portfolio are significantly smaller than that in moderate overconfident CEO portfolio, and go down though non-monotonic when approaching the extreme cutoff of CEO confidence measure by Net stock purchase and Net stock purchase after pledge. However, alphas in excessively diffident CEO portfolio are bigger than that in moderate overconfident. 政 治 大 from above confidence measure indicate the excessively overconfident CEOs have 立. CEO portfolio but insignificant and also go down non-monotonically. The results. adverse impact on firm stock performance but the influence of excessively diffident. ‧ 國. 學. CEOs is not obvious. Moreover, the monthly alphas in moderate overconfident CEO. sit. y. Nat. performance.. ‧. portfolio are significant manifesting that there are other factors to influence portfolio. io. er. After considering stock dividends in measuring CEO confident level, monthly alphas in excessively overconfident CEO portfolio and in excessively diffident CEO. al. n. v i n C hthan that in moderate portfolio are significantly smaller overconfident CEO portfolio engchi U and part of those in moderate overconfident CEO portfolio becomes insignificant, indicating excessively overconfident and excessively diffident CEOs do have some adverse impact on firm stock performance. However, the coefficients in excessively overconfident CEO portfolio are negative but down to zero against to my hypothesis that the adverse influence would be bigger when approaching extreme cutoff of excessively overconfident level measure. The coefficients in excessively diffident CEO portfolio are negative to large scale but then lessened when approaching to extreme cutoff corresponding to my prediction in some manner. From Table 10, the excessive overconfident and excessively diffident CEOs 32.
(34) adversely affect firm stock performance, especially when considering contingent factors to influence the measure of CEO’s confidence level. However, the trend is not going down monotonically when approaching to extreme cutoff of CEO confidence level. Moreover, significant monthly alpha in moderate overconfident CEO portfolio tells that there are definitely other factors to influence the returns of these three portfolios. To find out the possible influencing factors other than above factors on firm stock performance and understand the performance led by excessively overconfident. 政 治 大 return is then conducted for from 1992 to 2010. The Fama-Macbeth regression is 立. CEOs and excessively diffident CEOs, the Fama-Macbeth regression of annual stock. followed:. ‧. ‧ 國. 學 sit. y. Nat. n. al. er. io. The dependent variable is the annual stock compound gross return (R) of firm for. i n U. v. year t. The excessively overconfident CEO and excessive diffident CEO dummies are. Ch. engchi. assigned to the firms by lagged one year. Beta is the systematic risk of a company regressed by annual individual stock excess returns and market excess returns. Excess return is the gross return per year less risk-free rate, one year time deposit saving rate averaged from five major Taiwanese financial institutions. Market return is the return of TSEC weighted index. The book-to-market ratio is calculated by book value of common stock in the end of prior one year plus deferred taxes over market value of common stock in the end of prior year. The market value (MV) is calculated by stock price in the end of last fiscal year multiplying shares outstanding, the return (Return) is compound gross return in the end of last year. All above are proxies as four factors 33.
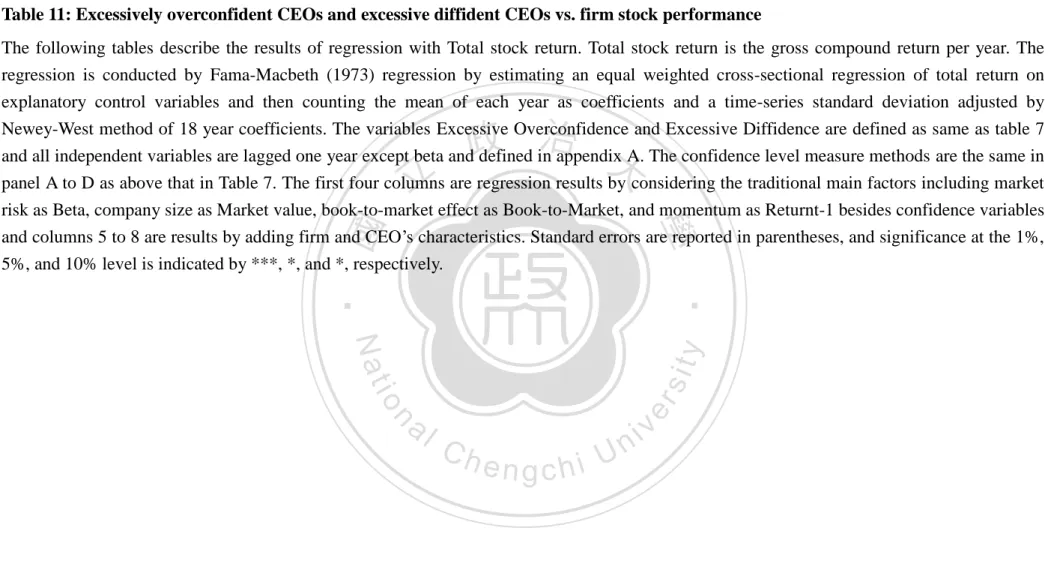
(35) of Fama-French three factors model and one momentum and plus the dummy measured confidence level the results are shown in columns 1 to 4 in Table 10. Then I add related independent variables to the extensive list of characteristics in (Fahlenbrach (2007), Brennan, Chordia, and Subrahmanyam (1998), and Gompers and Metrick (2001)) including Institutional Ownership (IOW) in last fiscal year, Dividend Yield (DY) the ratio of dividends in previous fiscal year to market capitalization of the year, Firm Age (FA) the number of years passed from the year of the firm founded to the last fiscal year, and CEO Ownership (COW) calculated in last. 政 治 大 regressions is used by estimating 立. year summarized in columns 5 to 8. Same as Fahlenbrach (2007), cross-sectional Fama-Macbeth (1973). an equal weighted. cross-sectional regression of total return on explanatory control variables and my. ‧ 國. 學. confidence dummy first and then count the mean of each year as coefficients and a. sit. y. Nat. coefficients.. ‧. time-series standard deviation adjusted by Newey-West method of 18 year. io. er. To understand the performance led by excessively overconfident CEOs and excessively diffident CEOs, the regression of annual stock return is conducted for. al. n. v i n from 1992 to 2010 ever appliedC by Fahlenbrach (2007). h e n g c h i U The dependent variable is the. annual stock compound gross return (R) of firm for year t. The excessively overconfident CEO and excessive diffident CEO dummies are assigned to the firms by lagged one year. Beta is the systematic risk of a company regressed by annual individual stock excess returns and market excess returns. Excess return is the gross return per year less risk-free rate, one year time deposit saving rate averaged from five major Taiwanese financial institutions. Market return is the return of TSEC weighted index. The book-to-market ratio is calculated by book value of common stock in the end of prior one year plus deferred taxes over market value of common stock in the end of prior year. The market value (MV) is calculated by stock price in the end of 34.
(36) last fiscal year multiplying shares outstanding, the return (Return) is compound gross return in the end of last year. All above are proxies as four factors of Fama-French three factors model and one momentum and plus the dummy measured confidence level the results are shown in columns 1 to 4 in Table 11. Then I add related independent variables to the extensive list of characteristics in (Fahlenbrach (2007), Brennan, Chordia, and Subrahmanyam (1998), and Gompers and Metrick (2001)) including Institutional Ownership (IOW) in last fiscal year, Dividend Yield (DY) the ratio of dividends in previous fiscal year to market capitalization of the year, Firm. 政 治 大 fiscal year, and CEO Ownership (COW) calculated in last year summarized in 立. Age (FA) the number of years passed from the year of the firm founded to the last. columns 5 to 8. Same as Fahlenbrach (2007), cross-sectional Fama-Macbeth (1973). ‧ 國. 學. regressions is used by estimating an equal weighted cross-sectional regression of total. ‧. return on explanatory control variables and my confidence dummy first and then. io. er. adjusted by Newey-West method of 18 year coefficients.. sit. y. Nat. count the mean of each year as coefficients and a time-series standard deviation. Table 11 presents the results with panel A describing the confidence measured by. al. n. v i n C hby Net Stock Purchases Net Stock Purchases, Panel B that after Pledge, Panel C by engchi U Net Stock Purchases excluding stock dividends, and Panel D by Net Stock Purchases. excluding stock dividends after pledge. As shown in Table 11, the trend of excessive overconfident CEOs and excessively diffident CEOs on stock performance is non-monotonic. The coefficients of excessive overconfident CEO went down to negative first then up when approaching to the extreme cutoff in every panel. However, only negative coefficients are significantly downward in excessive overconfident CEOs measured as Net Stock Purchases excluding stock dividends after pledge indicating the excessively overconfident CEOs have adverse influence on the stock performance: The coefficient of top 40% to top 30% is -0.0167 and -0.0218 35.
(37) significant at 10%, which suggests that stock return in excessively overconfident CEO firms migrates from 68% less to 89% less than in moderate overconfident CEO firms. For excessively diffident CEOs, the effect is also non-monotonic to the extreme cutoff. Same as of excessive overconfident CEOs, only negative coefficients are significant in excessive diffident CEO measured as Net Stock Purchases excluding stock dividends after pledge indicating that excessively diffident CEOs have adverse influence on stock performance: The coefficient of bottom 30% is -0.0276 significant at 1%, which suggests that stock return in excessively diffident CEO firms is 112%. 政 治 大 From Table 11, I found out that excessive overconfident CEOs and excessive 立. less than in moderate overconfident CEO firms.. diffident CEOs have adverse impact on stock performance but not that significant as. ‧ 國. 學. profitability Q, ROA, and ROE. The pattern is not that clear and insignificant, may. ‧. because the CEOs characteristic overconfidence and diffidence is not easily sensed by. sit. y. Nat. investors or the personal characteristic of CEOs is not the main driver to influence the. io. er. stock performance. As we know, the stock return has been discovered that that is affected primarily by concurrent systematic risk, company size, book-to-market effect,. n. al. Ch. and momentum. From the regression results, I. engchi. v i n found U that. dividend yield and. book-to-market have significant influence power on firm stock performance. Dividend yield is positive significantly at 1% and persistent in all regressions indicating that how many dividends paid would influence the investors’ demand on the stock and future price increase. Book-to-Market are also positive significant at 5% after controlling firm and CEO characteristics showing that return of value stock is higher than of growth stock correspond to our knowledge that the price of value-oriented stock would reverse after long term depression.. 36.
(38) VI. Conclusion In recent decade, there is an increasing interest in researching on the characteristic of CEO to the activity of firm in academy. Although many scholars studied the effect on investment decision and financing decision, there are few papers to study the effect on firm value, the most important affairs investors and managers care about directly and empirically. Thus the paper is to study the relation between the CEOs’ overconfidence and firm performance. The empirical results certified the hypothesis that excessively overconfident and. 政 治 大. excessive diffident CEOs reduce the performance of firms. From the result, the. 立. excessively overconfident and excessively diffident CEOs decrease the firm. ‧ 國. 學. profitability measured by industry-adjusted Q, ROA, and ROE significantly. The adverse effects on firm profitability become large economically and significantly to. ‧. the extreme cutoffs and excessively overconfident CEOs adversely affect profitability. y. Nat. io. sit. more than excessive diffident CEOs. On examining the stock performance, the. n. al. er. excessively overconfident and diffident CEOs have also adverse impact when. i n U. v. compared to moderate overconfident CEOs on significant results. However, the. Ch. engchi. influence on stock performance is minor than on profitability and the pattern is non-monotonic and insignificant when approaching to the extreme cutoff. Overall, these results are consistent with prediction made by Goel and Thakor (2008) and Hackbarth (2008) that excessively overconfident CEOs and excessively diffident CEO may decrease the firm value due to overinvestment and underinvestment problem and moderate overconfident CEO may increase the firm value. The paper extends empirical research on the relationship between CEO overconfidence and firm value. Furthermore, the new classification of CEO 37.
(39) confidence level proposed by Goel and Thakor (2008) is applied firstly to study the relationship between CEO confidence level and firm performance in Taiwanese companies. In addition to providing the evidence on the newly theoretical predictions, using pattern to testify the influence of CEOs’ confidence on firm performance by classifying CEO to excessively overconfident and excessively diffident by set several cut points on the distribution of their net stock purchases activities helps to understand the effect in all round manner. Finally, the research is quite comprehensive as considered the contingent factors such as CEO’s pledge activities and/or stock. 政 治 大 carefully considering those activities prevailing in Taiwan business market, the results 立 dividends that will influence our confidence level measure in Taiwan. Without. may be bias and imprecise as conduct.. ‧ 國. 學. However, there is still some ambiguity needed to be solved. On the dimension of. ‧. corporate finance, the future research could examine why the effect of excessive. sit. y. Nat. diffident CEOs on firm value is non-monotonic to the extreme cutoff, which is the. io. er. reason why the more extreme diffident CEOs are not harm the company that much and even increase the firm value. On the dimension on asset management, the further. al. n. v i n research could be conducted onCthe reason why thereUis less significant influence on hengchi. stock performance from excessively overconfident and diffident CEOs, especially after proving that they reduced the company profitability if the market is efficient. Could investors sense CEOs’ characteristics on confidence level and do they understand their influence on firm profitability would be interesting to study.. 38.
(40) References 1. Anand M. Goel and Anjan V Thakor, 2008, Overconfidence, CEO selection, and corporate governance, Journal of Finance 63, 2737-2784. 2. Andreas Mueller, Overconfidence and increased corporate investment volatility, Working paper. 3. Barber, Brad, and Terrance Odean, 2001, Boys will be boys: Gender, overconfidence and common stock investment, Quarterly Journal of Economics 116, 261–292.. 政 治 大. 4. Ben-David, Itzhak, Campbell R. Harvey and John R. Graham, 2007, Managerial. 立. overconfidence and corporate policies, NBER Working Paper, No. W13711.. ‧ 國. 學. 5. Brennan, M. J., T. Chordia, and A. Subrahmanyam, 1998, Alternative Factor Specifications, Security Characteristics, and the Cross-Section of Expected Stock. ‧. Returns, Journal of Financial Economics 49, 345-373.. y. Nat. sit. 6. Chia-chen Teng and Victor W. Liu, 2011, CEO overconfidence and pecking order. n. al. er. io. prediction – evidence from Taiwanese Electronics Companies.. i n U. v. 7. David A. Hirshleifer, Angie Low, Siew Hong Tech, 2010, Are overconfident CEOs. Ch. engchi. better innovators?, Working paper.. 8. Dirk Hackbarth, 2008, Managerial traits and capital structure decisions, Journal of Financial and Quantitative Analysis 43, 843-882. 9. Fama, E, F, and J, D, MacBeth, 1973, Risk, Return, and Equilibrium: Empirical Tests, Journal of Political Economy 81, 607-636. 10. Gervais Simon, J.B. Heaton, and Terrance Odean, 2008, Overconfidence, investment policy, and manager welfare, Working paper, Fuqua School of Business, Duke University. 11. Gervais, Simon, J.B. Heaton, and Terrance Odean, 2011, Overconfidence, 39.
數據
+4
相關文件
Corollary 13.3. For, if C is simple and lies in D, the function f is analytic at each point interior to and on C; so we apply the Cauchy-Goursat theorem directly. On the other hand,
Corollary 13.3. For, if C is simple and lies in D, the function f is analytic at each point interior to and on C; so we apply the Cauchy-Goursat theorem directly. On the other hand,
Firstly, I analysis and discuss between the subsidy differentiation and routing choices when the public and private transport firms could choose concurrently the
A., and Revang, O., “A Strategic Framework for Analying Professional Service Firms — Developing Strategies for Sustained Performance”, Strategic Management Society
and Clark, K., “Architectural Innovation: The Configuration of Existing Product Technologies and the Failure of Established Firms”, Administrative Science Quarterly,
Thus, this study argued the role and function of KIBS through evolution of local innovation system first; and then, this study analyzed interaction between technical firms and
Secondly, in Chapter 3 we analyze the effect of differentiated soft recreational activity marketing strategies used by firms on the prices of recreational service, profits,
Based on the different recreational choices of tourists, we obtain that under different fame effects the benefits of firms and tourists are different that result from the
