行政院國家科學委員會專題研究計畫 成果報告
水庫優養及藻類物種多樣性動態預測模式及水體物化因子
影響之研究
研究成果報告(精簡版)
計 畫 類 別 : 個別型 計 畫 編 號 : NSC 95-2221-E-002-140- 執 行 期 間 : 95 年 08 月 01 日至 96 年 07 月 31 日 執 行 單 位 : 國立臺灣大學環境工程學研究所 計 畫 主 持 人 : 吳先琪 計畫參與人員: 博士班研究生-兼任助理:簡鈺晴 碩士班研究生-兼任助理:吳金蓉、邱建韶 協同研究人員:傅崇德 處 理 方 式 : 本計畫可公開查詢中 華 民 國 96 年 10 月 28 日
行政院國家科學委員會補助專題研究計畫
■ 成 果 報 告
□期中進度報告
水庫優養及藻類物種多樣性動態預測模式
及水體物化因子影響之研究
計畫類別:
■
個別型計畫 □
整合型計畫
計畫編號:NSC 95-2221-E-002-140-
執行期間:95 年 8 月 1 日至 96 年 7 月 31 日
計畫主持人:吳先琪 教授
協同研究人員:傅崇德
計畫參與人員: 簡鈺晴、吳金蓉、邱建韶
成果報告類型(依經費核定清單規定繳交):
■
精簡報告 □完整報告
本成果報告包括以下應繳交之附件:
□赴國外出差或研習心得報告一份
□赴大陸地區出差或研習心得報告一份
□出席國際學術會議心得報告及發表之論文各一份
□國際合作研究計畫國外研究報告書一份
處理方式:除產學合作研究計畫、提升產業技術及人才培育研究計畫、
列管計畫及下列情形者外,得立即公開查詢
□涉及專利或其他智慧財產權,□一年□二年後可公開查詢
執行單位:台灣大學環境工程學研究所
中 華 民 國 96 年 10 月 27 日
2
摘要
水庫水質之良窳一直是國內外環境保護及水資源相關單位關切的問題,而其中藻類優 養問題適為其最。吾等必須建立預測其發生趨勢的能力,方能採取適當措施,預防優養問 題發生。 自然水體中藻類種數繁多,其消長受到許多環境因子所影響,故欲了解藻類消長之原 因,首要釐清藻類與環境因子間之相關性。本研究希望藉翡翠水庫大壩之藻類族群為例, 探討藻類多樣性之原因。本研究有別於以往完全混合的系統模式,並將環境梯度及藻類層 間混合納入藻類動態系統模式中。 經統計分析藻類與環境因子之相關性,發現藻類週期性的消長主要與季節性物理因子 相關,其中藻類的沉降特性與水體混合程度為藻類生長之重要影響因子。總藻模擬結果來 檢討限制因子對藻類的生長影響時,發現磷之供應是其中較為關鍵的因素。三種藻共存模 擬可以模擬出藻類週期性的消長,推測週期性的變化係因週期性的水體混合機制所致。本 研究認為當環境因子具有適當的時間變異時,有利於不同藻種共存。 關鍵字:藻類,垂直混合,相關性分析,翡翠水庫,動態模擬,生物多樣性Abstract
Water quality in reservoirs is an important issue of concern in terms of water supply nowadays. Eutrophication is a prevailing problem threating the water quality of reservoirs in Taiwan. The ability to forecast the tendency of phytoplankton growth must be established, then the actions to prevent eutrophication can be taken.
There is great number of phytoplankton species in nature water bodies, and many factors interactively affect their growth. How they affect the growth of phytoplankton was examined in this study. First, the relationships between phytoplankton growth and environmental factors must be identified. Feitsui Reservoir is a model water body uesd to study the relationships described above. Second, whether environment gradient is benefitial to biodiversity or not, modeling must be done in this study to determine. Sampling at different depth in Feitsui Reservoir was undertaken to know the spatial distribution characteristics of water quality, phytoplankton and zooplankton growth. A conceptual model including stratified system was established to mimic the reservoir water column, which showed gradients of environmental factors.
According to the statistic analysis, it was found that seasonal growth and decline of algae were related to physical environmental factors which change seasonally. The mobility of phytoplankton and the water column mixing condition are both instrumental in creating the environment of phytoplankton growth. From the simulating results of total amount of algae, phosphorus supply was found an important factor for growth. The model of coexistence of three types of algae is able to simulate algal succession. Periodically water mixing is the driving force of algal succession and beneficial to algae coexistence.
I
Contents
ABSTRACT
1. INTRODUCTION
2. BACKGROUND
2.1 Reservoir characteristics2.2 Variation of the distribution pattern of phytoplankton during the past decade
3. METHODS
3.1 Parameter selection
3.2 Analyses of the relationship between phytoplankton species and environmental factors
4. RESULTS AND DISCUSSIONS
4.1 Results of correlation analyses between phytoplankton species and environmental factors
4.2 Variation of phtoplankton composition with time
4.3 Result of cluster analysis of months of a year base on the similarity on physical parameters
4.4 Relationship between water chemical parameters and the abundance of an algal species within a specific cluster of months
5. CONCLUSION
6. REFERENCE
Figure Content
Fig. 1. Variation in cell number and cell volume of total phytoplankton from Apr. 1995 to Dec. 2004 in Feitsui Reservoir.
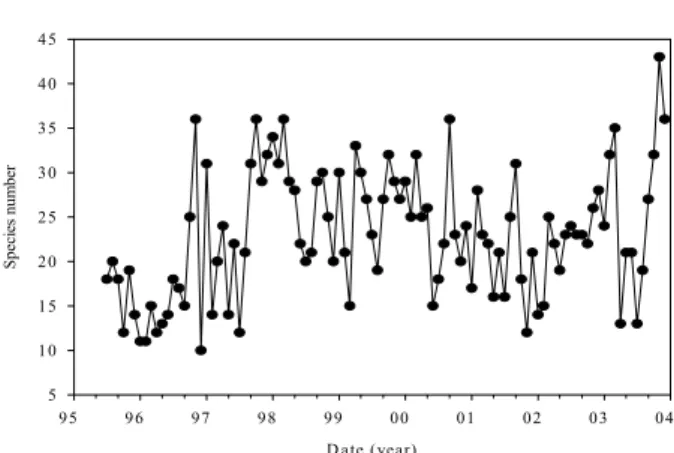
Fig. 2. Variation in species number of total phytoplankton from Apr. 1995 to Dec. 2004 in Feitsui Reservoir.
Fig. 3. The variation of nine-year averaged percentage of cell volume of each month of a year for three clusters of algae.
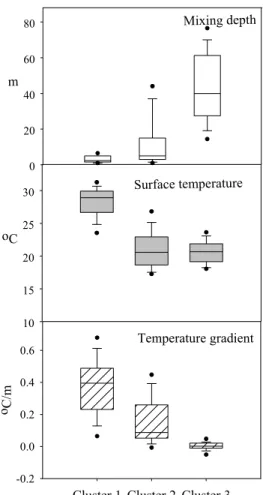
Fig. 4. Comparison of the averages of the temperature gradient, the surface temperature and the mixing depth in 3 clusters of months.
Fig. 5. The variation of nine-year averaged cell volume of each month of a year for three clusters of algae.
Table Content
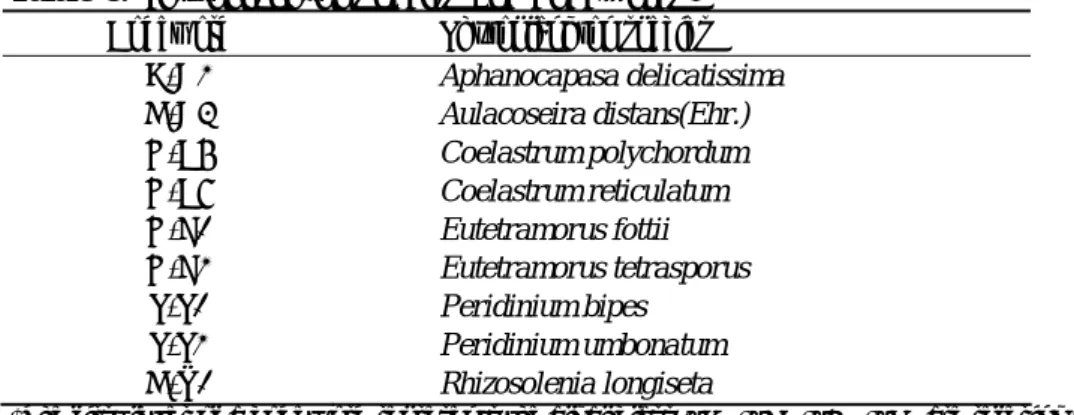
Table 1. Phytoplankton species and codewords.Table 2. Bravais Pearson’s correlation coefficients between physicochemical variables and phytoplankton after logarithmic transformation.
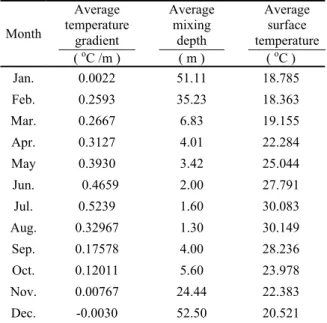
Table 3. Data of average value of temperature gradient, mixing depth and surface temperature from 1995 to 2003 in Feitsui Reservoir.
Table 4. Detailed result of cluster analysis of water column of 3 physical parameters Table 5. Correlation coefficients between physicochemical variables and phytoplanktons at
Identification of physical parameters controlling the dominance
of algal species in a subtropic reservoir
Shian-chee Wu, Yu-ching Chien, Chin-jung Wu and Jiann-shaur Chiu
Graduate Institute of Environmental Engineering, National Taiwan University, 71 Chou-shan Rd. Taipei, Taiwan 10673, ROC , (E-mail: scwu@ntu.edu.tw)
1. INTRODUCTION
Many factors such as grazing pressure, sinking, light availability, nutrient supply and turnover influence the distribution of phytoplankton in time and space (Crumpton and Wetzel, 1982). Most deep temperate and subtropical reservoirs develop thermal stratification every summer. The stratified water column is usually segregated into epi-, meta-, and hypolimnion by the density difference produced via warming of surface water. The stratification strongly affects chemical and biological gradients in vertical direction (Reynolds, 1992; Watanabe, 1992). On the other hand, the stability of water column affects transport of nutrient and phytoplankton, also affects species interactions (Huffaker, 1958; Levin, 1974; Hassell et al., 1994; Kerr et al., 2002; Hulot and Huisman, 2004).
However, it is appearing obvious that phytoplankton succession is periodical. Cyanobacteria and diatom both are seasonally phytoplankton. Cyanobacteria often become concentrated in the metalimnion of thermally stratified lakes during summer (Klemer, 1976; Konopka, 1989; Davis
et al., 2003; Orlando et al, 2007); diatom often become dominating during spring and autumn
(Williams, 1972; Köster and Pienitz, 2006). The patterns must have something to do with the seasonally changing environmental factors.
There have been many investigations on the effects of individual factors on the abundance and composition of algal population. Some investigators reported that the most important controling factor for phytoplankton succession was temperature (Molin and Prezelin, 1996; Alam et al., 2001; Bhave and Borse, 2001). It was found that the growth of some phytoplanktons became increasingly limited by nutrients as the physical habitat progressing from a cool and well mixed one to a warm and stratified one in a temperate lake (Sterner, 1994; Huovinen et al., 1999). Some investigators found that the factor most influencing succession of phytoplankton was seasonal change instead of chemical factors (Alam et al., 2001; Molin and Prezelin, 1996).
This study includes the development of a statistical method to analyze the influence of seasonal factors on phytoplankton growth and then the relationships between the nutrient concentrations and the abundance of different algal species of Feitsui Reservoir from 1995 to 2003. The method of cluster analysis based on three seasonal parameters (surface water temperature, temperature gradient and mixing depth) was used to classify the twelve months into some clusters. Then Bravais Pearson’s correlation analyses among physicochemical variables and phytoplankton in certain cluster of months were conducted to identify the effecting factors other than seasonal parameters on the succession of phytoplankton during the past decade in Feitsui Reservoir.
2
2.1 Reservoir characteristics
Feitsui Reservoir is an on-channel reservoir located in the northwestern part of Taipei at about 160 m above sea lever and has an average depth of 90 m, a catchment area of 303 km2, a total volume of 406 million km3 and a refreshing rate of 3.0 year-1. It has developed a well stratified structure in terms of temperature and density from May to September every year with the highest surface temperature up to 38.5 oC and the hypolimnetic temperature about 16 oC.
2.2 Variation of the distribution pattern of phytoplankton during the past decade
Water quality data and the abundance of phytoplankton species from 1995 to 2003 were obtained in monthly basis by Feitsui Reservoir Authority. Water samples were taken near the dam and at other reaches in the reservoir at the depth of 1 meters monthly. The abundance of phytoplankton in terms of cell number or cell volume has increased in the past decade (Fig. 1). There were only 10 species in Feitsui Reservoir in Dec. 1996, but there were 43 species in Nov. 2003 (Fig. 2). It indicates that the phytoplankton with larger cells has been gaining dominance and the distribution of algae species in Feitsui Reservoir are changing. In fact, Aphanocapsa delicatissima had been dominating for a long time with the relative abundance higher then 40% until its sudden decrease to lower than 10%, even lower then 1% sometimes, in 2002 and 2003. The replacing species were
Coelastrum sp., Eutetramorus sp., Aulacoseira sp., Rhizosolenia longiseta and Peridinium sp.
There must be some environmental factors that have made these changes happen.
3. METHODS
3.1 Parameter selection
Nine major phytoplankton species (Table 1) were chosen to be the targets for species distribution analyses. In addition to eleven water quality parameters (see Table 2) three physical
environmental factors, surface water temperature, temperature gradient and mixing depth were chosen for analyses. The water column can be segregated into epi-, meta-, and hypolimnion by the density difference produced via warming of surface water. Mixing depth is the depth of the upper boundary of the epilimnion. Temperature gradient is estimated with Equation (1). The temperatures at depths of 1 and 10 m were used to calculate the temperature gradient in this study. Temp-grad Z T - TZ Z Z ∆ = +∆ (1) 95 96 97 98 99 00 01 02 03 04 ce ll num be r (c el ls /L ) 0.0 40.0x10⁶ 80.0x10⁶ 120.0x10⁶ 160.0x10⁶ 200.0x10⁶ ce ll vo lu m e (µ m 3/L ) 0.0 20.0x10⁶ 40.0x10⁶ 60.0x10⁶ 80.0x10⁶ 100.0x10⁶ 120.0x10⁶ 140.0x10⁶ cell number cell volume Date (year)
Fig. 6. Variation in cell number and cell volume of total phytoplankton from Apr. 1995 to Dec. 2004 in Feitsui Reservoir. D ate (year) 95 96 97 98 99 00 01 02 03 04 S pec ie s n um ber 5 10 15 20 25 30 35 40 45
Fig. 7. Variation in species number of total
phytoplankton from Apr. 1995 to Dec. 2004 in Feitsui Reservoir.
Table 6. Phytoplankton species and codewords.
Codeword Phytoplankton species
B-A2 Aphanocapasa delicatissima
D-A3 Aulacoseira distans(Ehr.)
G-C6 Coelastrum polychordum
G-C7 Coelastrum reticulatum
G-E1 Eutetramorus fottii
G-E2 Eutetramorus tetrasporus
P-P1 Peridinium bipes
P-P2 Peridinium umbonatum
D-R1 Rhizosolenia longiseta
(The first letter of a codeword represents the algal class. “B”, “D”, “G”, “P” are refering to “Blue-Green algae”, “Diatom”, “Green algae”, “Pyrrophyta”.)
3.2 Analyses of the relationship between phytoplankton species and environmental factors
Pearson correlation coefficient was used to identify the relationship among phytoplankton species and environmental factors after that the data of phytoplankton number had been converted to logarithmic scale. The environmental factors of concern are pH, ammonia nitrogen, organic nitrogen, nitrate nitrogen, calcium, magnesium, organic carbon, reactive phosphorus, total phosphorus, Secchi disk depth, surface temperature, temperature gradient and mixing depth. The first nine items are water chemical parameters, and the next four items are physical parameters.
3.3 Clustering of months of a year
The first step was to get the average of surface temperature, temperature gradient and mixing depth of every month during the past decade. Then, surface temperature, temperature gradient and mixing depth of every month were normalized to individual averages and becoming unitless. Divisive method of cluster analysis was finally used to classify months from July 1995 to
December 2003 into three clusters based on their similarity on the above-mentioned three physical parameters.
4. CONSTRUCTION THE RELATIONSHIPS BETWEEN THE SPECIES
RICHNESS AND THE PHYSICAL PARAMETERS
4.1 Results of correlation analyses between phytoplankton species and environmental factors
To illustrate that how environmental factors affected phytoplankton distribution in Feitsui
Reservoir, correlation analysis was performed between phytoplankton abundances and the values of environmental factors (Table 2). The result indicates that the numbers of phytoplankton species are significantly related to the surface temperature, temperature gradient and the mixing depth in different patterns for different algal species, but are general not related to other chemical
parameters like nitrogen, phosphorus, dissolve oxygen, etc. Apparently, phytoplankton speciation is closely related to seasonal factors. Six phytoplanktons have significant positive correlation with the surface temperature and temperature gradient, however, negative correlation with the mixing depth. Other two species have totally opposite relationships with these three factors. It was found that higher temperature, higher temperature gradient and lower mixing depth in the summer favored the dominance of blue-green, green algae and one species of Pyrrophyta, and were unfavorable to diatoms. The reactive phosphorus concentration was at quite low level (7.4 ± 7 µg-P/L) and had no or negative contribution to the numbers of algae.
4
Since the water body near the dam has low refreshing rate and well stratified water column, which will retard the solute transport from upstream and bottom water to the surface eutrophic zone, the lack of positive correlation between algal cell density and nutrient concentration may be attributed to the rigorous uptake of nutrient under limited re-supply of nutrient. Other than
temperature, which directly affects the growth of algae, temperature gradient and mixing depth indirectly control the phytoplankton growth by altering the mixing and mass-transfer efficiency of nutrients in the water, and the traveling capability of algal cells, which enables the
phytoplankton to find better habitats. Therefore, the influence of the seasonally varying physical parameters outweights the influence of nutrient concentrations in controlling the composition of the phytoplankton community in Feitsui Reservoir.
4.2 Variation of phtoplankton composition with time
By separating 30 phytoplankton species some are not shown in Table 1into three groups based on their patterns of the results of correlation analyses, we have plotted the seasonal changes of cell volume averaged over the 9 years for each month of these three groups in Fig. 3 and 4. There are distinct seasonal patterns for these three groups of phytoplanktons. The first group, including
Ankistrodemus fusiformis, Aphanocapasa delicatissima, Chroococcus minutus, Coelastrum polychordum, Coelastrum reticulatum, Cyclotella stelligera, Eutetramorus fottii, Eutetramorus tetrasporus, Microcystis aeruginosa, Microcystis flos-aquae, Oocystis parva, Peridinium umbonatum, Pseudoquadrigula sp., which are positively related to temperature and temperature
gradient, while negatively related to mixing depth, dominates during the summer. The second group, including Ceratium hirundinella, Chlamydomonas sp., Gymnodinium sp., Peridinium
bipes, Staurastrum biexacavatum, Staurastrum gracile, Stephanodiscus astraea, Tetraedron regulare, which have no correlation with the above-mentioned three physical parameters, gains
abundance in summer and finally dominates during September to November. During the winter only the third group, including Aulacoseira distans, Chlamydomonas sp., Chroomonas acuta,
Cryptomonas caudata, Cryptomonas erosa, Cryptomonas erosa, Cryptomonas ovata,
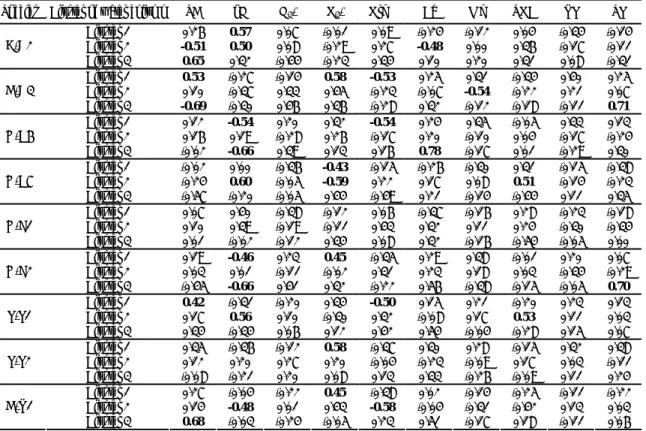
Table 7. Bravais Pearson’s correlation coefficients
between physicochemical variables and
phytoplankton after logarithmic transformation.
B-A2 D-A3 G-C6 G-C7 G-E1 G-E2 P-P1 P-P2 D-R1
pH 0.36 -0.4 -0.08 0.22 0.26 -0.03 -0.22 -0.01 -0.35 NH3-N -0.21 0.1 0.22 -0.15 -0.04 0.17 -0.04 0.09 -0.09 Org-N -0.46 0.4 0.03 -0.16 0.15 0.14 0.07 -0.03 0.22 NO3-N -0.47 0.4 0.03 -0.16 0.15 0.14 0.07 -0.03 0.22 Ca -0.43 0.41 0.05 -0.12 0.18 0.19 0.04 -0.04 0.18 Mg -0.43 0.4 0.05 -0.13 0.17 0.18 0.03 -0.05 0.17 TOC -0.24 0.12 -0.22 -0.17 -0.15 -0.19 -0.09 -0.07 0.02 RP -0.02 -0.02 -0.09 -0.23 -0.32 -0.3 -0.03 -0.15 -0.16 TP -0.2 0.24 -0.05 -0.15 -0.07 -0.03 0.08 0.02 0.03 SD 0.43 -0.13 0.04 -0.04 -0.03 -0.08 0.2 0.02 0.12 Temp. 0.32 -0.34 0.51 0.45 0.47 0.57 0.23 0.4 -0.47 Temp- grad 0.26 -0.41 0.55 0.32 0.22 0.42 -0.02 0.19 -0.37 Zm -0.41 0.29 -0.45 -0.32 -0.35 -0.41 -0.06 -0.23 0.16
(bold values are indicating significant at P < 0.05. “SD”, “Temp.”, “RP”, “TP”, “OrgN”, “Temp-grad”, “Zm” refer to Secchi disk depth, water temperature, reactive phosphorus, total phosphorus, organic nitrogen, temperature gradient and mixing depth.)
Table 8. Data of average value of
temperature gradient, mixing depth and surface temperature from 1995 to 2003 in Feitsui Reservoir. Month Average temperature gradient ( oC /m ) Average mixing depth ( m ) Average surface temperature ( oC ) Jan. 0.0022 51.11 18.785 Feb. 0.2593 35.23 18.363 Mar. 0.2667 6.83 19.155 Apr. 0.3127 4.01 22.284 May 0.3930 3.42 25.044 Jun. 0.4659 2.00 27.791 Jul. 0.5239 1.60 30.083 Aug. 0.32967 1.30 30.149 Sep. 0.17578 4.00 28.236 Oct. 0.12011 5.60 23.978 Nov. 0.00767 24.44 22.383 Dec. -0.0030 52.50 20.521 (Each month average value is calculated with data of the same month of every year.)
Nephroselmis angulatum, Rhizosolenia longiseta, which have negative correlation with
temperature and temperature gradient and positive correlation with mixing depth, has significant quantity. It is surprising that the standard deviations of the monthly averages are small. It means that the seasonal dynamic change of these three groups of algae is quite consistent during these years, and the physical factors, varying seasonally, overweight the influences of chemical factors. It will be interesting if we can isolate the effects of physical factors and let the influence of chemical factors stands out.
4.3 Result of cluster analysis of months of a year base on the similarity on physical parameters
The averages of surface temperature, temperature gradient and the mixing depth of every month during the past decade are listed in Table 3. It is obvious that there is very high similarity of the physical conditions of some groups of months. The twelve months of a year were then grouped into clusters by using cluster analysis in terms of these three physical parameters (Table4). Cluster 1 contains May, June, July, August and September, when the average surface temperature is the highest, the average temperature gradient is also the highest and the average mixing depth is the shallowest, which are all in narrow ranges. Cluster 2 contains February, March, April and October, with low average surface temperature, medium average temperature gradient and also medium average mixing depth, reflecting the similarity of the water column during spring and autumn. Cluster 3 contains November, December and January, when the average surface temperature is the lowest, the average temperature gradient is also the lowest and the average mixing depth is the highest, all in the winters (Table 4 and Fig. 5).
Month
Jan. Feb.Mar.Apr. May Jun. Jul. Aug.Sep. Oct.Nov.Dec.
Pe rce nta ge of c el l volum e (%) 0 20 40 60 80 100 Algae_1 Algae_2 Algae_3
Fig. 8. The variation of nine-year averaged percentage of
cell volume of each month of a year for three clusters of algae.
Month
Jan. Feb.Mar.Apr. May Jun. Jul. Aug.Sep. Oct.Nov.Dec.
C ell v olu me (µ m 3/L ) 1e+4 1e+5 1e+6 1e+7 1e+8 Algae_1 Algae_2 Algae_3
Fig. 10. The variation of nine-year averaged cell volume
of each month of a year for three clusters of algae.
Mixing depth m 0 20 40 60 80 Surface temperature oC 10 15 20 25 30 Temperature gradient
Cluster 1 Cluster 2 Cluster 3 o C/ m -0.2 0.0 0.2 0.4 0.6
Fig. 9. Comparison of the averages of the temperature
gradient, the surface temperature and the mixing depth in 3 clusters of months.
6
Table 9. Detailed result of cluster analysis of water column of 3 physical parameters
Cluster number (Containing month)
Cluster 1 (May ~ Sep.)
Cluster 2 (Feb., Mar., Apr., Oct.)
Cluster 3 (Nov., Dec.,Jan.) Value/ Cluster means
Temperature gradient 0.374± 0.171(oC/m) / 0.675 0.153 ±0.167 (oC/m) / 0.151 0.0025 ± 0.0023 (oC/m) / -1.325 Mixing depth 3.11 ± 1.96 (m) / -0.666 11.32 ± 9.69 (m) / -0.210 42.31 ± 19.67 (m) / 1.390 Surface temperature 28.52 ± 2.22 (oC) / 1.003 21.02 ± 2.86 (oC) / -0.679 20.64 ± 1.73 (oC) / -0.766
4.4 Relationship between water chemical parameters and the abundance of an algal species within a specific cluster of months
Correlation coefficients obtained from the correlation analyses between the total cell volume of a phytoplankton species and a special water chemical parameter in a cluster of months are listed in Table 5. There are more but not many cases in which the abundance of a specific alga is
positively correlated with nutrient concentrations. For example, D-A3 and G-E2 both were strongly induced by the concentration of total phosphorus (TP) in months of cluster 3 (months of Nov. Dec. and Jan. with the highest mixing depth and the lowest temperature gradient). The growth of D-A3, G-E2, P-P2 and D-R1 was enhanced by nitrate nitrogen (NO3-N) all in months
in cluster 1 (May to September with the highest temperature and the most stratified water
columns). Ammonium nitrogen (NH3-N) or reactive phosphorus (RP) was not correlated with the
growth of any algal species.
Table 10. Correlation coefficients between physicochemical variables and phytoplanktons at
differential water column clusters. (bold values indicate significant at P < 0.05)
Species Cluster of water column SD pH NH3-N NO3-N OrgN Ca Mg TOC RP TP
Cluster 1 0.26 0.57 0.07 -0.01 0.09 -0.24 -0.12 0.04 -0.34 -0.14 Cluster 2 -0.51 0.50 0.08 -0.29 0.27 -0.48 0.00 0.36 -0.17 -0.11 B-A2 Cluster 3 0.65 0.32 -0.44 -0.23 0.34 0.10 0.20 0.31 0.08 -0.31 Cluster 1 0.53 -0.27 -0.14 0.58 -0.53 0.25 0.31 -0.34 0.40 0.25 Cluster 2 0.10 -0.37 0.33 0.45 -0.23 -0.07 -0.54 -0.22 0.21 0.07 D-A3 Cluster 3 -0.69 -0.30 0.46 0.36 -0.28 0.32 -0.12 -0.18 -0.11 0.71 Cluster 1 0.12 -0.54 0.20 0.32 -0.54 0.24 0.35 -0.05 0.33 0.13 Cluster 2 0.16 0.19 -0.28 0.26 -0.17 0.20 -0.10 0.04 -0.17 -0.24 G-C6 Cluster 3 -0.02 -0.66 0.39 0.13 0.16 0.78 -0.17 0.01 -0.29 0.30 Cluster 1 -0.02 0.00 -0.36 -0.43 -0.15 -0.26 -0.30 0.31 -0.15 -0.38 Cluster 2 -0.24 0.60 -0.05 -0.59 0.22 0.17 0.08 0.51 -0.14 -0.23 G-C7 Cluster 3 -0.57 -0.20 -0.05 0.44 -0.49 0.21 -0.14 -0.44 0.11 0.35 Cluster 1 0.07 0.40 -0.38 -0.12 0.06 -0.37 -0.16 0.28 -0.23 -0.18 Cluster 2 0.10 0.39 -0.19 -0.11 0.43 0.32 0.11 0.24 -0.30 -0.34 G-E1 Cluster 3 0.01 -0.02 -0.12 0.34 0.08 0.32 -0.16 -0.54 -0.05 0.00 Cluster 1 0.19 -0.46 0.23 0.45 -0.35 0.29 0.38 -0.01 0.20 0.07 Cluster 2 0.03 0.01 -0.11 -0.02 0.31 0.23 0.18 0.03 -0.34 -0.29 G-E2 Cluster 3 -0.45 -0.66 0.41 0.32 -0.22 0.56 -0.38 -0.15 -0.05 0.70 Cluster 1 0.42 -0.31 -0.20 0.34 -0.50 0.15 0.21 -0.20 0.23 0.13 Cluster 2 0.17 0.56 0.10 -0.30 0.32 -0.08 0.17 0.53 0.11 0.03 P-P1 Cluster 3 0.34 -0.34 0.06 0.12 0.42 0.54 -0.04 -0.28 0.15 0.07 Cluster 1 0.35 -0.36 -0.12 0.58 -0.37 0.30 0.28 -0.15 0.32 0.38 Cluster 2 0.12 0.20 0.27 0.20 -0.04 -0.23 -0.09 0.17 0.03 -0.11 P-P2 Cluster 3 -0.08 -0.21 0.20 0.08 0.13 0.33 -0.26 -0.09 0.11 0.24 Cluster 1 0.27 -0.04 -0.22 0.45 -0.38 0.02 -0.14 -0.25 -0.11 -0.22 Cluster 2 0.14 -0.48 0.01 0.43 -0.58 -0.04 -0.31 -0.42 0.13 0.03 D-R1 Cluster 3 0.68 -0.03 -0.24 -0.05 0.23 0.51 -0.17 0.18 -0.11 0.06
By isolating the physical factors we have better understanding on the influence of nutrients on the dynamic change of the speciation of phytoplankton. Except for a few periods of time in a year, nutrient concentrations in water columns are not strong factors influencing the composition of the algal community in Feitsui reservoir. It is understandable that under the condition of limited
nutrient supply most of the nutrients in the water column will be uptaken by phytoplankton cells. There will be only little nutrients left in the water. By rapid recycling the nutrients in the water phytoplankton cells can grow under very low concentrations of nutrients. Therefore, it is the rate of the supply of nutrients that controls the growth of the algae instead of the concentration. Consequently, any physical factors that control the transport of nutrients will also control the growth of algae.
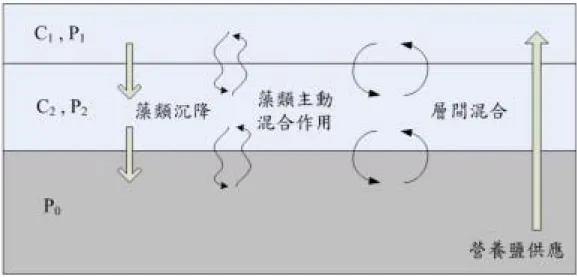
5. MODEL DEVELOPMENT 5.1. Model concepts
A dynamic algal growth model has been developed with the consideration of the physical properties, including the temperature gradient, the mixing coefficient profile and the movement of algae (Fig. 6).
Figure 6. The conceptual diagram of the dynamic algal growth model. C represents the concentration of algae and P represents the concentration of phosphorus.
5.2. Model simulation
Model simulation has been conducted with some assumptions:
1. It is homogeneous for physical and chemical properties in each sub-environments. 2. Light penetrates only 10 m in the water. Simulation were carried out within 10 meters. 3. One dimension transport is assumed. The nutrients come up only from the hypolinium. 4. All phosphorus is bio-available except that in the algal cells.
5. Algal cells will settle down to the lower sub-level or enter other sub-level by mixing.
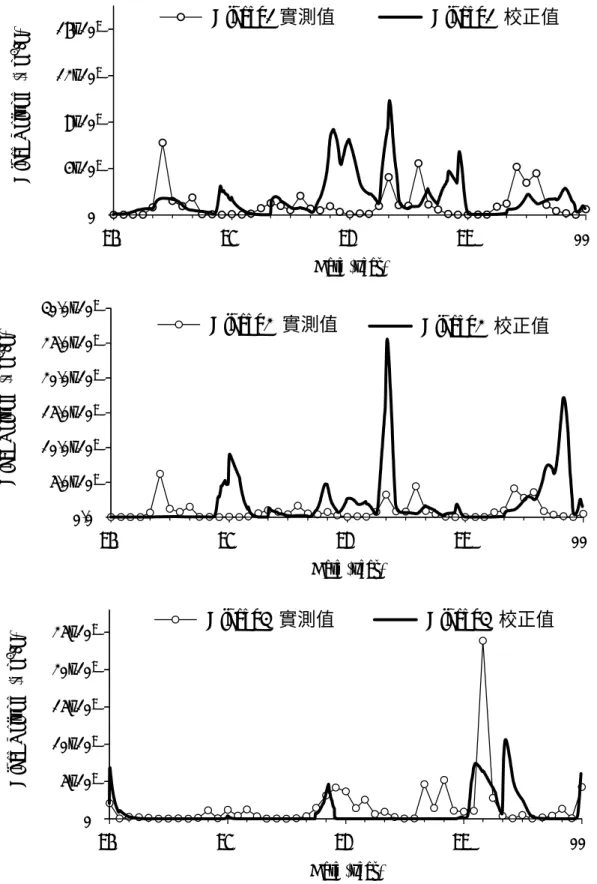
The growth of three algal groups were simulated. The results of simulation are shown in Figure 7. The adopted and best fit parameters are listed in Table 6. The results show that the calibrated growth changes match the trend of the real data. However, there is still needs for the quantitatively predict the growth of algae under seasonally varying water bodies in terms of physical and chemical properties.
8 Date (year) 96 97 98 99 00 A lg ae Vo lu m e ( µm 3 /L ) 0 4x10⁹ 8x10⁹ 12x109 16x109 Algae_1 實測值 Algae_1 校正值 Date (year) 96 97 98 99 00 A lg ae Vo lu m e ( µm 3 /L ) 0.0 5.0x10⁹ 10.0x10⁹ 15.0x10⁹ 20.0x10⁹ 25.0x10⁹ 30.0x10⁹ Algae_2 實測值 Algae_2 校正值 Date (year) 96 97 98 99 00 A lgae Vo lu m e ( µm 3 /L ) 0 5x10⁹ 10x109 15x109 20x109 25x109 Algae_3 實測值 Algae_3 校正值
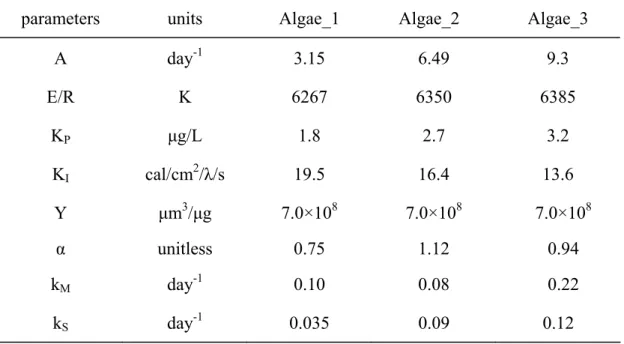
Table 6. Model parameters
parameters units Algae_1 Algae_2 Algae_3
A day-1 3.15 6.49 9.3 E/R K 6267 6350 6385 KP µg/L 1.8 2.7 3.2 KI cal/cm2/λ/s 19.5 16.4 13.6 Y µm3/µg 7.0×10⁸ 7.0×10⁸ 7.0×10⁸ α unitless 0.75 1.12 0.94 kM day-1 0.10 0.08 0.22 kS day-1 0.035 0.09 0.12
5. CONCLUSION
The results of correlation analyses indicate that the species distribution of phytoplankton is
closely related to the surface temperature, temperature gradient and the mixing depth. Nutrients’ concentrations have no significant correlation with the abundance of individual algal species. The re-supply of nutrients, which are controlled by temperature gradient and the mixing depth in this stratified reservoir, plays more important role than the nutrient concentrations in controlling the algal speciation. Months of a year can be classified into three groups based on their
similarity on the pattern of the three physical properties. For some algal species, correlation between the nutrient concentration and the cell number becomes significant in some specific clusters of months after the physical factors have been isolated. Further study should also focus on the effects of physical factors on the mobility and the competitiveness for nutrients and light of individual or groups of phytoplankton. Model simulation seems able to predict the trend of the growth of each algal group, however, not able to predict the value quantitatively.
6.
REFERENCE
Alam M.G.M., Jahan N., Thalib L., Wei B. and Maekawa T. (2001). Effects of environmental factors on the seasonally change of phytoplankton population in a closed freshwater pond.
Environ. Int. 27, 363-371.
Bhave SK, Borse PV. (2001). Seasonal variation in temperature, dissolved oxygen, pH and
salinity and their influence on planktons in Aner river water, Jalgaon, Maharashtra. Polln. Res.
20(1), 79-82.
Crumpton WG, Wetzel RG. (1982). Effects of differential growth and mortality in the seasonal succession of phytoplankton populations in Lawrence Lake. Mich. Ecol. 63, 1723-1739. Davis P.A., Hassell M. P., Commins H. N, and May R. M. (1994). Species coexistence and
self-organizing spatial dynamics. Nature 370, 290–292.
Huffaker C. B. (1958). Experimental studies on predation: dispersion factors and predator–prey oscillations. Hilgardia. 27, 343–383.
10
Hulot F. D., and Huisman J.. (2004). Allelopathic interactions between phytoplankton species: the roles of heterotrophic bacteria and mixing intensity. Limnol. Ocean. 49, 1424–1434.
Huovinen P. S.,Brett M. T. and Goldman C.R. (1999). Temporal and vertical dynamics of phytoplankton net growth in Castle Lake, California. J. Plankton Res. 21(2), 373-385. Hutchinson G. E. (1967). A treatise on limnology. II. Introduction to lake biology and the
limnoplankton. John Wiley and Sons, New York, New York, USA.
Kerr B., Riley M. A., Feldman M. W., and Bohannan B. J. M. (2002). Local dispersal promotes biodiversity in a real-life game of rock-paper-scissors. Nature 418, 171–174.
Köster, D. and Pienitz R. (2006). Seasonal Diatom Variability and Paleolimnological Inferences – A Case Study. J. Paleolimnology 35 (2), 395-416.
Levin, S. A. (1974). Dispersion and population interactions. Am. Nat. 108, 207–228. Moline M. A., Prezelin B. B.( 1996). Long-term monitoring and analyses of physical factors
regulating variability in coastal Antarctic phytoplankton biomass, in situ productivity and taxonomic composition over subseasonal, seasonal and interannual time scales. Mar. Ecol.
Prog. Ser. 145, 143-160.
Orlando L. A., Ana B. G., R. del R. Eduardo, Carmen B. A.and Miguel A. V. (2007).Chemical, physical and biological characteristics of Saladito Reservoir, Cienfuegos Province.
CubaLakes & Reservoirs: Research and Management 12 (1), 43–53.
Reynolds C.S. (1992). Dynamics, selection and composition of phytoplankton in relation to vertical structure in lakes. Arch. Hydrobiol. Beih. Ergebn. Limnol. 35, 13–31.
Sokal, R. R. and Ralf F. J. (1995). Biometry, 3rd. edn. W.H. Freeman and Company, New York, New York, pp. 887.
Watanabe Y. (1992). Effects of thermal stratification on trophic linkages among plankton communities in eutrophic lakes. Arch Hydrobiol. Beih Ergebn. Limnol. 35, 1–12.
Williams L. G. (1972). Plankton Diatom Species Biomasses and the Quality of American Rivers and the Great Lakes .Ecology 53(6), 1038-1050.