國立臺灣大學生物資源暨農學院森林環境暨資源學系 碩士論文
School of Forestry and Resource Conservation College of Bioresources and Agriculture
National Taiwan University Master Thesis
比較系統性與非系統性公民科學資料於鳥類物種豐富 度預測之表現差異
Comparing the Effectiveness of Species Richness Estimation Models by Using Structured and Unstructured
Citizen Science Data in Taiwan
沈芳伃 Fang-Yu Shen
指導教授:丁宗蘇 博士 及 蔡若詩 博士
Advisor: Tzung-Su Ding, Ph.D. & Jo-Szu Tsai, Ph.D.
中華民國 109 年 7 月 July 2020
論文口試委員審定書
Acknowledgements
能在丁宗蘇老師與蔡若詩老師的指導下學習是一件非常榮幸的事情。求學期 間從他們身上學習浩瀚的學術知識與深入的邏輯思考,這緣分與感謝最初其實都 要從大學開始說起(畢竟沒有學士論文,就一併感謝吧~),從當時如何進入到鳥類 與生態界的奧妙世界,到現在念完碩士班。在嘉義大學就讀時,由於進入蔡若詩老
師的研究室,透過參與lab meeting、野外調查後,才知道“做研究”的雛型。在蔡
若詩老師的用心帶領下,我自願擔任蘭潭後山樣區一個月兩次的調查。對於剛進研 究室的我,對於野生鳥類領域,非常生疏。但由於我接下了蘭潭鳥類調查計畫,所 以我加緊腳步,跟隨著蔡若詩老師學習辨識野鳥。慢慢的,我對於野鳥的辨識也更 加熟練。
在接下蘭潭後山計畫約一年之後,我開始思考,我是否應該將我辛苦蒐集來的 資料做一些分析,然後可以發表在研討會上。於是我就開始學習如何做”資料分析”。
從這個過程當中我要感謝: 陳達智、劉奕炘、許景堯、張舜雲、溫唯佳、呂佳家、
張凱筌、林雅雯、廖晟宏、廖珮岑、張家豪等研究室的大家給予我研究上的指導與 建議。另外也特別感謝蔡老師與丁老師的協助,才能將我所執行台灣繁殖鳥類大調 查的研究成果呈現於2018 International Ornithological Congress, Canada (IOC)、2018 臺灣鳥類學術研討雙年會、動物行為暨生態學研討會。這也是我研究生涯中,一個 很重要的里程碑。透過國內外研討會學術交流,讓我認識更多做鳥類研究的大大。
也在交流當中獲益良多,特別感謝: 李壽先、姚正得、劉小如、端木茂甯老師以及 小柯(柯智仁)學長於研討會上給予我在研究上的鼓勵與建議。我還記得 2018 年參
加 IOC 的時候,劉小如老師那時候對我說了一句很重要的話: 「要成為女性科學
家,不容易,請繼續加油!」就因為這麼一句話,我的學術生涯一直維持到現在且 一直保持著初衷。我相信這就是我的宿命吧~哈哈,不過我真的將劉小如老師當作 我的學習目標。劉小如老師對於研究堅持的精神打動了我對於研究的熱情,真的要 謝謝那時候與劉小如老師交流,成就現在的我。
接下來轉眼間大學四年過去了,申請上臺大森林所的我,也要感謝當時蔡若詩 老師引薦我到丁宗蘇老師的研究室。也要真的感謝丁老師願意給我這個機會,給來
我心安了不少。特別感謝:呂立中、尤光平、李先祐、林穆明、蔡芷怡、林佳祈、
Desmond、馮孟婕、沈妤蓮等研究室的夥伴們一直在 401 溫暖的研究室陪著我度過
碩一這一年,也謝謝研究室的大家在lab meeting 上給予我研究計畫的建議。尤其
感謝立中、光神給予我在資料分析上的建議與請教。丁老師知道研究生的辛苦,會 不定期的舉辦”鳥類調查活動”。在忙碌的同時,與丁老師一起享受賞鳥的樂趣!
在碩士班的生涯當中,很榮幸有機會在 Oregon State University (OSU)當交換 學生半年。這些後面所衍生的緣分,都要感謝丁老師願意讓我出國交換(出去玩、
衝lifer?)。也正因為去美國交換,讓我更清楚未來的人生目標。真的很感謝丁老師
給我這個難得的機會出國!透過劉奇璋老師的推薦下認識了楊書旻(Tippi),真的非
常感謝劉老師的牽線。在OSU 特別感謝藍永翔(Sky)、Tippi 學姐在我剛到 Corvallis
陌生環境下收留我並帶我認識與熟悉校園環境。也謝謝當時同行交換生謝淨淳學 姐陪伴。很快的,美國交換生活過去了,總是得回台灣面對現實(做研究、寫論文)。
這趟交換旅行,讓我更清楚知道做研究是我的興趣與熱情。
在最後碩士生涯的半年中,我要真心特別感謝丁老師的用心指導。畢竟出去 (玩了)半年,積的債有點多,讓丁老師負擔比較大,誠摯的感謝丁老師在最後半年 的支持與指教。使我在這半年當中,激勵著我以及給我很大的信任,讓我注意到更 多做研究的小細節,最後使我順利完成學位考試。在最後衝刺階段,特別感謝林佳
祈協助我使用R 語言來分析 eBird 資料、蔡芷怡提供我研究上的想法、鄧翔耀學長
與呂權周於GIS、小柯與蔡明剛於 BBS 資料、陳衍翰學長於 Chao 預測方法操作的
協助。我要感謝所有參與我碩士班口試的口試委員老師們: 丁宗蘇、蔡若詩、許富 雄、林瑞興、端木茂甯老師,在口試中訓練我回答問題以及邏輯思考的能力。謝謝 所有老師給予我研究上的肯定,並支持我的生涯規劃。
最後很重要的支持與陪伴來自於家人以及朋友。謝謝我的父母,不管在金錢支 助或心靈上的協助,都是支持我朝向我夢想前進一個很重要的基石。在爸爸媽媽以 及妹妹的陪伴下,讓我走過我另外一個人生階段。非常感謝父母親,讓我選擇自己 喜歡的道路,你們的尊重與陪伴,我會感恩在心永不忘懷,再次謝謝你們給予我的 關愛。在未來的人生道路上,我會繼續成為你們心中閃耀的寶石! 特別感謝詹政穎,
在我的研究生涯中陪伴我,並支持我,在我需要的時候給予我很大的幫助。
I would like to thank my advisor, Tzung-Su Ding, and my co-advisor, Jo-Szu Tsai, for providing invaluable guidance throughout this research. With their motivation, enthusiasm, and immense knowledge, they encouraged me to better my research and writing. They have taught me the methodology to carry out scientific research and to present my research as clearly as possible. It was a great honor to work and learn under their guidance. I am extremely grateful for what they offered me throughout this process.
I would like to thank my thesis committees: Fu-Hsiung Hsu, Ruey‐Shing Lin, Mao-Ning Tuanmu, for their practical suggestions, insightful comments. On top of that, I would like to say thanks to all the volunteers who devoted to citizen science, making abundant data for the use of scientific purposes.
I express my special thanks for Douglas Robinson, offering a Ph.D. opportunity for me. I would also like to thank him for giving me a chance to share my research together with Tyler Hallman, inspiring me with some great ideas. I am extremely grateful to Tyler Hallman and Nathan Schumaker, continuing to support for this thesis writing. I am extending my thanks to Matthew Betts for providing me an opportunity to attend lab meetings and giving me helpful advice for my research. In particular, I would like to thank Douglas Robinson, Tyler Hallman, Hankyu Kim, Spencer Mair, Josée Rousseau, Jesse Laney, Jenna Curtis, Jane Dolliver, and Suzanne Austin for helping me to get over 100 lifers in Oregon. Also, I express my thanks to Nathan and his family for their invitation to the Thanksgiving party. I am very much thankful to Nethmini Weerasekera for her accompany and caring during my stay on campus.
I would not have finished my Master’s without the support of my family. My father and mother have kept supporting me to achieve my personal goals. Without their support,
Finally, I appreciate all the people who have helped me to complete this research work directly or indirectly. Thank you all.
摘要
物種豐富度常做為物種多樣性評估指標。近年由於公民科學興起,可望成為 蒐集生物多樣性資料的一項方法。公民科學主要分為兩類:系統性公民科學與非系 統性公民科學。系統性公民科學比非系統性公民科學更具有標準化的調查方法,但 志工培訓與參與度維持的成本也較高,資料缺失發生頻率相對較高。非系統性公民 科學沒有一致的標準調查方法,且志工參與條件較低,大量的觀測資料有機會彌補 系統性公民科學的資料缺失。基於非系統性公民科學在調查上的彈性,物種偵測率 與努力量的變異(例如:調查持續時間)都很容造成資料偏差。僅管預測物種豐富 度可以減少不完美物種偵測率所造成的偏差,但在非系統性公民科學中,不同物種 豐富度預測方法的表現仍不清楚。另外,在非系統性公民科學,較缺乏探討時間調 查努力量與物種豐富度之間的非線性關係。本研究使用誤差值(bias),以台灣繁殖 鳥類大調查(BBS)樣區之原始物種豐富度為比較基準,計算與該樣區鄰近範圍 eBird 紀錄清單在標準化時間調查努力量下評估物種豐富度預測表現。我選擇包含在每
個獨立的2×2 km BBS 樣區內所有 eBird 紀錄清單,並計算三種物種豐富度預測方
法中誤差值最小的預測方法。為探討物種豐富度經預測後在標準化時間調查努力 量上的表現,我於四個非線性方程式中探討時間調查努力量與物種豐富度表現最 好的方程式。本研究發現,Chao1 物種豐富度預測方法有最低的誤差值。而冪函數
方程式為解釋時間調查努力量與物種豐富度關係的最佳非線性方程式。在60 分鐘
基準之冪函數方程式上,從原始物種豐富度經過 Chao1 物種豐富度預測後,誤差
值更接近於零(從-0.34 至-0.14)。代表 eBird 物種豐富度經預測後相對於 BBS 紀錄
物種數從 66%提升至 86%。結果指出,單獨使用原始物種豐富度來做物種豐富度
指標時,不完美偵測率可能導致資料誤差。經過物種豐富度預測後會增加物種豐富 度指標的準確度。在非系統性公民科學中,調查方法與物種偵測率影響偵測物種數 量。另外,低時間調查努力量容易產生較高比例的單隻種(singleton),影響物種豐 富度預測的準確性,可能限制非系統性公民科學資料的使用性。本研究建議,非系 統性公民科學的物種豐富度需經過預測才能降低不完美偵測率所造成的資料偏差。
另外,使用 Chao1 物種豐富度方法執行預測時,需評估樣本的單隻種比例所產生
關鍵字:群聚多樣性、物種偵測率、Chao 物種豐富度預測、調查努力量、調查誤 差、監測
Abstract
Ecologists have long recognized species richness as an essential indicator of biodiversity and ecosystem functioning. More recently, citizen science has emerged as a means for collecting species richness data. There are two main categories of citizen science: structured and unstructured citizen science. These two categories employ different investigations methods, as structured citizen science tends to be more rigorous, but requires volunteers with more training and determination, resulting in high frequency of missing observations. In contrast, unstructured citizen science is less formal and easier to participate, and may be considered to make up for missing observations. However, unstructured citizen science tends to suffer from biases due to imperfect species detection probability and variable effort (e.g., survey duration). Although species richness estimation methods have been applied to many datasets in order to account for imperfect detection probability, the ability of these estimators to control for biases and the non- linear relationship between duration and species richness in unstructured citizen science data remain unclear. This study was aimed to investigate the effectiveness of species richness estimation applied to eBird dataset by comparing it to observed species richness of Breeding Bird Survey Taiwan (BBS) sites at a standardized duration. For this comparison, I selected eBird checklists that fell within a 2×2 km square buffer placed around BBS sites across Taiwan. Bias was used to evaluating the effectiveness of species richness estimates from the eBird dataset. I presented three species richness estimation methods based upon the eBird dataset that have been commonly reported in the ecological literature. To measure the reduction value of bias with before and after species richness estimation at a standardized duration, four non-linear functions were first used to examine
selected parsimonious of non-linear function to explain the relationship between duration and species richness. Based on the power function, the eBird dataset can produce species richness estimates comparable to those generated using the BBS dataset raised from 66%
to 86% after applying the Chao1 estimator on the eBird dataset. These results suggested that measuring species richness by raw species count alone would be biased, and species richness estimation takes imperfect detection probability into account, which improved the accuracy of measuring species richness. Survey protocols and species detection probability significantly influenced the species detected in unstructured citizen science data. Problems with biased results derived from high occurrence of singleton species, especially in low-effort surveys, limit the quality and potential uses of unstructured citizen science data. Overall, to accurately present species richness in a given area, I suggest species richness should be estimated, and the effect of number of singletons should be evaluated before applying Chao1 estimation from unstructured citizen science data.
Keywords: community richness, species detection probability, Chao estimator, sampling effort, sampling bias, monitoring
Table of Contents
論文口試委員審定書 ... i
Acknowledgements ... ii
摘要 ... vi
Abstract ... viii
Table of Contents ... x
List of Figures ... xi
List of Tables ... xii
Introduction ... 1
Materials ... 8
1. Study site ... 8
2. Bird datasets ... 8
Methods ... 13
1. Bird data ... 13
2. Statistical analysis ... 19
Results ... 26
1. Observed species richness ... 26
2. The performance of species richness estimation methods ... 27
3. Relationship between duration and observed species richness ... 30
4. Bias reduction after species richness estimation ... 32
5. Improvement of proportion of species richness against BBS dataset after the Chao1 species richness estimation ... 36
Discussion ... 40
1. Non-linear relationship – the effect of duration on species richness and bias ... 40
2. Species richness estimation methods ... 41
3. Species richness biases in eBird relative to BBS ... 43
4. Issues of overestimation from the Chao1 estimator ... 47
References ... 51
List of Figures
Figure 1 Location of the 457 BBS sites surveyed on Taiwan island from 2009 to 2017 ... 10 Figure 2Distribution of selected 204 BBS sites (orange-colored) across Taiwan island from the original of 457 BBS sites from 2009 to 2017 ... 15 Figure 3 Distribution of eBird checklists reported locations across Taiwan. A total of 2591 locations were reported from 2008 to 2018. ... 18 Figure 4 Distribution of selected 92 BBS sites with criteria of 10 points/site from 2010 to 2017 across Taiwan from the original of 457 BBS sites ... 25 Figure 5 Observed species richness per checklist recorded in BBS and eBird datasets.
BBS dataset included 2238 visit-based checklists, with a total of 204 sites. eBird dataset included 2164 checklists ... 26 Figure 6 Performance of Chao1, ICE and Jackknife estimators on species richness estimation methods. Bias was measured by comparing the result of each estimation method against compiled species richness from each BBS site. ... 29 Figure 7 The relationship of duration and observed species richness from eBird
checklists (n = 14596) ... 31 Figure 8 The relationship of duration on eBird checklists and bias (observed species richness of eBird vs. observed species richness of BBS) across 204 BBS sites ... 34 Figure 9 The relationship of duration on eBird checklists and bias (estimated species richness of eBird vs. observed species richness of BBS) across 204 BBS sites ... 35 Figure 10 The relationship of duration on eBird checklists and bias (observed species richness of eBird vs. average observed species richness of BBS) across 92 BBS sites. . 38 Figure 11 The relationship of duration on eBird checklists and bias (estimated species richness of eBird vs. average observed species richness of BBS) across 92 BBS sites. . 39
List of Tables
Table 1 Performance of three species richness estimation methods for the eBird dataset against observed species richness from the BBS dataset, evaluated by the result value of bias summarized by all included checklists (n = 14596). Bias was calculated to make a comparison among estimators. ... 28 Table 2 One-tailed Wilcoxon rank-sum test between species richness estimation
methods ... 28 Table 3 BIC model selection results from the relationship of duration and observed species richness ... 30 Table 4 Parameter estimates from the power function by least squares method on the relationship of duration and observed species richness ... 30 Table 5 Parameter estimates from the power function by least squares method on the relationship of duration and bias (observed species richness of eBird vs. observed species richness of BBS) ... 34 Table 6 Parameter estimates from the power function by least squares method on the relationship of duration and bias (estimated species richness of eBird vs. observed species richness of BBS) ... 35 Table 7 Parameter estimates from the power function by least squares method on the relationship of duration and bias (observed species richness of eBird vs. average
observed species richness of BBS) ... 38 Table 8 Parameter estimates from the power function by least squares method on the relationship of duration and bias (estimated species richness of eBird vs. average
observed species richness of BBS) ... 39
Introduction
Biodiversity loss impacts ecosystem functions and ecosystem services worldwide (Cardinale et al., 2012). In recent decades, the loss of biodiversity has been driven largely by habitat fragmentation and conversion, invasions of non-native species, and by climate change (Schumaker, 1996; Fahrig, 2003; Clavero et al., 2009; Pacifici et al., 2015). Given these trends, it has become essential that scientists develop methods for measuring biodiversity, and tracking its change through time. Species richness, defined as the number of species in a local community (Gotelli & Colwell, 2001; Soroye et al., 2018) is one of the most common measures of biodiversity. But quantifying species richness is expensive and labor-intensive, and often beyond the means of modestly funded research studies. In contrast, citizen science has recently emerged as a means for rapidly and efficiently collecting species richness data.
In citizen science projects, volunteers participate in, and contribute to scientific projects (Dickinson et al., 2010). Citizen science exists in many forms, for example, volunteers assist with biodiversity monitoring (Dickinson et al., 2010), take part in recreational or nature-based activities, or contribute to research studies with inherent value (Sullivan et al., 2014; Geoghegan et al., 2016). Citizen science provides unique and valuable opportunities for the public to become involved in species conservation. In such cases, the data collection process often involves documenting species richness, which benefits the measurement of biodiversity. The potential for citizen science to contribute substantially to formal biodiversity research has been increasing as more data are collected by citizen science volunteers (Dickinson et al., 2010).
Citizen science is grouped into two principal categories: structured citizen science (e.g., the Christmas Bird Count, the North American Breeding Bird Survey) and unstructured citizen science (e.g., iNaturalist, eBird). Structured citizen science aims to
improve the quality of data through volunteer training, thereby increasing the identification rate, determining the survey locations, and time of survey to standardize sampling effort (Soroye et al., 2018). On the other hand, volunteers to this unstructured citizen science do not receive mandatory training and allowing observations to be reported at any time and space (Soroye et al., 2018). In contrast to unstructured citizen science, structured citizen science projects usually follow a standard survey protocol.
In Taiwan, the Breeding Bird Survey Taiwan (BBS Taiwan, hereafter referred as BBS) serves as an example of structured citizen science, since the BBS follows a standard survey protocol. Volunteers participating in BBS visit each BBS site twice a year during the breeding season, and always adhere to a rigorous data collection methodology.
Nevertheless, the effort placed upon recruiting BBS volunteers is quite high, and logistical constraints such as extreme weather events or road maintenance can interfere with data collection (Theobald et al., 2015). As a consequence, datasets acquired through structured citizen science frequently have gaps resulting from missing observations.
eBird is a large biodiversity-related citizen science project, managed by Cornell Lab of Ornithology. eBird’s mobile app allows a wide range of skill levels of birders to collect observations anywhere in the world, documenting bird abundance, distribution, and date of survey through checklist data. eBird project, on the other hand, provides an illustration of unstructured citizen science. While this category of citizen science projects tends to be less structured, they incorporate more variance from a survey, and produce abundant observation data. Consequently, it is thought that species richness data from eBird might be used to make up for missing observations in BBS surveys. In addition, it is straightforward to access eBird datasets via an online database. Still, eBird datasets will
probabilities and variable sampling efforts (Crall et al., 2011; Bird et al., 2014; Steen et al., 2019). Such problems have reduced the potential of eBird datasets to fill gaps in the datasets compiled through formal research activities or structured citizen science projects.
Unstructured citizen science has generally been recognized as suffering from issues of bias resulting from the large numbers of inadequately trained participants these efforts rely upon. Surveying variability frequently contributes to biased measurement of local species richness, and can be attributed to two primary sources: (1) variable survey effort over time; (2) variable species detection probability and surveyor identification skills (Crall et al., 2011; Bird et al., 2014; Steen et al., 2019). In fact, bias attributable to variable duration of effort has emerged to become the most common signature of unstructured citizen science (Dickinson et al., 2010). Duration strongly affects the number of species detected (Gotelli & Colwell, 2001; Chao & Chiu, 2014). However, duration is rarely used to correct species richness measures when comparing different communities (Walther & Martin, 2001). This problem is especially prevalent in eBird datasets, as the surveyor may adopt any survey duration, based solely upon their interest.
For example, it has been found that using uneven duration of datasets for each host species could cause a pseudo positive correlation between parasite species richness and duration (Walther et al., 1995). If samples are standardized by using equal duration, a comparison would be more accurate and informative on species richness measurements (Colwell &
Coddington, 1994). Failure to take into account of variable duration and the lack of standardization can strongly bias the measurement of species richness.
Survey bias resulting from variable species detection probability and surveyor identification skills has also become an important area of concern in regards to citizen science studies (Crall et al., 2011; Bird et al., 2014). Species detection probability can be defined as the probability of detecting at least one individual of a species during a fixed
period of time in a given area (MacKenzie et al., 2002). Unfortunately, species detection probability is never invariant; thus, a complete count of species over an area is almost impossible to achieve (Kellner & Swihart, 2014). In practice, vegetation structure, time of day, weather condition, surveyor identification skills, and species rarity all affect species detection probability (Robbins, 1981; Pacifici et al., 2008; Kellner & Swihart, 2014; Guillera‐Arroita, 2017). For surveyor identification skills, bias can also be introduced when some surveyors collect more accurate or thorough data than others.
Together, these sources of uncertainty limit our ability to assess the accuracy of citizen science data sets, especially when the intent is to quantify species richness.
However, few studies have accounted for imperfect species detection probability, leading to persistent underestimates of true species richness (Chao & Chiu, 2014). In fact, Walther and Moore (2005) concluded that, as an index, observed species richness usually leads to the worst performance in comparison to other species richness estimation methods. Species richness estimation methods account for imperfect detection probability, and attempt to estimate true species richness in a community from incomplete samples (Walther & Moore, 2005). Non-parametric methods of species richness estimators make no assumptions about species detection probabilities (i.e., heterogeneity among species detection probabilities) or species abundance distribution (Chao & Chiu, 2014). Chao1 (Chao, 1984; Chao & Chiu, 2014), Incidence-based Coverage Estimator (ICE) (Chao &
Chiu, 2014) and first-order Jackknife (Burnham & Overton, 1978; Colwell & Coddington, 1994) are commonly used assessment methods.
The Chao1 index is calculated based upon an assumption that the probability of finding a new species in an additional sample approximately equals to the proportion of
from both the occurrence probability of species and the estimated sample coverage ( i.e., the proportion of the total incidence probabilities of observed species), based on the reference sample (Chao & Chiu, 2014). Jackknife was developed mainly to reduce the bias of a biased estimator; it uses the number of singletons to represent the undetected species (Chao & Chiu, 2014). As a consequence, problems with over-reporting rare species and under-reporting common species are common in unstructured citizen science datasets (Dickinson et al., 2010), and they influence estimates of species richness in applying those methods (Tyre et al., 2003; Jarzyna & Jetz, 2016).
While citizen science brings significant benefit of large datasets, problems with variable duration serve as a fundamental obstacle, especially in unstructured citizen science data. Walther et al. (1995) concluded that using a linear relationship to control for the effect of duration on species richness estimates could be misleading. In general, as sample size increases, the discrepancy between observed and true species richness decreases (Bean et al., 2012). A non-linear function could be applied to illustrate the relationship between sample size and observed species richness (Flather, 1996). Four non-linear functions are applicable for fitting species-accumulation relationship – Gompertz function (Zeide, 1993); Power function (Flather, 1996); Schumacher function (Schumacher, 1939); and Logistic function (Zeide, 1993). The Gompertz, Schumacher, and Logistic functions, were commonly applied to a growth model (Zeide, 1993). The power function was original to present the species-area relationship (Preston, 1962). The properties of all the above non-linear functions indicate that as the sample size increases, they will reach the asymptotic value. Although it has been found that a non-linear relationship exists between the number of individuals encountered and species richness (Colwell et al., 2012), the relationship between duration and species richness is still poorly understood, particularly in data sets derived from unstructured citizen science.
As a result, the biased measures of species richness derived from unstructured citizen science data may produce misleading assessments of community composition.
Better accounting for the duration and imperfect detection probability of each checklist will produce a better understanding of measures of species richness (Bird et al., 2014).
While many studies have focused on the quality and reliability of citizen science data (Bird et al., 2014; Kamp et al., 2016; Callaghan et al., 2017), few have addressed the problem of non-standard survey duration, or have assessed the accuracy of species richness derived from unstructured citizen science data (Dickinson et al., 2010).
Developing a more thorough understanding of the effect of duration on species richness measurement should help researchers to take better advantage of unstructured citizen science data.
Soroye et al. (2018) found that few studies have assessed the reliability of unstructured citizen science data by comparing them to professionally monitoring citizen science datasets. But doing so is certainly possible, as it would be straightforward to make use of comparisons between species richness estimates obtained from professional assessments and unstructured citizen science to estimate the effect that variable duration has on accuracy (Walther & Morand, 1998; Walther & Martin, 2001; Walther & Moore, 2005). Measures of bias are used to calculate the closeness of an estimate to an accepted reference value, or to true species richness (Walther & Martin, 2001; Walther & Moore, 2005). Structured citizen science programs can extend the geographic range of surveys, can expand survey effort by adding many survey points, and when coupled with a standard survey protocol, may accurately estimate the true species richness in a community (Walther & Martin, 2001). Once sample bias and duration have been
richness data generated from unstructured citizen science to that produced by structured citizen science.
In this study, I assert that BBS represents structured citizen science data, and eBird represents unstructured citizen science data. I treated species richness measures derived from a BBS dataset as a standard to represent an accepted reference value, and made comparisons with an eBird dataset to: 1) investigate the difference in observed measures of species richness derived from the BBS and eBird datasets; 2) identify the least biased non-parametric method of estimating species richness applied in the eBird dataset; 3) explore the effect of survey duration on observed species richness using four non-linear functions applied to the eBird dataset; 4) measure the value of bias based on a non-linear function for the application of species richness estimation on eBird dataset, and 5) calculate the increment percentage of species richness derived from species richness estimation applied to the eBird dataset based on a 60-minutes of a non-linear function.
Materials 1. Study site
This study was focused on Taiwan island (from 119°59’48.82’’E to 122°0’26.97’’E; from 21°53’44.16’’N to 25°18’10.10’’N), an area of approximately of 36,000 km2 with highest elevation of 3952 m a.s.l. The adjacent islands under jurisdiction of the Republic of China (commonly known as “Taiwan”), including Xiaoliuqiu, Lanyu, Green Island, the Penghu Archipelago, the Dongsha Islands in the South China Sea, and the two islands groups bordering mainland China, the Matsu Archipelago and the Kinmen Islands, were not included in this study. According to 2020 Chinese Wild Bird Federation Checklist of Birds of Taiwan (Ding et al., 2020), a total of 634 bird species have been recorded in Taiwan, including 153 resident bird species and 16 summer visitor species.
2. Bird datasets
a) BBS dataset
The BBS monitoring program, led by Endemic Species Research Institute in Taiwan, has been conducted since 2009. The aim of the BBS is to monitor the long-term population dynamic of breeding birds in Taiwan. The BBS dataset included 457 BBS sites located across the Taiwan island from 2009 to 2017 (Figure 1), ranging from 0 m a.s.l. to 3900 m a.s.l. Each BBS site included 6 to 10 points located within an area of 2×2km, and each point was spaced at least 200 m apart.
The BBS surveys were conducted by point counts from local sunrise to 4 hours after local sunrise in good weather conditions (i.e., no rain during the survey). The surveyor counted and recorded the number of all the birds heard or seen for six minutes at each point in three distance bands (0–25, 25–100, and >100 m). Birds heard or seen
twice in each year except of the year 2009, which was visited three times in a year. These two visits of a given site should be at least two weeks apart. In order to match the bird breeding season at different altitudes of Taiwan, low-elevation sites (<1000 m a.s.l.) were surveyed once in March and once in May; mid-elevation sites (1000–2500 m a.s.l.) were surveyed once in April and once in June; and high-elevation sites (>2500 m a.s.l.) were surveyed once in May and once in June. Each visit of a BBS site included a total duration of between 36 to 60 minutes (6–10 points) and a total survey area of between 0.1884 to 0.3140 km2 (based on the 100 m radius circles).
Among the 142 BBS sites originally established since 2009, only 27 BBS sites (19%) were continuously surveyed until 2017 (Table S1). The Endemic Species Research Institute recommended that a maximum of four surveyors could participate in each visit, in order to control the effect of number of surveyors on the survey. From 2009 to 2017, only 0.42% of the 4949 visits had five or more surveyors. The average of observed species richness reported from each point was 7.16 species (Figures S1). The average of observed species richness reported from each visit was 15.78 species (Figures S2). In the rank abundance distribution plot of all BBS survey data from 2009 to 2017, I applied the Null, Preemption, Log-normal, and Zipf models evaluated by Bayesian Information Criterion (BIC). The Log-normal distribution (BIC = 43335) has the best fit among all the models for rank abundance distribution from a total of 4949 visits (Figure S3).
Figure 1Location of the 457 BBS sites surveyed on Taiwan island from 2009 to 2017
b) eBird dataset
I downloaded eBird data recorded from 1967 to 2018 through the eBird database (https://ebird.org/data/download/ebd). eBird database has recorded more than four hundred thousand checklists in Taiwan (as of July 2020) (https://ebird.org/taiwan/home).
Four primary survey protocols have been defined in eBird – stationary, traveling, historical, and incidental. The definitions of the four primary survey protocols are as follows: (1) stationary survey protocol follows in a single fixed location with no more than 30 m away from the starting point of the checklist, and the surveyor is required to know the exact start time and duration. According to the eBird’s survey protocol recommendation, duration under three hours makes the better information of the checklist (i.e., shorter checklist gives scientists more accurate information about the exact location and time of birds occurrence); (2) traveling survey protocol follows a distance with more than 30 m away from the starting point of the checklist, and the surveyor is required to know the exact start time and duration. In addition, the specific distance of traveling is required to submit or the surveyor needs to estimate the distance traveled to the best of their ability. The eBird’s survey protocol recommends keeping traveling distance under eight km in order to make a better quality of checklists; (3) historical survey protocol only requires the surveyor to know the date of birding. In other words, the exact time of day, duration, and distance traveled are not required to submit. In some cases, historical checklists may consist of historical bird watching events. For example, data from the Taiwan Bird Record of Chinese Wild Bird Federation (CWBF), had recorded 102,716 checklists from 1972 to 2017 (Lin et al., 2020). However, some locations and duration reported were not accurate from the CWBF dataset; (4) incidental survey protocol refers to those checklists which bird watching is not the primary purpose (e.g., attention might be focused on driving, gardening or doing indoor activities). Incidental checklists lack
important survey information (e.g., the exact start time, duration, and distance traveled) and are less useful for scientific purposes. The eBird database also notifies “complete checklists,” which surveyors report all bird species they were able to detect and identify (does not exclude species or report only highlights). On the other hand, an “incomplete checklist” happens when surveyor intentionally omits any wild bird species that was present, detected, and identified (exclude introduced species, invasive species, and heard or seen-only species). Still, it is feasible to omit any captive species.
In the rank abundance distribution plot of all eBird data recorded in Taiwan from 1967 to 2018, I applied the Null, Preemption, Log-normal, and Zipf models evaluated by BIC. The Log-normal distribution (BIC = 907987) has the best fit among all models for rank abundance distribution from a total of 313,050 eBird checklists (Figure S4). In addition, the three most common sampling protocols each made up nearly one-third of the total dataset: stationary (31.21%), historical (31.34%), and traveling (30.35%), incidental (7.07%) (Figure S5). Checklists with a duration of ≥6 minutes made up 93.48% of the dataset (Figure S5 and Figure S6).
Methods 1. Bird data
a) BBS dataset
I obtained BBS dataset recorded from 2009 to 2017 through the Endemic Species Research Institute, Taiwan (https://sites.google.com/a/birds-tesri.twbbs.org/bbs- taiwan/bbs-zi-liao-shen-qing). I selected data which were recorded from March to July. I excluded BBS sites that contained less than 6 points and BBS data that were recorded farther than 100 m from each point. I only included bird species that regularly breed in Taiwan during the breeding season. A total of 135 diurnal resident and summer visitor bird species from BBS dataset were included in this study (Table S2). Thus, non-breeding bird species (i.e., wintering, transient migrant, pelagic seabird, vagrant, and introduced species) were all excluded throughout the study (Table S2). The migratory statuses of bird species followed the 2020 Checklists of Birds of Taiwan, Chinese Wild Bird Federation.
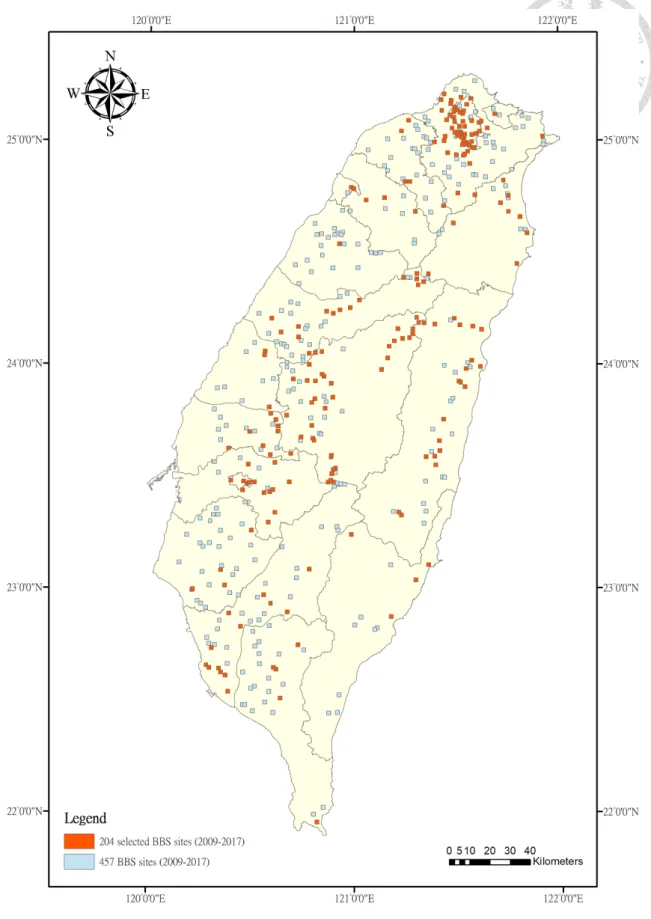
To make our results comparable to the eBird database, I only selected BBS sites which included at least six completed and approved eBird checklists within a 2x2 km square buffer based on centroid point from each BBS site with ArcGIS 10.6. More than half of the BBS sites (55%) included less than six completed and approved eBird checklists (Figure S7). The main principle for establishing BBS sites is based on the criteria to include national parks, important bird and biodiversity areas (IBA), and wildlife refuges, which represents the complete breeding bird community and environment in a particular area. The BBS sites established along the coast are intended to include more types of habitats (habitat heterogeneity). Thus, to exclude the main habitats of the most wintering, transient migrant, and pelagic seabird species, I removed BBS sites which were intersected with coastline. A total of 204 BBS sites were retained after selection (Figure
2). Among the 204 remaining BBS sites (n = 2238 visits), 165 sites were located in low- elevation (<1000 m a.s.l.); 29 sites in mid-elevation (1000–2500 m a.s.l.), and 10 sites in high-elevation (>2500 m a.s.l.) (Table S1).
Figure 2 Distribution of selected 204 BBS sites (orange-colored) across Taiwan island from the original of 457 BBS sites from 2009 to 2017
b) eBird dataset
I included eBird dataset recorded from March to July, 2008 to 2018. As described above, I only included diurnal birds that breed in Taiwan. A total of 144 bird species from eBird dataset were included in the study (Table S2).
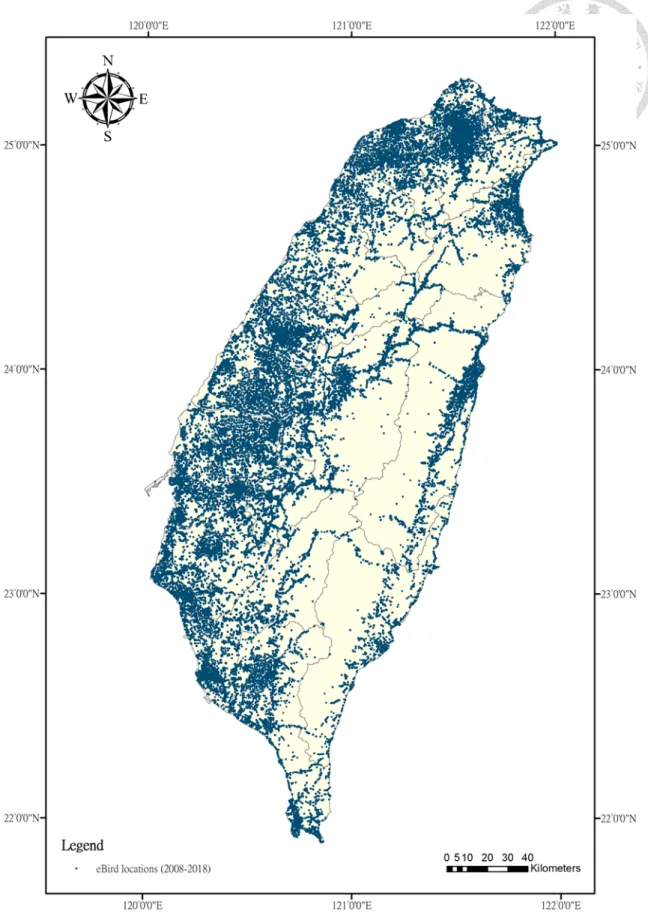
I selected the completed and approved checklists which were intersected within a 2x2 km square buffer based on centroid point from each BBS site with ArcGIS 10.6. A total of 2591 locations were reported across Taiwan’s main island (Figure 3). If any location where eBird checklists uploaded was intersected from two or more BBS sites at the same time, I treated eBird checklists separately belonging to each BBS site; though, this rarely occurred.
To avoid duplicate checklists in the eBird and BBS datasets, I excluded eBird checklists with location names that had similar patterns to BBS sites, such as “BBS-A35- 19”. For survey protocol selection, I selected checklists from the three most common survey protocols, as follows: stationary, traveling, historical (including data uploaded from the Taiwan Bird Record of Chinese Wild Bird Federation). I only included checklists that were at least 6 minutes in duration for the comparison to the BBS dataset (Figure S6). Based on the two primary high intensity periods of bird activity during a day (Robbins, 1981), I restricted eBird checklist start times to after 4 AM and end times to before 7 PM (Figure S8). The number of surveyors in each eBird checklist was mostly under four persons (Figure S9), which matches the BBS survey protocol of including under four surveyors in each visit.
To minimize misleading results of species richness estimation in subsequent analyses, I removed the whole checklist if any bird species was reported as “X” (no
Incidence-based species richness estimation, which only requires to submit presence- absence data, I transformed any species reporting more than one individual to “1”. I removed species independently with the individual count which obtained “NA” (no data available) from the report. To represent the presence of a species, I transformed any species reporting as “X” to “1”, without removing the whole checklist. Also, I removed the duplicated checklists, which were usually shared by individuals of same birding group, based on the sampling event identifier. Eventually, a total of 14596 checklists that fell within BBS sites were collected for further analyses.
Figure 3 Distribution of eBird checklists reported locations across Taiwan. A total of 2591 locations were reported from 2008 to 2018.
2. Statistical analysis
a) Observed species richness comparison
The different BBS survey methods employed in 2009, caused a different time of duration in each visit than other years (i.e., 6-minute point count surveys were conducted from 2010–2017, while 9-minute point count surveys were conducted in 2009). I therefore removed all visits from the BBS dataset from 2009.
To make the results comparable, I compiled species records and duration of survey points of a given BBS site in a visit. After compiling records of a visit into a checklist in each site separately, a total of 2238 checklists were collected from each visit across the 204 BBS sites in Taiwan. To be comparable with BBS’s survey duration, I only included eBird checklists with a duration of between 36 to 60 minutes, with a total of 2164 eBird checklists retained. I performed a two-tailed Wilcoxon rank-sum test on both datasets to test the difference of observed species richness.
b) Species richness estimation methods
For the selected 14596 eBird checklists that fell within BBS sites, species richness estimation was based on each separate checklist (checklist-based). Three non-parametric approaches of species richness estimation methods were applied to the eBird dataset: (1) abundance-based estimator, Chao1 (Chao, 1984; Colwell & Coddington, 1994; Chao &
Chiu, 2014); (2) Incidence-based Coverage Estimator (ICE) (Chao & Chiu, 2014):
recommended by Chao and Chiu (2014), I set up 10 individuals as a cut-off point to define infrequent or frequent species group; (3) and first-order Jackknife, an estimator based on the number of singleton species (Burnham & Overton, 1978; Colwell & Coddington, 1994). Chao1 estimation was performed using the “iNEXT” package (Hsieh et al., 2016);
ICE and first-order Jackknife estimation methods were performed with the “vegan”
package (Oksanen et al., 2016) in the R platform.
c) Evaluating the performance of species richness estimation methods
To quantify the performance of the species richness estimation methods from the eBird dataset, I calculated the bias value based on estimated species richness from each eBird checklist against the compiled observed species richness from 2009–2017 in each BBS site separately (i.e., the asymptote of total species richness from accumulated annual surveys was assumed to be known as the total species richness in each BBS site, likely to represent the local bird community) (Walther & Morand, 1998; Walther & Martin, 2001;
Walther & Moore, 2005; Tingley et al., 2020). In other words, each eBird checklist produced one result value of bias (unless the eBird location was intersected with more than two BBS sites, then I treated the eBird checklists separately belonging to the shared BBS sites). The bias value was calculated by the following formula:
Bias = [𝑬𝒊𝒋#𝑨𝒊] [𝑨𝒊]
with j = eBird checklists in the i th BBS site (i.e., j th sample in each BBS site);
with i =1 to 204 (refers to the i th BBS site). Eij is the estimated species richness in each eBird checklist; Ai is the compiled observed species richness of the i th BBS site from 2009 to 2017. The bias calculation was performed in Microsoft Excel 2019. Finally, I used one-tailed Wilcoxon rank-sum test to examine the least biased species richness estimator among the three estimation methods by comparing each pair of estimators. The selected least biased species richness estimator was applied to the species richness estimation in order to access the two datasets comparison in the following questions.
d) Determining the effect of duration on bias after species richness estimation (1) Evaluating the effect of duration on observed species richness
Before taking the next step to examine the effect of duration on bias, I tested the effect of duration on observed species richness across all included 14596 eBird checklists.
I fitted four non-linear functions independently by using the least squares method (James et al., 2013). The four non-linear functions are used to estimate the asymptote of species richness as duration increase (Magurran & McGill, 2011), and formulas are depicted as follows:
(1) Gompertz function (Zeide, 1993)
𝑦 = 𝑎𝑒!"#!"#
(2) Power function (Flather, 1996)
𝑦 = 𝑎𝑥"
(3) Schumacher function (Schumacher, 1939) 𝑦 = 𝑎𝑒!"$ (4) Logistic function (Zeide, 1993)
𝑦 = 𝑎 1 + 𝑐𝑒!"$
where, y is the observed species richness, as the dependent variable, and x is the duration, as the independent variable; a, b, c denote the parameters to be estimated by the least squares method. This parameter estimation was calculated with the “stats” package (Team & Worldwide, 2002) in the R platform.
To compare the goodness-of-fit of the four different non-linear models, I compared the fitted curve with the BIC (Gideon, 1978). BIC was used instead of Akaike information criterion (AIC), since our objective was to explain the relationship between duration and observed species richness, instead of predicting the value (Shmueli, 2010).
Under the Bayesian probability framework, the probability of selecting the true model increases as the training sample size increases (Friedman et al., 2001; Magurran & McGill, 2011). BIC model selection was performed with the “AICcmodavg” package (Mazerolle
& Mazerolle, 2019) in the R platform. The best selected non-linear function was used to address the relationship between the duration and bias in the following process.
(2) Calculating the reduction of bias after species richness estimation
To make a comparison of the reduction of bias before and after estimating species richness at a standardized duration, for the same reasons as above, I removed all visits from the BBS dataset from 2009. With a total of 14596 eBird checklists, I treated duration in each eBird checklist as an independent variable; bias derived from observed and estimated species richness were treated as a dependent variable separately. Bias was calculated by the following formula:
Bias = [𝑶𝒊𝒋#𝑨𝒊] [𝑨𝒊]
with j = eBird checklists in the i th BBS site (i.e., j th sample in each BBS site);
with i =1 to 204 (refers to the i th BBS site). Oij is the observed species richness in each eBird checklist; Ai is the compiled observed species richness from the i th BBS site recorded from 2010 to 2017.
Bias = [𝑬𝒊𝒋#𝑨𝒊] [𝑨𝒊]
with j = eBird checklists in the i th BBS site (i.e., j th sample in each BBS site);
with i =1 to 204 (refers to the i th BBS site). Eij is the estimated species richness in each eBird checklist (note that the estimation was based on the least biased estimation method);
Ai is the compiled observed species richness from the i th BBS site recorded from 2010 to 2017.
To test the effect of duration on the bias across all included 14596 eBird checklists, I fitted both independent and dependent variables with the selected non-linear function described above by using the least squares method (James et al., 2013). Parameter estimation was calculated with “stats” package (Team & Worldwide, 2002) in the R platform. Finally, based on the non-linear function at a 60-minutes, the reduction value of bias can be measured with – the bias value after species richness estimation minus the bias value before species richness estimation.
(3) Evaluating improvement on proportion of species richness from eBird against BBS after species richness estimation
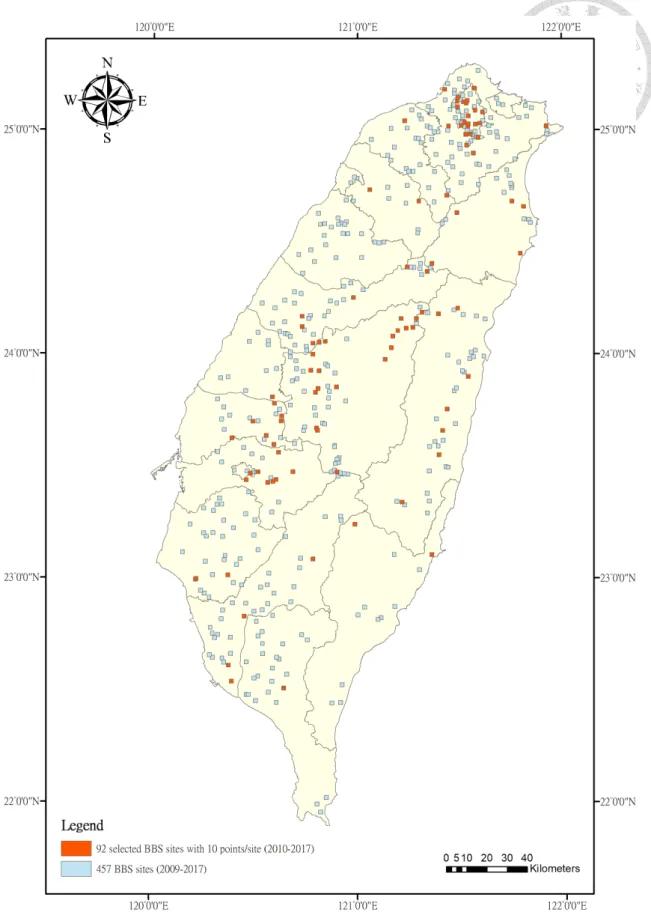
To evaluate the improvement of species richness after estimation from eBird dataset against BBS dataset at the duration of 60 minutes, I included BBS sites which only included 10 points (i.e., a total of 60 minutes in each visit was conducted from a BBS site), and removed all visits from 2009. I calculated the average observed species richness from each visit in each BBS site (i.e., the average number of species recorded in each visit of BBS). A total of 92 BBS sites were retained after selection (Figure 4), accompanied with a total of 6611 eBird checklists. I treated duration in each eBird checklist as an independent variable; bias derived from observed and estimated species richness were treated as a dependent variable separately. Bias was calculated by the following formula:
Bias = [𝑶𝒊𝒋#𝑨𝒊] [𝑨𝒊]
with j = eBird checklists in the i th BBS site (i.e., j th sample in each BBS site);
with i =1 to 92 (refers to the i th BBS site). Oij is the observed species richness in each eBird checklist; Ai is the average observed species richness from each visit in the i th BBS site recorded from 2010 to 2017.
Bias = [𝑬𝒊𝒋#𝑨𝒊] [𝑨𝒊]
with j = eBird checklists in the i th BBS site (i.e., j th sample in each BBS site);
with i =1 to 92 (refers to the i th BBS site). Eij is the estimated species richness in each eBird checklist (note that the estimation was based on the least biased estimation method);
Ai is the average observed species richness from each visit in the i th BBS site recorded from 2010 to 2017.
To test the effect of duration on the bias across all included 6611 eBird checklists, I fitted both independent and dependent variables with the selected non-linear function described above by using the least squares method (James et al., 2013). To test the performance of eBird dataset after species richness estimation, based on the non-linear function, 60-minutes was set to standardize the comparison of bias before and after species richness estimation. Finally, the improvement on proportion of species richness from eBird dataset after the estimation can be calculated through the bias formula.
Figure 4 Distribution of selected 92 BBS sites with criteria of 10 points/site from 2010 to 2017 across Taiwan from the original of 457 BBS sites
Results 1. Observed species richness
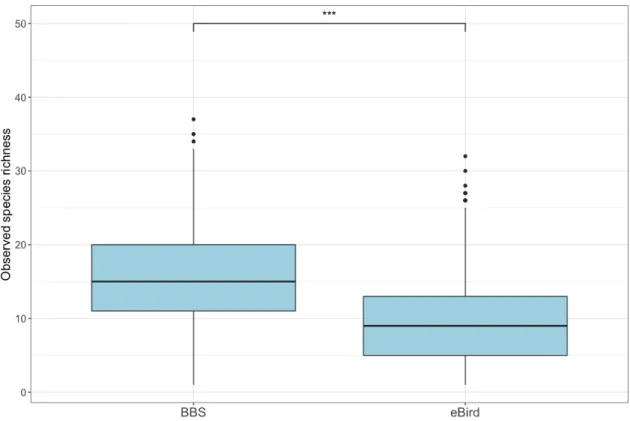
After restricting duration from both BBS and eBird datasets (36–60 minutes/checklist), the BBS dataset (204 sites) had a statistically higher observed species richness than the 2164 eBird checklists which were recorded within a 2×2 km square buffer based on centroid point from the BBS sites (W = 3826200, effect size = 0.503, p <
0.001) (Figure 5). The median per checklist of observed species richness for BBS (n = 2238) and eBird (n = 2164) datasets were 15 and 9 species, respectively. Inter-quartile range (IQR) for BBS (n = 2238) and eBird (n = 2164) datasets were 9 and 8, respectively (Figure 5).
Figure 5 Observed species richness per checklist recorded in BBS and eBird datasets.
BBS dataset included 2238 visit-based checklists, with a total of 204 sites. eBird dataset included 2164 checklists. Both datasets had durations restricted to the range of 36–60
2. The performance of species richness estimation methods
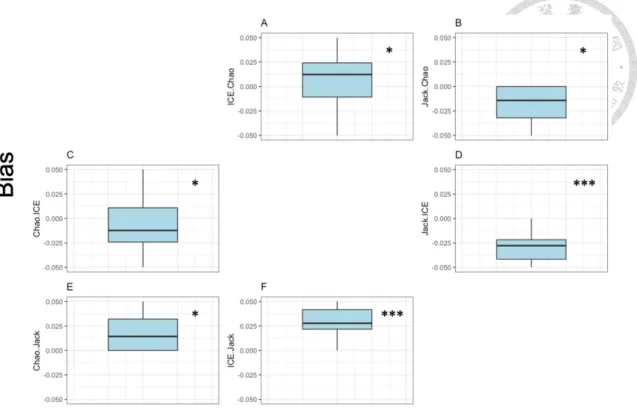
Chao1 estimator (median bias = -0.693) was overall least biased (W = 12369000, p < 0.05) compared with other two estimators (median bias of ICE = -0.730; median bias of Jackknife = -0.773) against compiled observed species richness from each BBS site (Table 1, Table 2 and Figure 6). ICE estimator was less biased than Jackknife (W = 119220000, p < 0.001) (Table 2). Estimates of species richness by eBird checklists varied by estimation methods, but generally underestimated the true community size (bias < 0) (n = 14596) (Table 1). However, the outcome of estimated species richness varied across estimation methods. Bias derived from the Chao1 estimator varied between -0.987 and 5.602, while bias derived from the Jackknife estimator has a generally smaller range, varied between -1.000 and 1.000 (Table 1).
Table 1 Performance of three species richness estimation methods for the eBird dataset against observed species richness from the BBS dataset, evaluated by the result value of bias summarized by all included checklists (n = 14596). Bias was calculated to make a comparison among estimators.
Mean SD Median IQR Minimum Maximum
Chao1 -0.576 0.393 -0.693 0.440 -0.987 5.602
ICE -0.640 0.286 -0.730 0.351 -0.983 1.222
Jackknife -0.689 0.267 -0.773 0.317 -1.000 1.000
Table 2 One-tailed Wilcoxon rank-sum test between species richness estimation methods
W–value p–value
Chao1 vs. ICE 123690000 < 0.05*
Chao1 vs. Jackknife 123690000 < 0.05*
ICE vs. Jackknife 119220000 < 0.001***
Figure 6 Performance of Chao1, ICE, and Jackknife estimators on species richness estimation methods. Bias was measured by comparing the result of each estimation method against compiled species richness from each BBS site. (A) The difference of Chao1 subtracted from ICE estimator; (B) The difference of Chao1 subtracted from Jackknife estimator; (C) The difference of ICE subtracted from Chao1 estimator; (D) The difference of ICE subtracted from Jackknife estimator; (E) The difference of Jackknife subtracted from Chao1 estimator; (F) The difference of Jackknife subtracted from ICE estimator. Asterisks in plots indicate the significance level between estimation methods by one-tailed Wilcoxon rank-sum test (p < 0.05 = *; p < 0.001 = ***). Note that the result value of bias only presents from -0.05 to 0.05.
3. Relationship between duration and observed species richness
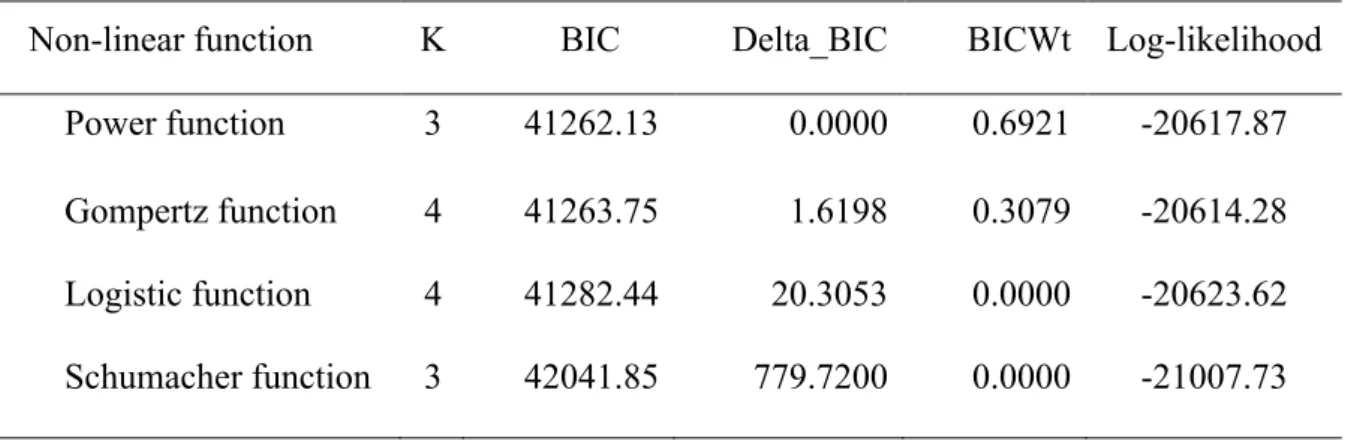
The power function was the best model to represent the relationship between duration and observed species richness, based on the BIC values (Table 3, Table 4 and Figure 7). As a result, the power function was selected to examine the effect of duration on bias in subsequent analyses.
Table 3 BIC model selection results from the relationship of duration and observed species richness
Non-linear function K BIC Delta_BIC BICWt Log-likelihood Power function 3 41262.13 0.0000 0.6921 -20617.87 Gompertz function 4 41263.75 1.6198 0.3079 -20614.28 Logistic function 4 41282.44 20.3053 0.0000 -20623.62 Schumacher function 3 42041.85 779.7200 0.0000 -21007.73
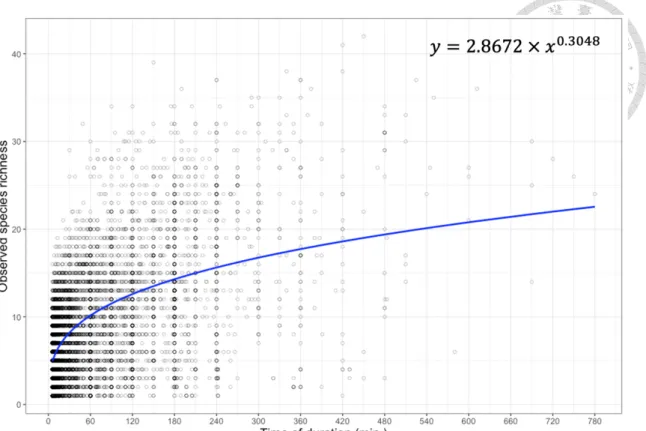
Table 4 Parameter estimates from the power function by least squares method on the relationship of duration and observed species richness
Parameter Estimate Standard Error t–value p–value
a 2.867213 0.059096 48.52 <0.001***
b 0.304814 0.004471 68.17 <0.001***
*Note: the power function formula is depicted above with parameters (a and b) to be estimated. Residual standard error: 5.606 on 14594 degrees of freedom
Figure 7 The relationship of duration and observed species richness from eBird checklists (n = 14596). Power function (top right of the figure) was used to fit the relationship of duration and observed species richness by a least squares approach.
4. Bias reduction after species richness estimation
Underestimation is represented by negative bias (bias < 0), while overestimation is represented by positive bias (bias > 0). In general, as survey duration increased, both observed and estimated species richness of eBird checklists were closer to the observed species richness of BBS sites (Figure 8 and Figure 9). A non-linear power function explained the effect of duration on the bias of species richness of eBird checklists, comparing with BBS checklists (Table 5 and Table 6). Based on the power function at 60-minutes, bias was closer to zero (from -0.61 to -0.50) after species richness being estimated by the Chao1 estimator in eBird dataset; that is, species richness from eBird dataset was overall closer to BBS dataset after the Chao1 species richness estimation (Figure 8 and Figure 9). In addition, bias was significantly closer to zero after the Chao1 species richness estimation (V = 61101000, p < 0.05).
When comparing observed species richness in the eBird and BBS datasets, according to the power function by least squares approach, at 60-minutes the eBird dataset had a bias of -0.61 (Figure 8), which indicated the eBird dataset recorded an average of 39% of the BBS species richness at 60-minutes. The eBird dataset failed to record the same number of observed species at the duration of between 6 to 780 minutes based on power function (bias = 0) (Figure 8).
When comparing the Chao1 species richness estimated from the eBird dataset to observed species richness in the BBS dataset, according to the power function, at 60- minutes the eBird dataset had a bias of -0.50 (Figure 9), which indicated that the eBird dataset recorded an average of 50% of the BBS species richness after the Chao1 species richness estimation. According to the power function, eBird checklists would need a
(Figure 9). The longest duration (780 minutes) among all eBird checklists (n = 14596), had a bias of -0.14 (Figure 9).
Table 5 Parameter estimates from the power function by least squares method on the relationship of duration and bias (observed species richness of eBird vs. observed species richness of BBS)
Parameter Estimate Standard Error t–value p–value
a 0.099773 0.002515 39.67 <0.001***
b 0.330131 0.005414 60.98 <0.001***
*Note: the power function is depicted above with parameters (a and b) to be estimated.
Residual standard error: 0.2595 on 14594 degrees of freedom
Figure 8 The relationship of duration on eBird checklists and bias (observed species richness of eBird vs. observed species richness of BBS) across 204 BBS sites. The power function (top-right in the figure) was used to fit the relationship of bias and duration by a least squares approach. Bias was calculated with observed species richness from both eBird and BBS datasets. A total of 14596 eBird checklists were included in the analyses.
Note that bias calculation of observed species richness in BBS was computed by compiling observed species richness from 2009–2017 across each 204 BBS site
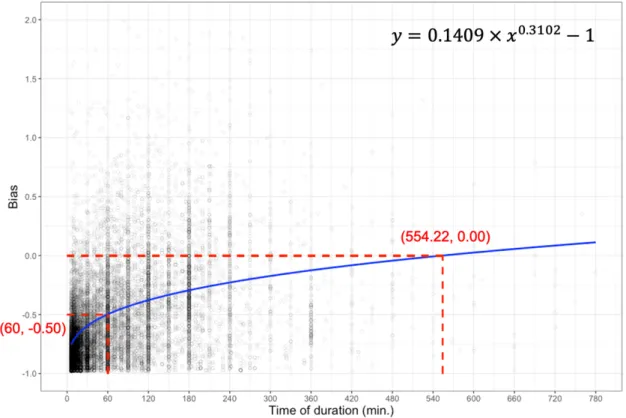
Table 6 Parameter estimates from the power function by least squares method on the relationship of duration and bias (estimated species richness of eBird vs. observed species richness of BBS)
Parameter Estimate Standard Error t–value p–value
a 0.140924 0.004192 33.62 <0.001***
b 0.310248 0.006439 48.18 <0.001***
*Note: the power function is depicted above with parameters (a and b) to be estimated.
Residual standard error: 0.4049 on 14594 degrees of freedom
Figure 9 The relationship of duration on eBird checklists and bias (estimated species richness of eBird vs. observed species richness of BBS) across 204 BBS sites. The power function (top-right in the figure) was used to fit the relationship of bias and duration by a least squares approach. Bias was calculated with estimated species richness from eBird dataset and observed species richness from BBS dataset. A total of 14596 eBird checklists were included in the analyses. Note that bias calculation of observed species richness in BBS was computed by compiling observed species richness from 2009–2017 across each 204 BBS site separately. Since the minimum result value of bias is -1, I added -1 in order to scale the formula.
5. Improvement of proportion of species richness against BBS dataset after the Chao1 species richness estimation
Again, a non-linear power function explained the effect of duration from eBird checklists on bias (Table 7 and Table 8). In general, as survey duration increased, the observed and estimated species richness of eBird checklists were closer to the average observed species richness of BBS sites (Figure 10 and Figure 11). Based on power function at 60-minutes, bias was closer to zero (from -0.34 to -0.14) after species richness being estimated by the Chao1 estimator in eBird dataset, indicating eBird dataset can record the same number of species richness from the BBS dataset raised from 66% to 86% (i.e., species richness from eBird dataset was closer to the average observed species richness from BBS dataset after the Chao1 species richness estimation) (Figure 10 and Figure 11). At 60-minutes, compared to the number of checklists reported a bias >1 before species richness estimation (n = 4), nearly three times (3.25) of eBird checklists were reported a bias >1 after the Chao1 species richness estimation (n = 13) – that is, more than twice as many eBird as BBS species richness were reported when bias >1 (overestimation) (Figure 10 and Figure 11).
When comparing observed species richness of the eBird and BBS datasets, according to the power function by least squares approach, at 60-minutes the eBird dataset had a bias of -0.34 (Figure 10). the eBird dataset recorded an average of 66% of the BBS species richness at 60-minutes. According to the power function, eBird checklists would need a duration of 221.89 minutes to reach 0 bias value (Figure 10).
When comparing the Chao1 species richness estimated from the eBird dataset to average observed species richness in the BBS dataset, according to the power function,
species after the Chao1 species richness estimation. Although the Chao1 estimator could improve the record observed species, eBird dataset was still failed to reach the same number of species richness against the BBS dataset at the 60-minutes even the Chao1 estimator was applied. According to the power function, eBird checklists would need a duration of 96.42 minutes to reach 0 bias value after the Chao1 species richness estimation (Figure 11).
Table 7 Parameter estimates from the power function by least squares method on the relationship of duration and bias (observed species richness of eBird vs. average observed species richness of BBS)
Parameter Estimate Standard Error t–value p–value
a 0.177926 0.005805 30.65 <0.001***
b 0.319615 0.007070 45.21 <0.001***
*Note: the power function is depicted above with parameters (a and b) to be estimated.
Residual standard error: 0.4077 on 6609 degrees of freedom
Figure 10 The relationship of duration on eBird checklists and bias (observed species richness of eBird vs. average observed species richness of BBS) across 92 BBS sites. The power function (top-right in the figure) was used to fit the relationship of bias and duration by a least squares approach. Bias was calculated with observed species richness from both eBird and BBS datasets. A total of 6611 eBird checklists were included in the analyses. Note that bias calculation of observed species richness in BBS dataset was computed by averaging compiled observed species richness from visits in 2010–2017 across each 92 BBS site separately. Since the minimum result value of bias is -1, I added
Table 8 Parameter estimates from the power function by least squares method on the relationship of duration and bias (estimated species richness of eBird vs. average observed species richness of BBS)
Parameter Estimate Standard Error t–value p–value
a 0.247240 0.009437 26.20 <0.001***
b 0.305866 0.008325 36.74 <0.001***
*Note: the power function is depicted above with parameters (a and b) to be estimated.
Residual standard error: 0.634 on 6609 degrees of freedom
Figure 11 The relationship of duration on eBird checklists and bias (estimated species richness of eBird vs. average observed species richness of BBS) across 92 BBS sites. The power function (top-right in the figure) was used to fit the relationship of bias and duration by a least squares approach. Bias was calculated with estimated species richness from eBird dataset and the average observed species richness from BBS dataset. A total of 6611 eBird checklists were included in the analyses. Note that bias calculation of observed species richness in BBS dataset was computed by averaging compiled observed species richness from visits in 2010–2017 across each 92 BBS site separately. Since the minimum result value of bias is -1, I added -1 in order to scale the formula.