國立臺灣大學工學院土木工程學系 碩士論文
Department of Civil Engineering College of Engineering National Taiwan University
Master Thesis
Analysis of the Demand-side Characteristics of Mumbai Dabbawala Service
貝席門 Himanshu Patel
指導教授:許聿廷 博士 Advisor: Yu-Ting Hsu, Ph.D.
中華民國 107 年 7 月
July, 2018
中文摘要
食品配送服務供應商在供給及需求方面始终存在著不對稱性,進而產生運輸 服務效率低下的問題。 因此,為了解決這個問題,本研究以世界知名且受六西格 瑪之商業標準認證的印度「孟買達巴瓦拉」供應商為例子,從「孟買達巴瓦拉」
的需求方特徵進行分析,從而為其營運策略的維續、更廣泛的市場拓展以及更佳 的運輸網絡規劃提供創新的規劃策略。 這項工作利用邏輯迴歸的預測模型來分析 調查數據,模型的數據分析結果提供「孟買達巴瓦拉」食物供應商各種的可能發 展策略,例如藉由網路服務和行動裝置進行需求預測,以及與餐館的横向整合,
在供給以及需求方面皆提供更高的食物配送效率。
關鍵詞:孟買達巴瓦拉,交通模型,需求特徵,需求預測,食物配送
ABSTRACT
There has always been an asymmetry in the supply and demand side of food delivery service providers leading to an inefficient transportation problem. Therefore, to address this issue, the present work considers the case of world-renowned six sigma certified "Mumbai Dabbawala" of India. Accordingly, this work proposes to study the demand side characteristics of Mumbai Dabbawala, thereby offering innovative strategies for their sustenance, better market outreach, and transport network planning.
This work utilizes the logistic regression based predicting model to analyze the survey data. Analytical results emerging out of the proposed model-based data analysis suggests various developmental strategies for Mumbai Dabbawala, such as demand forecasting through web services and mobile application, and horizontal integration with the restaurants to increase the supply and demand effectiveness.
Keywords: Mumbai dabbawala, transportation model, demand-side characteristics, demand forecasting, food delivery
CONTENTS
口試委員審定書 ...i
中文摘要 ... ii
ABSTRACT ... iii
CONTENTS ...iv
LIST OF FIGURES ...vi
LIST OF TABLES ... viii
CHAPTER 1. INTRODUCTION ... 1
1.1. Background ... 1
1.2. Research Objective and Motivation ... 2
1.3. Organization ... 4
CHAPTER 2. LITERATURE REVIEW ... 6
2.1. Introduction of Dabbawala ... 7
2.2. Demand of Dabbawala- ... 12
2.3. Dabbawala Operation and Business Model ... 13
2.4. Summary of Literature Review:... 16
CHAPTER 3. PROBLEM STATEMENT AND DATA ANALYSIS ... 17
3.1. Problem Statement ... 17
3.2. Data Collection ... 17
3.2.1. Design Survey ... 18
3.2.2. Survey Process ... 18
3.3. Data Description ... 19
CHAPTER 4. METHODOLOGY ... 35
4.1. Multinomial Logit Model ... 35
4.2. Descriptive Statistics ... 40
4.3. Model Development... 44
4.4. Result Discussion ... 48
CHAPTER 5. CONCLUSIONS ... 51
5.1. Research Summary ... 51
5.2. Research Limitation and Future Work ... 53
REFERENCES ... 54
APPENDIX ... 57
Codes Used for Model Estimation: ... 57
Questionnaire Design: ... 57
LIST OF FIGURES
Figure 1.1 Thesis organization ... 5
Figure 2.1: Dabbawala delivering lunch boxes during rain... 8
Figure 2.2: Operation of Mumbai Dabbawala ... 14
Figure 2.3: Unique coding system used in a lunch box for dabbawala service. ... 15
Figure 3.1: Data collection procedure ... 19
Figure 3.2: Age description according to their primary choice for the lunch ... 21
Figure 3.3: Outside food in a week for age less than 25 years ... 24
Figure 3.4: Outside food in a week for age between 25-40 years ... 25
Figure 3.5: Outside food in a week for age more than 40 years ... 25
Figure 3.6: Age wise distribution of respondents ... 26
Figure 3.7: Monthly expenditure for those who bring lunch from home. (for 1st utility function) ... 27
Figure 3.8: Monthly expenditure for those who use to go to a restaurant or canteen. (for 2nd utility function) ... 27
Figure 3.9: Monthly expenditure for those who go home for lunch (for 3rd utility function) ... 28
Figure 3.10: Monthly expenditure for those who choose dabbawala service (for 4th utility function) ... 29
Figure 3.11: Monthly expenditure for family members or friends bring food from home (for 5th utility function) ... 29
Figure 3.12: Motorbike users for different choices ... 30
Figure 3.13: Distribution of daily commute trip for different categories ... 31
Figure 3.14: Occupation as fieldwork for different choices ... 32
Figure 3.15: Representation of dabbawala users in different variables in percentage .... 33 Figure 3.16: Representation of family members or friends bring food for me from home
in different variables in percentage ... 34
LIST OF TABLES
Table 3.1: Baseline characteristics of respondent data ... 20
Table 3.2: Main concern while choosing for food delivery services ... 20
Table 3.3: Eating Habit in India ... 21
Table 3.4: Food preferences during lunch time ... 22
Table 3.5: For dabbawala users ... 23
Table 3.6: Family members/friends bring lunch from home ... 23
Table 3.7: Those who go to some restaurant or canteen ... 23
Table 3.8: Those who go home for lunch ... 23
Table 3.9: Those who bring from my home ... 24
Table 3.10: Different categories for motorbike users ... 30
Table 3.11: Different categories for daily commute trip up to 30 minutes ... 31
Table 3.12: Representation of field work for different categories ... 32
Table 3.13: Representation of variables used for dabbawala users ... 33
Table 3.14: Representation of variables used for family members or friends bring lunch from home ... 34
Table 4.1: For data description and its meaning which is used in our model ... 38
Table 4.2: Descriptive analysis for total respondent ... 40
Table 4.3: For first utility function ... 44
Table 4.4: For second utility function ... 44
Table 4.5: For third utility function ... 45
Table 4.6: For fourth utility function ... 46
Table 4.7: For fifth utility function ... 47
CHAPTER 1. INTRODUCTION
1.1. Background
India, officially known as the Republic of India is a country located in South of Asia. By geographical area, it is the seventh-largest country in the world and the second-most populous country (with over 1.2 billion people) after China. Although, India is very young as a nation but its cultural diversity stand-out among other countries in Asia.
Presently, there are 46 metropolitan cities in India like Mumbai, New Delhi, Bengaluru, Chennai, Hyderabad, Pune and many more. Metropolitan city means their population is one million peoples or more. The metropolitan city like Mumbai has a different facing problem like a high rate of growing population. As you know, Mumbai is a most populated city in India, the current population of Mumbai is around 22 million fourth largest city in the world regarding population, because of the enormous population present in the city, the transportation system is not able to provide smooth ride especially during peak hours (D Baindur at el., 2013). Therefore, most of the everyday people use rail transportation system to reach their destination on time, and passengers overcrowd this rail. So the person avoids taking big luggage with them like a big trolley, lunch box, etc. To prevent the problem of taking lunch box in the morning time, they can go for the dabbawala food delivery service. It helps to reduce their luggage, and family members have enough time to prepare their food at home.
For an office worker, they need to wake up early in the morning and need to reach office in time around 9.00 a.m. During this time, the traffic of Mumbai city is at its peak;
therefore the workers have to take Mumbai local trains (rail transportation system available in Mumbai) to reach their office. They use public transportation during peak
hour, and it is very difficult to take their lunch box with them those who don’t have much time to go restaurant or canteen during working hour. They preferred to use food delivery services like dabbawala, but this service is available only for lunchtime. It is the oldest food delivery service that exists in Mumbai. This service began in the late 1880s during British India. Dabbawala service is well known for excellence in service and reliability.
Nowadays, Mumbai city has some more food delivery service providers such as Foodpanda, Zomato, Grab, etc. but service offered by the latter is not for homemade food but restaurant based delivery services.
In this research, work is done on the demand side characteristics of Mumbai dabbawala. A detailed study about dabbawala starts the procedure of this research and survey to know the people's preferences about the food delivery services under various parameters, which helps in research to know “what are important factors which affect the demand of dabbawala” and compare their service to other third party services. The method which is adapt to conduct the survey is about online and in Google forms, and target respondents are from Mumbai, the model used in the research is the multinomial logit model in limdep software.
1.2. Research Objective and Motivation
Some research has done in demand forecasting by using a different model like empirical analysis will play an important role in to understand the demand and the data which they have suitable for empirical analysis. Demand projection for dabbawala service.
The research objective is focusing on the analysis of the demand side characteristics of Mumbai dabbawala. Usually, the multinomial logit model deals with multiple independent variables to predict the outcomes of the model. Similarly, my project
involves binary data types, ordered and unordered discrete choices for forecasting the future and current demands of dabbawala services under specific parameters.
Research question
1. What is the local people’s perception about food delivery service?
2. Can the dabbawala service model fulfill this demand?
3. How people obtain their lunch?
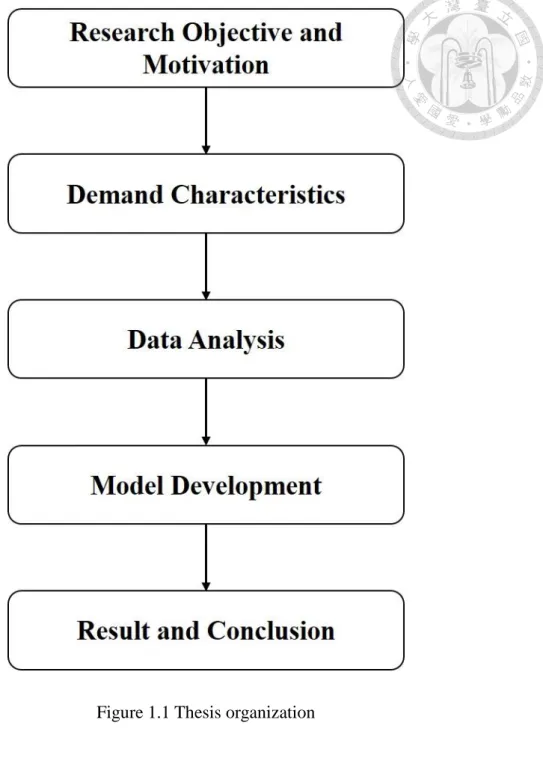
1.3. Organization
Chapter 1 is the introduction of the thesis, including the background, problem statement, research objective, and motivation of this research. Introduction of India, Some basic information on the culture of India, food culture of India. Chapter 2 is about the literature review. It includes the introduction of dabbawala, a feature of dabbawala, the secret behind their success, what we can learn from dabbawala, operations and demand for dabbawala and the summary of the literature review. In Chapter 3, the methodology which consists of study in detail, data collection and data description is described.
Which further includes the procedure of data collection and survey design and survey questionnaire. Chapter 4 is about methodology procedure for opting the model which includes demand-side analysis, multinomial logit model, model development and result, analysis of results and discussion. Chapter 5 is a final part of the thesis which includes research finding and suggestions for the conclusion which also contain future work and limitation of research.
Figure 1.1 Thesis organization
CHAPTER 2. LITERATURE REVIEW
India is home to the largest number of the different religion of the world. Thus, India is diverse within its roots with different culture and tradition. In large parts of India, various religious and ethnic group lives together which makes India unique. Besides, India is also home to the world’s most significant number of spoken language, over 780 languages.
[https://en.wikipedia.org/wiki/Languages_of_India], exist since the beginning of its ancient age. However, officially, India recognizes 22 languages, and among them, Hindi and English are spoken widely in the large parts of India. Usually, people live in this city their life is busy, and sometimes they are feeling restless because of their workload, colossal population, traffic jams, more waiting time, etc. are the reason for the tiredness.
Due to the huge population, the traffic jam is common in the city; people use to travel by various modes like railway, highway, waterway. Presently the available modes choice of transportation in Mumbai for civilians is railways, highways, and waterways.
Railways- passenger train, express train, monorail. Highways- public buses, private taxi, shared cab, online cab service, auto-rickshaws, motorbike, bicycle. Waterways- ferry, cruise, small boats.
Indian food is full of varieties and in the different region has different types of foods like north Indian food, south Indian food, central India food, northeastern Indian food.
This food has different types of spices also as known as masalas which gives flavor the cuisines (Uma Narayan, 2010). Basically, peoples use to eat three to four times a day.
Their day starts with breakfast than during the afternoon they take their lunch and in the evening usually, they take their last meal which we call dinner. Time discrimination for consuming food are between 8.00 am – 10.00 am they make their breakfast- it is a light meal people use to take before going outside for work. Between 12.30 pm – 2.00 pm they
take their lunch- it is a full meal which includes many types of vegetables, rice, chapatti, salad with some dessert. Between 7.00 pm – 10.00 pm they have another full meal which they called dinner that includes similar stuff like lunch. Some peoples use to take tea or coffee with snacks between lunch and dinner means around 4.00 pm – 6.00 pm.
2.1. Introduction of Dabbawala
The ‘Dabbawala’ is a food delivery service provider in Mumbai, India. It is operated by the Mumbai Tiffin Box Suppliers Association (MTBSA). (Nishesh Patel et al.,2006;
Payal B. Wasnik et al.,2018) It was started during 1890 by Mahadeo Havaji Bachche with hundred other peoples. During the early days of Dabbawala, mostly the customers were of British and Parsee business person or high-ranked officers (Ganapathy et al.,2016). They don’t like local food, therefore, started this delivery services. They make their food in their home and delivers to the office before lunchtime by using dabbawala service. From here the dabbawala service began to delivery all office worker, businessman, and school going students.
Mostly the dabbawala comes from villages around Pune district (another city near Mumbai), and they belong to the Varkari community, they pray to “God Ganesh”, (Arun Raste, 2016) which teaches them to service comes first and serving duty for the customer is like a serving food for god. Therefore, they deliver the lunch boxes in time than they eat the lunch then they start collecting the lunch boxes form office to provide back to home. They are very efficient in their work, and After an article on them published in the Harvard business review, they are globally popular around the world (Percot, Marie, 2005).
The Mumbai Dabbawalas is a lifeline for some people those who work more than
eight hours daily and completely dependent upon public transportation system because in Mumbai during morning peak hour time, everyone is in a hurry to reach their office in time, and every mode of the transportation system are full of rush. Roads are full of vehicles and cause a traffic jam. Only local trains can reach in time or with minor delays, but it is challenging to get it. Moreover, it is almost impossible to get in with your luggage like a lunch box, suitcase, etc.. Therefore, the dabbawala service plays a significant role to get their lunch box in time and with help to provide warm and homemade food without any exertion.
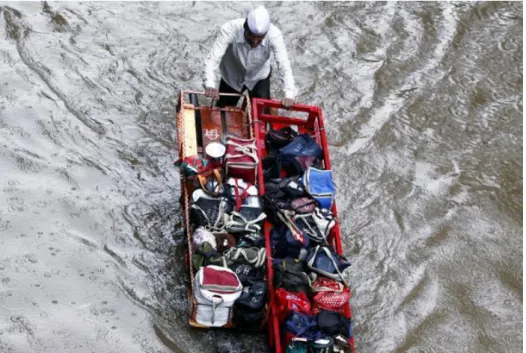
Many people say that in the heavy rain, a local train of Mumbai can stop but dabbawalas will never end. (Thomke, Stefan H., and Mona Sinha, 2010) Their service is available for all working days. Their average literacy rate is eighth grade standards, but their error rate is one in sixteen million without using any technologies and they achieve six-sigma certification for excellence in service (Gupta, Atul.,2007; G.S. Pathak, 2010).
The below figure is representing the operations of dabbawala during uneven weather condition.
Figure 2.1: Dabbawala delivering lunch boxes during rain.
They have a well-defined hierarchy, but that doesn’t mean regular boss-employee model. Here every leader is an employee, and every employee is a leader. They ultimately believe that every brick is responsible for keeping the building secure. But senior people are given the roles of team captains, and they are also team players.
(
Stefan Thomke, 2012).
Their motto is customers is not a king but empire. They do not ever take a tip from customers and give value-added services like bring their forgettable things like glasses or some important documents their monthly charges for their service is between 500 to 1200 Indian rupees it depends upon the distance between your office to home. They do 0.4 million transactions every day in a highly crowded city like Mumbai. (Roncaglia, Sara, 2013).It is the best example for the supply chain management system, and they do this transaction without any single error.
Workers with more experience act as team leaders. They teach the newcomers about the operational process and the organizational process. If any dispute arises between them, they could handle it smoothly. Usually, they don't blame anyone for not doing their work properly
(
Stefan Thomke, 2012).
Everyone is from the local community. They could communicate with them in a different language through Hindi and Marathi, they have the same color, the same level of education and in most cases they are relatives / friends / classmates. (Percot, Marie, 2005).
So they have an excellent understanding of each other which makes the excellent environment for work, and they help their colleagues during a difficult time. This Synergy which is very difficult to be established in a Corporate firm that is the best part of the Dabbawala. They learn, adjust, coordinate, give feedback, get inputs / suggestions / guidance from the senior persons and do the work. This wow ways-of-working makes
things much more straightforward.
Many global institutes studies and research has done on Dabbawalas like Harvard’s Business School and Indian Institute of management. We do not need technology to be efficient. Definitely, technology is an essential tool but sometimes we do not control technology even technology controls us. A good team is a great asset to see their teamwork and management system prince Charles of England and Richard Branson founder of Virgin group inspired by Dabbawalas and came to see their services.
Learn from Dabbawalas –1. Time management- the dabbawala time management is excellent in their class Until we can manage time; we can accomplish nothing. 2.
Discipline- They need to maintain discipline for both sides for employees and customers therefore they note all the delays day by day. If delays are too much they don’t give their service to them. 3. One-point focus- They make a plan for their trips and focus is highly concentrated on work and productivity of labor because they follow the rules and their focus is only on their work. 4. Stay true to your purpose- If you are not perfect at your post. So you need to passionate about your profession and give value to your profession. 5. Love your job- They focus on one goal or one-point focus. Therefore, today they have six-sigma certification with one error in eighty days of the transaction (Gupta, Atul.,2007). 6. Teamwork- To understand the coding system of dabbawalas is which helps in operation by transferring one person to another and codes helps to know a perfect place like origin area, origin station, destination area and destination station.
A feature of the Dabbawalas- Flat organization structure; because their organizational structure is small and they quickly move in the organization to reach out to common peoples. It also helps them in making marketing and connection with peoples because they distribute their work and separate it into a small group of six to twelve peoples. Community orientation- they belong to the same community and they
are very punctual they start to do their job before sunrise. Social values- they love to do their jobs, and they respect their positions. Unique coding system- they used a coding system to give unique identification for their lunch box. Service excellence- they achieve six sigma certification for their excellent services, their committed mistake rate is very low. They make approximately one mistake in 16 million transactions which means they make one mistake in eighty days of delivery without using any technologies
.
Dabbawala proves that by working in a disciplined manner and consistent in performance will help them to gives an extraordinary achievement.
(
Stefan Thomke, 2012).
The secret behind success- Decentralization- it means the big group of peoples is distributed their work into small groups. Low operation cost- they choose rail transportation system for delivery which is the cheapest way of transportation in Mumbai. Further which makes them cost efficient. Low attrition rate- it means in their operations the obstruction is very less because the employees are working for a long time in the organization. Minimum capital investment- they do not need to invest a lump sum money for the service because majorly they use public transportation for operation. No overdependence on technology - they do not depend upon any modern technology like a smartphone, because they phone distract their focus. Faster decisions making- they do have an alternate plan to execute during an emergency situation.
Customer Satisfaction - their main aim is to satisfy the customer, so they deliver the lunch box in time which makes them reliable. They eliminate the bottleneck in the system. It is very rare, non-imitable, non-substitutable and a valuable one. They keep the organization in simple and easy to understand. Some multinational companies like PepsiCo tried to adopt service model and they do sometime sample delivery service.
2.2. Demand of Dabbawala-
Some research has been done to analyze the demand characteristics and feasibility of Mumbai dabbawala (Ganapathy et al., 2016) in this paper they used an empirical model to analyze the demand and their proposal for model of dabbawala food delivery system in Bangalore (Bengaluru) another metropolitan city in India. In recent years, the growth rate and demand of dabbawala are settled down (Chakraborty et al., 2015). To analyze the demand side characteristic of Mumbai dabbawala, in this research a multinomial logit model (MNL) is used as a predicting model.
Many new food delivery service providers came to India in the early 2010s. Their target customer is those who work at late nights. So they provide that their services for 24*7 and usually, (Isher et al., 2005). the rate of traffic flow will be smooth at midnight, so it is easy to deliver the food in time
.
Nowadays, the new companies like Zomato, Swiggy, Uber eat, Foodpanda, Grab, etc. provides food delivery services in Mumbai with their aim to provide restaurant food to deliver in the office or home. This service is for those who don’t want to cook food in their home.The food culture in India is changing because of the westernization of cities and busy city lifestyle. Peoples don’t have much time to spend on their lunch or dinner. Nowadays peoples use to choose fast food or street food which doesn’t take much to prepare it. But it is challenging to eat daily because sometimes, it is not healthy and unhygienic.
Due to modernization and westernization of cities like Mumbai, peoples like to use new technology-based services, and this company influenced the peoples by providing some discount coupon codes which help them to do marketing. They offer their service for 24*7 in a year which allows them to the make new customers whose who like to eat at late night. In recent days, the number of new food delivery service. But the company
arises to provide restaurant based food delivery service in the online market and the special feature of their service is for twenty-four hours. They tie up with many restaurants which include Indian, Continental, Italian, cuisine which provide different types of foods. In India, the German-based company was named ‘Foodpanda’ achieve a five hundred eighty percentage growth rate in revenue as compared to the last financial year 2016 in India. The reasons behind their success they work on their implemented promotional Which means peoples may have influenced by their model and they give some promotional offer in the festival seasons which helps them for marketing. The young generation of peoples like to explore new services, and their inclination is towards technology-based services.
2.3. Dabbawala Operation and Business Model
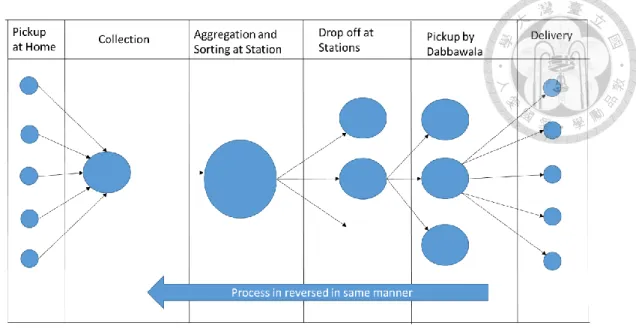
The dabbawala operations started in the 1880s by Mahadeo Havji Bacche, and his first customer was parse banker employee, Bacche goes to his home in grant road, Mumbai to collect his lunch box and delivered to office in Ballard Pier. During this period, India was colonized by the British empire. Parsee family began cooking food as a business like a canteen they want to deliver their food to office employee to increase their business but she unable to deliver their food. So one day she asks to deliver their 20 to 25 lunch box from Goregaon to VT railway station (Victoria terminals station). Bacchae agreed to deliver her boxes, and he recruits his friends and relatives. But during his time lunch boxes are very few they don’t need more person to deliver their lunch box. When the system is grown day by day, and the business model both have earned profits, and Bacche brings more peoples to delivers the lunch box. The below is represent a delivery system of lunch box from dabbawala (Ganapathy et al., 2016).
Figure 2.2: Operation of Mumbai Dabbawala
The primary focus area of dabbawala is transportation. It can technically called as logistics. They transfer goods from one place to another and at the right time with a high degree of accuracy. They don’t have a business model of their own, but they do have a proper practice, general ideas, and well-executed mechanism. They know only one thing:
on-time delivery. To achieve this, they follow the four basic pillars with complete synergy – organization, management, process, and culture.
The dabbawala gets the Lunch boxes from every individual house and assemble at a place and segregate everything according to the codes written in every box. Then the lunch box is transported using the local train to a place near to the destination where it is segregated again and carried to the respective office using a small bicycle. The dabbawala service for food delivery is to bring your lunch box from home and canteen. This service is only available at lunchtime of all working days. They are using public transportation, to reduce their cost and reach in time to deliver their lunch box.
Presently, there are a couple of companies operating for food delivery service in Mumbai, India. However, they largely differ in their service and business model. The Dabbawala, specifically, serves home-cooked food unlike Swiggy, Zomato, UberEat who
serves food from restaurants. This service-operators have tied-up with some city-based restaurant who provides them food and share some percentage of their profits as per the demand.
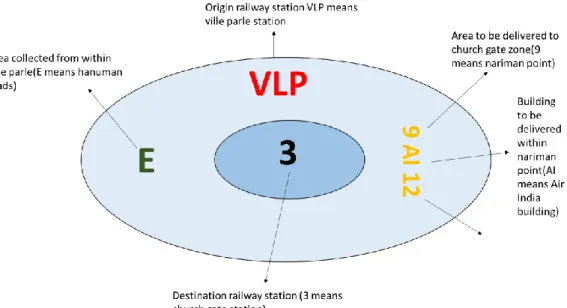
They use a hub and spoke method for collection and distribution of lunch box. First, they pick up all the lunch box from home and collect in one place and send to the main junction (origin railway station) aggregation and sorting in the station and transfer to their final destination. (Natarajan Balakrishnan and Chung-Piaw Teo,2004). Similarly, they do the same thing to get back the lunch box. To delivers lunch boxes in time to the right person without doing any error they use a coding system to identify and which help them to deliver the box in the right place (Uma Krishnan, 2015). This code gives every lunch box unique identification which allows them for segregation.
Figure 2.3: Unique coding system used in a lunch box for dabbawala service.
2.4. Summary of Literature Review:
The “Dabbawala” service was started at 1890 during British India from local unskilled peoples. Mostly they bring food from home. They provide their services during lunch time only. (Ganapathy et al.,2016). To use this service contact them directly or through native customers or call them directly through the phone. They don’t use modern technologies like mobile phones. They don’t use a motorbike or other fuel consuming vehicles. (A Sharda et al.,2012; D Baindur et al., 2013). Mainly they use rail transportation system of Mumbai popularly called local trains of Mumbai, public buses, and bicycles. Sometimes they deliver lunch box by using a cart or by walking.
In the recent few years back the demand of Mumbai dabbawala is reduced by the analysis of some research. They found that in the 8-10 years the number customer serves by one dabbawala is 50 in a day, which is now reduced to 20. (Chakraborty et al., 2015) indicate that the customers of dabbawala existing customer of dabbawala can switch to another service. The dabbawala needs to introduce some technology-based service that may affect the demand of dabbawala.
CHAPTER 3. PROBLEM STATEMENT AND DATA ANALYSIS
3.1. Problem Statement
In this research, to analyze the demand side characteristics of Mumbai dabbawala which helps them for improving their service and operation. By conducting the survey, we know the people's preferences about the food delivery services. New companies provide flexibility to the customer by offering their service for twenty-four hours in a day which helps them to get popularity in the competitive market. Because this is a technology-based service, they have a mobile phone application and website. People who use this application make an order for their lunch and dinner to avoid cooking in their home, that means the customer of dabbawala can switch to this mobile-based online services.
In this research, a detailed study about dabbawala has been done by finding the previous research paper and analysis for predicting the demand, so we need to use the predicting model, i.e. multinomial logit model to analyze the demand of dabbawala service. For the analysis of demand-side characteristics where an online survey has been conducted using the questionnaire method to know the people’s preferences for a food delivery system in Mumbai.
3.2. Data Collection
After reading the related paper, we proceed for the data collection, a survey has been conducted to use our questionnaire which helps us in finding the appropriate answer to
of demand of dabbawala. A total of 501 respondents took part in this survey. Whereas 172 are female and 329 are male. The average age of our respondents is 39-year-old.
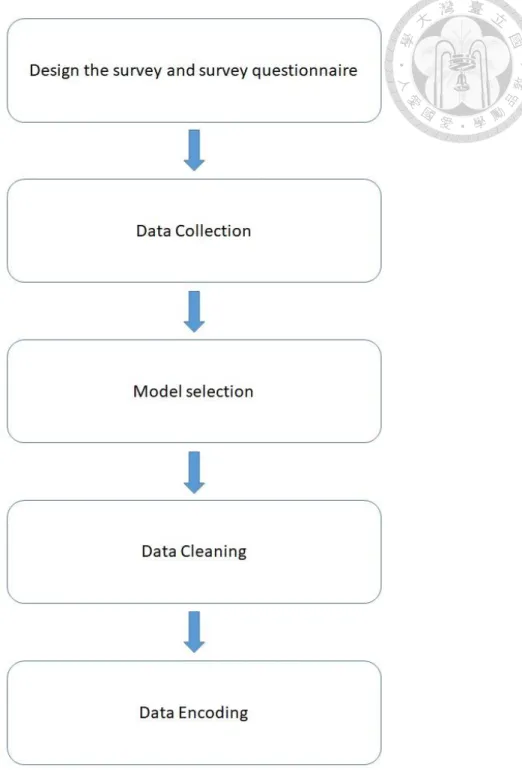
The procedure of data collection are as follows- (i) Conduct a survey. (ii) Choose the type of survey. (iii) Design questionnaire based on previous research. (iv) Target respondent- those who aware of the service and might be the user.
3.2.1. Design Survey
To know the people's preference for food delivery services, we designed a survey. This survey aims to analyze the demand side characteristics of Mumbai dabbawala. In this online survey, we design 17 questions which takes five minutes to finish the survey. The questions are about the food delivery system, modes of transportation, personal details like age, gender, occupation, etc.
3.2.2. Survey Process
The survey type is an online survey using Google forms as a survey instrument. The time duration of this survey is 36 days, from 7th March 2018 to 11th April 2018. To target only one city, i.e., Mumbai, this survey was posted on social networking site like Facebook and WhatsApp, where found some Mumbai local community groups on Facebook which helps a lot to fill out the surveys. Our target respondents are from Mumbai, India.
Figure 3.1: Data collection procedure
3.3. Data Description
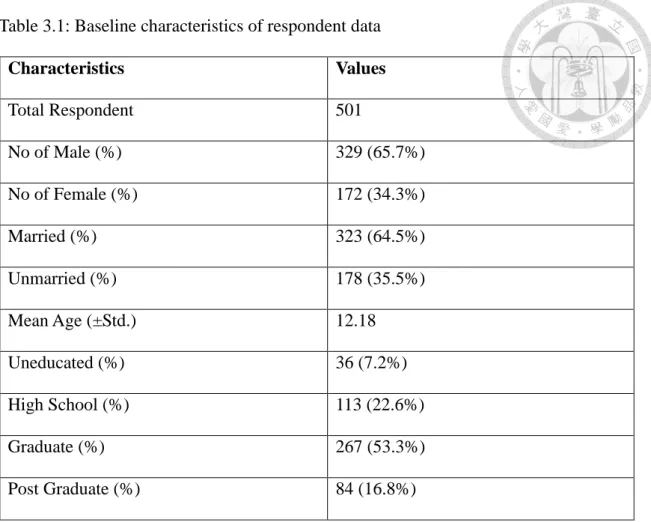
The below table is for the analysis of data while obtained during the online survey. The respondent of this survey are living in Mumbai or had been living in Mumbai.
Table 3.1: Baseline characteristics of respondent data
Characteristics Values
Total Respondent 501
No of Male (%) 329 (65.7%)
No of Female (%) 172 (34.3%)
Married (%) 323 (64.5%)
Unmarried (%) 178 (35.5%)
Mean Age (±Std.) 12.18
Uneducated (%) 36 (7.2%)
High School (%) 113 (22.6%)
Graduate (%) 267 (53.3%)
Post Graduate (%) 84 (16.8%)
Table 3.2: Main concern while choosing for food delivery services
Option Male Female Total
Home-made food 184 (57.3%) 137 (42.7%) 321
Warm/hot food 124 (77.5%) 36 (22.5%) 160
Less waiting time for food
64 (72.7%) 24 (27.3%) 88
Tasty and healthy food
62 (62.6%) 37 (37.4%) 99
Reasonable price for delivery service
86 (64.2%) 48 (35.8%) 134
Table 3.3: Eating Habit in India
Option Male Female Total
Vegan 27 (36.5%) 47 (63.5%) 74
Vegetarian 228 (66.5%) 115 (33.5%) 343
Non-vegetarian 74 (88%) 10 (12%) 84
Total 329 (65.7%) 172 (34.3%) 501
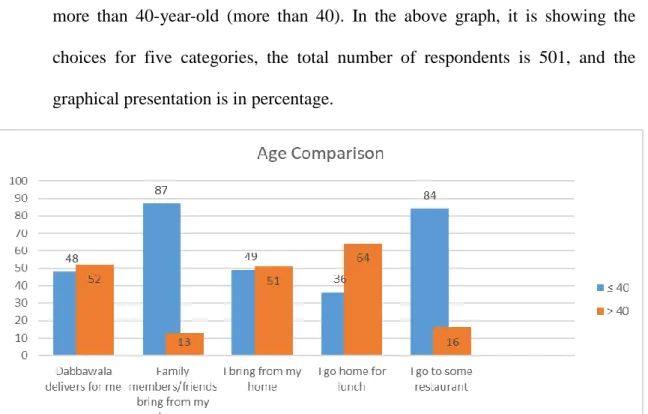
The age comparison between up to 40 years old (less than or equal to 40) to more than 40-year-old (more than 40). In the above graph, it is showing the choices for five categories, the total number of respondents is 501, and the graphical presentation is in percentage.
Figure 3.2: Age description according to their primary choice for the lunch
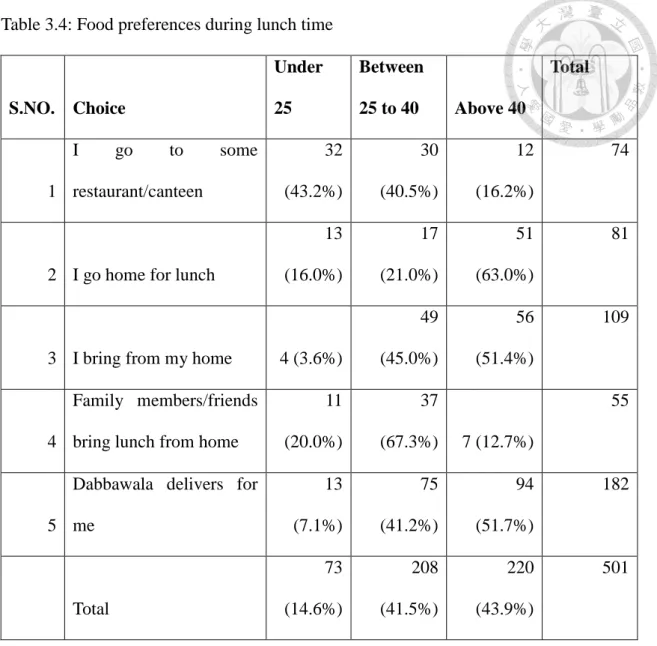
Table 3.4: Food preferences during lunch time
S.NO. Choice
Under 25
Between
25 to 40 Above 40
Total
1
I go to some
restaurant/canteen
32 (43.2%)
30 (40.5%)
12 (16.2%)
74
2 I go home for lunch
13 (16.0%)
17 (21.0%)
51 (63.0%)
81
3 I bring from my home 4 (3.6%)
49 (45.0%)
56 (51.4%)
109
4
Family members/friends bring lunch from home
11 (20.0%)
37
(67.3%) 7 (12.7%)
55
5
Dabbawala delivers for me
13 (7.1%)
75 (41.2%)
94 (51.7%)
182
Total
73 (14.6%)
208 (41.5%)
220 (43.9%)
501
The following table is showing the age wise distribution that is less than 25 years, between 25 to 40 years and more than 40 years and gender wise distribution for each choice. In each choices which is Dabbawala users, Family members/friends bring lunch from home, I go to some restaurant or canteen, I go home for lunch and I bring from my home.
Table 3.5: For dabbawala users
S.NO Age Total Male Female
1 under 25 13 1 12
2 25-40 75 48 27
3 more than 40 94 91 3
Table 3.6: Family members/friends bring lunch from home
S.NO. Age Total Male Female
1 under 25 11 3 8
2 25-40 37 15 22
3 more than 40 7 7 0
Table 3.7: Those who go to some restaurant or canteen
S.NO. Age Total Male Female
1 under 25 32 21 11
2 25-40 30 21 9
3 more than 40 12 9 3
Table 3.8: Those who go home for lunch
S.NO. Age Total Male Female
1 under 25 13 4 9
2 25-40 17 11 6
3 more than 40 51 44 7
Table 3.9: Those who bring from my home
S.NO. Age Total Male Female
1 under 25 4 2 2
2 25-40 49 27 22
3 more than 40 56 25 31
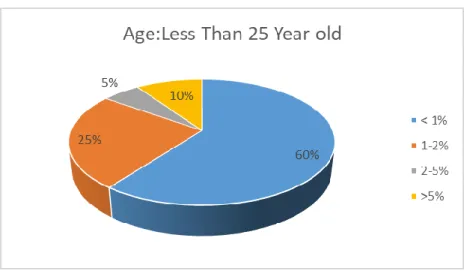
The below pie chart is showing the distribution for “how many time they eat outside food in a week (full meal)?” for age less than 25 years old. less than 1 time in a week=60%, between 1-2 times in a week=25%, between 2-5 times in a week=5%, more than 5 times in a week=10%
Figure 3.3: Outside food in a week for age less than 25 years
The below pie chart is showing the distribution for “how many time they eat outside food in a week (full meal)?” for age between 25 to 40 years old. less than 1 time in a week=64%, between 1-2 times in a week=20%, between 2-5 times in a week=9%, more than 5 times in a week=7%
Figure 3.4: Outside food in a week for age between 25-40 years
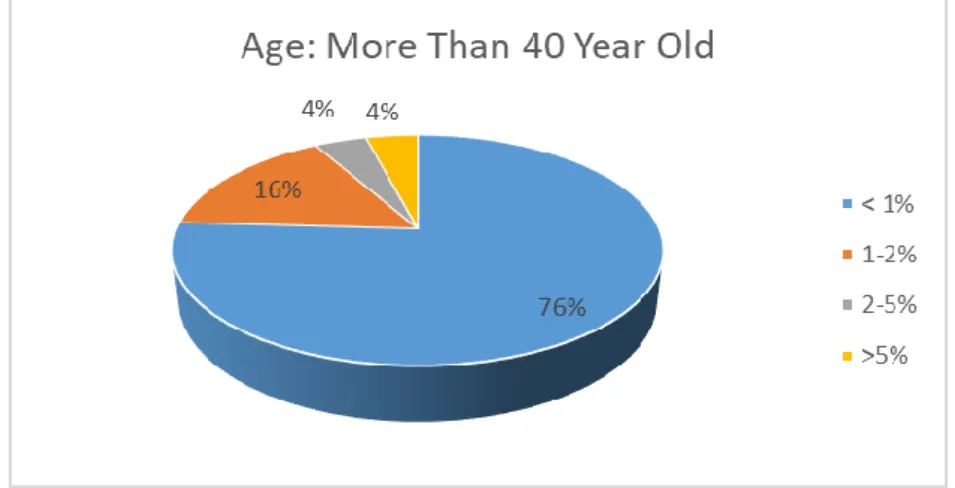
The below pie chart is showing the distribution for “how many time they eat outside food in a week (full meal)?” for age less than 25 years old. less than 1 time in a week=76%, between 1-2 times in a week=16%, between 2-5 times in a week=4%, more than 5 times in a week=4%
Figure 3.5: Outside food in a week for age more than 40 years
Overall Age distribution of respondent, it is categorized into three categories i.e., under 25 years, between 25 to 40 year and over 40 years. Where we find the only 15% of the total responses comes under 25 years old, then around 42%
comes between 25 to 40 years old and around 44% are in over 40 years old category.
Figure 3.6: Age wise distribution of respondents
The below pie chart is a chart of the monthly expenditure for “those who bring lunch from home”. The monthly expenditure distribution is in Indian rupees (INR)- Here the distribution of monthly expenditure is as follows - Less than 10000=15%, Between 10000 to 25000=59%, Between 25000 to 40000=7%, Between 40000 to 60000=3%, Between 60000 to 80000=4%, Between 80000 to 100000=4%, More than 100000=8%
Figure 3.7: Monthly expenditure for those who bring lunch from home. (for 1st utility function)
The below pie chart is a chart of the monthly expenditure for “those who use to go restaurant or canteen”. The monthly expenditure distribution is in Indian rupees (INR)- Here the distribution of monthly expenditure is as follows - Less than 10000=43%, Between 10000 to 25000=35%, Between 25000 to 40000=7%, Between 40000 to 60000=7%, Between 60000 to 80000=3%, Between 80000 to 100000=1%, More than 100000=4%
Figure 3.8: Monthly expenditure for those who use to go to a restaurant or canteen. (for 2nd utility function)
The below pie chart is a chart of the monthly expenditure for “those who go home for lunch”. The monthly expenditure distribution is in Indian rupees (INR)- Here the distribution of monthly expenditure is as follows - Less than 10000=34%, Between 10000 to 25000=35%, Between 25000 to 40000=16%, Between 40000 to 60000=9%, Between 60000 to 80000=4%, Between 80000 to 100000=1%, More than 100000=1%
Figure 3.9: Monthly expenditure for those who go home for lunch (for 3rd utility function)
The below pie chart is a chart of the monthly expenditure for “those who choose dabbawala service”. The monthly expenditure distribution is in Indian rupees (INR)- Here the distribution of monthly expenditure is as follows - Less than 10000=32%, Between 10000 to 25000=33%, Between 25000 to 40000=17%, Between 40000 to 60000=12%, Between 60000 to 80000=3%, Between 80000 to 100000=2%, More than 100000=1%
Figure 3.10: Monthly expenditure for those who choose dabbawala service (for 4th utility function)
The below pie chart is a chart of the monthly expenditure for “family members or friends bring food from home for them”. The monthly expenditure distribution is in Indian rupees (INR)- Here the distribution of monthly expenditure is as follows - Less than 10000=34%, Between 10000 to 25000=53%, Between 25000 to 40000=7%, Between 40000 to 60000=4%, Between 60000 to 80000=0%, Between 80000 to 100000=0%, More than 100000=2%
Figure 3.11: Monthly expenditure for family members or friends bring food from home
Data for those who like to go home for their lunch- Table 3.10: Different categories for motorbike users
Categories Dabbawala deliver for me
Family member or friends bring from home
Bring from home
Go home for lunch
Go to
Restaurant
Total
Motorbike Users
36 15 59 41 19 170
In the about data for the motorbike users, the following choices are dabbawala users, family or friends bring for home, they pick their lunch box with themselves, go home for lunch and go to some restaurant or canteen. The total number of respondent under these categories is 170.
Figure 3.12: Motorbike users for different choices
Table 3.11: Different categories for daily commute trip up to 30 minutes Categories Dabbawala
deliver for me
Family member or friends bring from home
Bring from home
Go home for lunch
Go to
Restaurant
Total
Travel time
101 49 39 57 38 284
In the about data for the daily commute trip and daily travel time which is considered up to 30 minutes, the following choices are dabbawala users, family or friends bring for home, they pick their lunch box with themselves, go home for lunch and go to some restaurant or canteen. The total number of the respondent under these categories is 284.
Figure 3.13: Distribution of daily commute trip for different categories
Table 3.12: Representation of field work for different categories Categories Dabbawala
deliver for me
Family member or friends bring from home
Bring from home
Go home for lunch
Go to
Restaurant
Total
Field Work
7 2 33 8 10 60
In the about data for the occupation which has field work the following choices are dabbawala users, family or friends bring for home, they pick their lunch box with themselves, go home for lunch and go to some restaurant or canteen. The total number of respondent under these categories is 60.
Figure 3.14: Occupation as fieldwork for different choices
Data for Dabbawala users-
Table 3.13: Representation of variables used for dabbawala users
Categories No. Of Respondent In Percentage
Time restriction 90 49.50%
Lack of restaurant 42 23.10%
Cheap 91 50%
Reliable 137 75.30%
Homemade 63 34.60%
The total numbers of the respondent are 182 in this category, and the choices are as a form of the checkbox. The following variables for this categories are “Time Restriction, Lack of Restaurant, Cheap, Reliable and Homemade Food.”
Figure 3.15: Representation of dabbawala users in different variables in percentage
Data for a family member or friends bring food for me from home-
Table 3.14: Representation of variables used for family members or friends bring lunch from home
Categories No. Of respondent In percentage
Homemade food 54 98.20%
Warm or hot food 5 9.10%
The total numbers of the respondent are 55 in this category and the choices are as a form of the checkbox. The following variables for this categories are “Warm or Hot food and Homemade Food.”
Figure 3.16: Representation of family members or friends bring food for me from home in different variables in percentage
CHAPTER 4. METHODOLOGY
In this research, multinomial logit (MNL) model is use to this study to forecast the demand side characteristics of Mumbai Dabbawalas. This model is used in this study because the dependent variable with the help of which the demand side characteristics is forecasted is discrete. In multinomial logit model outcome probabilities are determined through the estimated function. In this paper, it is consisting of five discrete choices.
4.1. Multinomial Logit Model
The logit model is used for estimation, testing, and prediction. The dependent variables should be nominal or discrete by choices. If the choices are more than two levels means if our dependent variable has unordered categories for example color of flowers: yellow, green, pink. In the simple sentence, the multinomial logit model is used for analyzing the data which discrete choices. There are key conditions for fiiting a logistic regression model; (i) the model relating the parameters pi to the predictors x1i, x2i,….xki must closely resemble the true relationship between the parameter and the predictors. (ii) the outcome for each case Yi, must be independent of the other outcomes for other cases. To evaluate the independence assumption using the model residuals and use the same approach as in multiple regression.
For logistic regression, the expected value of the outcome (pi) is fitted probability for the observation. Modeling the probability of an event the key to transform the response variable (pi) = β0+β1X1i, X2i,….Xki it can be positive, negative or zero.
The binary outcome of dependent variables is taking a value, which is in the form of responder/ non-responder, subscriber/ non-subscriber, the Account holder will make
payment/ no payment. For more than two outcomes polychotomous/multiclass polychotomous logistic/ multinomial logit (Z Chen, L Kuo, 2001). At times, the dependent variable has more than two possible outcomes. They are nominal variable;
there is no order in the outcome. We need to use the independent variables to predict the outcome. The simple approach is k models for k classes. As a set of independent binary regressions, convert multinomial to many binomial regressions.
This model is estimated by achieving the maximum simulated likelihood method with its multi-dimensional log-likelihood function. The pseudo-random points are resulting as an average value. The standard error or “t” value is presenting the impact factor of the variables negative value of standard error showing the probability of the variable is less than 50%, positive value of standard error showing the probability of the variable is more than 50% and insignificance value of the variable showing the null affect which means the value is not significance and its value lies between ± 1.30 (C. R.
Bhat, and Gossen Rachel, 2004; C.R. Bhat, 2001).
Then, outcome= class A, advance solution approach- simultaneous models. k-1 models for k classes. As a set of independent binary regression. It is just one of the several methods. Let's see it in the context of logistic regression. Pak = Probability for (a) will be chosen by individual class (k) and the variable Vak = c+b1*X1+b2*X2+…...+bn*Xn, it represents, the utility function. Where b1, b2…bn = parameters to be estimated and X1, X2…. Xn is the variable chosen for the utility function and ‘c’ is the constant for the utility function (N Ashford et al.,1987).
The log likelihood is maximum is preferable, but all variable should be significant. The general formula of multinomial logit model to find probability is “P”,
= P
Where,
P= probability function, Exponential=e,
Utility function= β0+ β1 +…. + βn
where, utility function is a summation of multiplication of the variable and its coefficient,
Number of variables used in the utility function= n
Some important aspect- when results are in smaller standard errors for the parameters estimates than when it is separately. Several methods of estimated parameters of these equations is not covering here. The choice of the baseline category has no effect on the parameters estimates for comparing two categories “a” and “b”.
In the model, it consists of five discrete choices and it utility functions should be written as-
1. For first utility function, U(brh)=brh*one+ocp*field
where “U” is representing utility function, “brh” is bring food from home, “ocp” is occupation and “field” is fieldwork. The reason behind the selection of this variable is no specific place and time for taking lunch.
2. For second utility function, U(rest)=B*Epd
where “U” is representing utility function, “rest” is go to some restaurant, “B” is a monthly expenditure for those who go restaurant for their lunch and “Epd” is representing average monthly expenditure. The reason to choose monthly expenditure is the probability of average monthly expenditure is high for this category.
3. For third utility function, U(gohome)=gohme*one+Dcom*Moto+Trip*Travelt where “U” is representing utility function, “gohome” is go home for their lunch,
“Trip” is daily commute trip and “Travelt” is travel time for daily commute trip. The reason behind the selection of this variable is assuming the workplace is not far from home or they own a vehicle.
4. for fourth utility function,
U(dbl)=C*Epd+Timer*x17+Lackr*x18+Cheap*x19+Reliable*x20+Homed*x24 where “U” is representing utility function, “dbl” is for dabbawala users, “C” is monthly expenditure for dabbawala users and “Epd” is average monthly users, “Timer” is time restriction for those who use dabbawala service, “Lackr” is lack of restaurants nearby workplace, “Cheap” means dabbawala service is cheaper than other food delivering service, “Reliable” means your lunch box is delivered to you in time and “Homed” is representation for homemade food for dabbawala users. The reason behind to choosing Timer, Lackr, Cheap, Reliable variable are specially for dabbawala users and other two variables Epd and Homed is revelant and applicable for this category.
5. for first utility function, U(family)=Home*x24+Warm*x25
where “U” is representing utility function, “family” is for family members or friends bring food for me from home, “Home” is representation for homemade food for those who get their lunch from family members or friends bring for them and “Warm” is representing the hot or warm food for this category. The reason behind to choosing homemade food is family members or friends bring food is usually for home and if it is fresh food than might be warm also.
Table 4.1: For data description and its meaning which is used in our model
S.NO. Categories Variables Full meaning
1 CONSTANT BRH BRING FROM
HOME
2 INDEPENDENT OCP OCCUPATION
3 B
MONTHLY EXPENDITURE FOR THOSE WHO
GO TO
RESTAURANT
4 CONSTANT GOHOME GO TO HOME
5 INDEPENDENT DCOM DAILY COMMUTE
6 INDEPENDENT TRIP DAILY TRIP TIME
7 INDEPENDENT C
MONTHLY EXPENDITURE FOR DABBAWALA USERS
8 INDEPENDENT TIMER
TIME
RESTRICTION
9 INDEPENDENT LACKR
LACK OF
RESTAURANT
10 INDEPENDENT CHEAP CHEAP
11 INDEPENDENT RELIABLE RELIABLE
12 INDEPENDENT HOMED
HOME FOOD FOR DABBAWALA USERS
13 INDEPENDENT HOME HOME FOOD
BRING FROM FAMILY OR FRIENDS.
14 INDEPENDENT WARM
WARM OR HOT FOOD
4.2. Descriptive Statistics
Descriptive analysis for total respondent for this data is 501. As taken by the online survey. The first row of descriptive statistic is representation of dependent variable which has five discrete choices and rest all rows are independent variable which has different type of discrete choices.
Table 4.2: Descriptive analysis for total respondent How do you obtain your lunch
primarily?
21.8%=I bring from my home, 14.8%=I go to some restaurant/mess, 16.2%=I go home for lunch,
36.3%=dabbawala delivers for me, 11%=family members/friends bring from my home
I bring from my home 21.8%=yes,
78.2%=no I go to some restaurant 14.8%=yes,
85.2%=no
I go home for lunch 16.2%=yes,
83.8%=no Dabbawala delivers for me 36.3%=yes,
63.7%=no Family/friends bring from my home 11%=yes,
89%=no
Gender ? 65.7%=male,
34.3%=female
Age? Mean age= 39
Occupation? 68.9%=office work,
12%=field work, 17.8%=student, 1.4%=other
Marital status? 64.5%=married,
35.5%=unmarried Do you own a vehicle? 60.7%=yes,
39.3%=no If yes, which type of vehicle? 0=Don’t have,
74.7%=two wheelers, 11.2%=four wheelers, 14.1%=both
Education level? 7.2%=no schooling completed,
22.6%=high schooling graduate, 53.3%=college degree,
16.8%=master’s degree or higher,
0.2%=other Average monthly expenditure in Indian
Rupees?
30.5%=less than 10000, 41.3%=10000-25000, 12.2%=25000-40000, 8%=40000-60000, 2.8%=60000-80000, 2%=80000-100000, 3.2%=more than 100000 How long does it take you to travel for
the daily commute in one way?
7%=less than 10 minutes, 13.6%=10-20 minutes, 36.1%=20-30 minutes, 34.5%=30-45 minutes, 8.8%=more than 45 minutes Which mode do you primarily choose
for your daily commute?
26.3%=public bus, 1.4%=taxi,
10.2%=private car, 33.9%=motorbike, 8.6%=bicycle,
12.8%=local train/metro, 6.6%=walking
0.2%=shared cab Time restriction/limitation 18%=yes,
82%=no Lack of restaurants nearby your 8.4%=yes,
workplace 91.6%=no
It is cheap (cheaper than other service providers)
18.2%=yes, 81.8%=no
Reliable (delivers lunch box to you in time)
27.3%=yes, 72.7%=no Not applicable (those who don’t use
dabbawala service)
62.5%=yes, 37.5%=no How often do you eat outside in a week
(full meal)?
68.5%=less than 1 time in a week, 19%=1-2 times in a week,
6.4%=2-5 times in a week,
6.2%=more than 5 times in a week.
Your eating habit? 68.5%=pure vegetarian,
16.8%=non vegetarian, 14.8%=vegan
Homemade food 64.1%=yes,
35.9%=no
Warm/hot food 30.1%=yes,
69.9%=no Less waiting time for food 17.6%=yes,
72.4%=no Tasty and healthy food 19.6%=yes,
80.4%=no
Reasonable price for delivery service 28.5%=yes, 71.5%=no
4.3. Model Development
Detail description and discussion of all utility function- 1. For the 1st utility function
u(brh)=brh*one+Ocp*Field Table 4.3: For first utility function u(brh)=0.75+1.45*Field
S.NO. Variable Description
Coefficient value
“t” value
1 Field
Indicating that the
respondent has
fieldwork (Field=1);
otherwise, Field =0.
1.45
4.66
2 Brh Constant 0.75
2. For the 2nd utility function u(rest)=B*Epd
Table 4.4: For second utility function u(rest)= 0.69*Epd
S.NO. Variable Description
Coefficient value
“t” value
1 Epd
Indicating that the respondent has Monthly Expenditure.
(Epd =1); otherwise, Epd =0.
0.69
2.24
3. For the 3rd utility function
u(gohome)=gohome*one+Dcom*Moto+Trip*Travelt/
Table 4.5: For third utility function
u(gohome)= -0.05+0.63*Moto+0.81*Travelt
S.NO. Variable Description
Coefficient value
“t” value
1 Moto
Indicating that the respondent has Mode of the daily commute.
(Moto =1); otherwise, Moto =0.
0.63
2.41
2 Travelt
Indicating that the respondent has Daily commute trip. (Travelt
=1); otherwise, Travelt
=0.
0.81
2.89
3 Gohome Constant -0.05
4. For the 4th utility function
u(dbl)=C*Epd+Timer*x17+Lackr*x18+Cheap*x19+Reliable*x20+Homed*x24 Table 4.6: For fourth utility function
u(dbl)= -1.03*Epd+2.64*X17+5.13*X18+3.93*X19+6.91*X20-2.49*X24
S.NO. Variable Description
Coefficient value
“t” value
1 Epd
Indicating that the
respondent has
Monthly expenditure.
(Epd =1); otherwise, Epd =0.
-1.03
-2. 00
2 X17
Indicating that the respondent has a Time restriction. (X17=1);
otherwise X17=0.
2.64
3.29
3 X18
Indicating that the respondent has Lack of restaurant nearby your workplace. (X18=1);
otherwise X18 =0.
5.13
6.48
4 X19
Indicating that the respondent has It is
3.93
5.07
cheaper than another service provider.
(X19=1); otherwise X19 =0.
5 X20
Indicating that the
respondent has
Reliable means
delivers to you in time.
(X20=1); otherwise X20=0.
6.91
6.00
6 X24
Indicating that the
respondent has
Homemade food For dabbawala service.
(X24=1); otherwise X24 =0.
-2.49
-3.67
5. For the 5th utility function
u(family)=Home*x24+Warm*x25 Table 4.7: For fifth utility function u(family)= 0.64*X24-0.96*X25
S.NO. Variable Description
Coefficient value
“t” value
1 X24
Indicating that the respondent has Homemade food bring from home by family members or friends.
(X24=1); otherwise X24 =0.
0.64
2.14
2 X25
Indicating that the respondent has Warm and hot food. (X25=1);
otherwise X25 =0.
-0.96
-1.96
4.4. Result Discussion
Hence, the develop logit model with five discrete choices- 1st utility function: Bring lunch from home.
u(brh)=0.75+1.45*Field
2nd utility function: Go to some restaurant or canteen for lunch.
u(rest)= 0.69*Epd
3rd utility function: Go home for lunch.
u(gohome)= -0.05+0.63*Moto+0.81*Travelt
4th utility function: Dabbawala delivers for me.
u(dbl)= -1.03*Epd+2.64*X17+5.13*X18+3.93*X19+6.91*X20-2.49*X24
5th utility function: Family member or friends bring lunch for me from home.
u(family)= 0.64*X24-0.96*X25
1). u(brh) = 0.75+4.66*Field, representation in the form of “T” value, Ocp = (4.66), The value is significant and positive which means most of the respondents were have fieldwork. Therefore, they prefer to bring their lunch box from home with himself. The reason behind bring from home is the lack of restaurant nearby their workplace and no fix time and place to take the lunch.
2). u(rest) = 2.24*Epd, representation in the form of “T” value, B = (2.24), The value is significant and positive for this choice which means the respondents are willing to pay more money or their monthly expenditure is more. The reason behind their more expenditure is earning a good salary, live away from family, they live alone.
3). u(gohome) = -0.05+2.41*Moto+2.89*Travelt, representation in the form of “T”
value, Dcom = (2.41), The value is significant and positive which means many peoples prefer to choose a motorbike for their daily commute. The reason behind using a motorbike is convenient, lack of public transportation, easily escape from the traffic jam.
Trip = (2.89), this value indicates that travel time will play a significant role for people who engage with their work during day time and its considered to be less than 30 minutes.
4). u(dbl) = -2.00*Epd+3.29*x17+6.48*x18+5.07*x19+6.00*x20-3.67*x24,
representation in the form of “T” value, C = (-2. 00), The value is significant and negative which means the average monthly expenditure is low. The reason behind their low expenditure is because they choose dabbawala service which is as compared to another service. Most of them are a student and belong to the middle-class peoples.
Timer = (3.29), The value is significant and positive which means the peoples who choose the dabbawala service they don’t spend much time for lunch or they have a time limitation. The reason is they are a student, office worker where the time is limited for lunch. Lackr = (6.48), The value is significant and positive which means the reason behind to choose this utility function is the lack of good restaurant nearby their workplace which can provide food during lunch break. Cheap = (5.07), The value is significant and positive which means those who choose this option they this service is cheaper than other services. Reliable = (6.00), The value is significant and positive which means they trust this service or they have some experience with the service or they believe their lunch box will deliver in time to them. Homed = (-3.67), The value is significant and negative which means their primary concerns are not about homemade food because the dabbawala service is also available for canteen food.
5). u(family) = 2.14*x24-1.96*x25, representation in the form of “T” value, Home = (2.14), The value is significant and positive which means their primary concern is homemade food (Although the food comes from home only). Warm = (-1.96), The value is significant and negative which means the fresh and recently cooked food is warm but traveling from one place to another the homemade food may not warms; their primary concern is not warm food.
CHAPTER 5. CONCLUSIONS
5.1. Research Summary
According to the obtained results, we have understood that the “Demand of Dabbawala”
is not being constant from last few years, but in future, the demand of dabbawala can be affected because many third-party food delivery service providers have emerged with high equipped technologies offering 24*7 services. The latter can replace their business model. Therefore, the Dabbawala need to modify their business model by using technology-based resources like mobile-based service and website to subscribe for their services. They need expand their service to restaurant and canteen and need to focus on supply chain integration on both vertical and horizontal direction.
For the analysis of demand, they need to make ties with residential apartment association were many peoples can join their service which helps them to make more customer and good for their growth. It is only for the local community; it is difficult to cooperate with multinational companies. Apart from delivery services for lunch boxes, they need to do promotional activities for multinational companies. The Dabbawala can also provide resources for training purpose like delivering vegetables, utility bills, etc.
They can also give their service to e-commerce portal like Amazon, Flipkart, etc.
The working concept of Mumbai Dabbawala suggests an efficient way of managing the logistics and transportation of food supplies. The unique structure and the operations of the Dabbawala has made an impeccable model of supply chain management and has been widely followed by corporates and researchers around the globe. Further, to match up with the ever-growing technology changes the Dabbawala has welcomed every sort of upgradation in the present time to increase their market
outreach. Although there lie many competitions in the way of Dabbawala, their commitment to ground values and social connections will always keep them way ahead.
The Mumbai city contributes the success of Mumbai dabbawala because Mumbai has a unique feature to operate there and with benefits and the presences of infrastructure helps them to provide their service since last century. However, it would be interesting to replicate the framework in other cities of India and thus warrants future research.