國立臺灣大學生物資源暨農學院生物產業機電工程學系 博士論文
Department of Bio-Industrial Mechatronics Engineering College of Bioresources and Agriculture
National Taiwan University Doctoral Dissertation
應用獨立成分分析法於生物材料之近紅外光分析 Near Infrared Analysis of Biomaterials
Using Independent Component Analysis
莊永坤
Yung-Kun Chuang
指導教授:陳世銘 博士 Advisor: Suming Chen, Ph.D.
中華民國 102 年 7 月
July, 2013
誌 謝
博士的訓練過程是充滿回憶的,很高興能夠順利完成博士論文的撰寫。一路 走來承蒙指導教授陳世銘博士的提攜與教誨,老師無論於身教或言教皆樹立良好 的典範,使我自懵懂青澀的大學專題生,逐步邁向具有獨立思考與解決問題能力 的博士,在此衷心地感謝。
承蒙博士論文指導委員臺灣大學生物機電系盧福明榮譽教授、中興大學生物 機電系盛中德教授、中興大學生物機電系謝廣文副教授、宜蘭大學生物機電系邱 奕志院長對於本論文的細心審閱與斧正,謹於此致上最誠摯的感謝。美國馬里蘭 大學營養與食品科學系 Dr. Y. Martin Lo 與美國農業部 Beltsville 農業研究中心 Dr.
Stephen R. Delwiche 於本論文的指導與建議亦功不可沒,我對二位的感激之情難以 言喻。很感謝國家科學委員會提供為期一年的千里馬計畫(100-2917-I-002-004)
機會,使我有幸前往美國馬里蘭大學與美國農業部,接受兩位知名學者完整而紮 實的訓練與指導,並拓展我的國際觀,著實感激與珍惜。
在實驗室從事研究工作的過程中,感謝加增學長與宜璋學長帶領我入門,而 一路上亦師亦友的蔡兆胤博士,更是我學習的榜樣,經由共同處理實驗室內的許 多工作,使我受惠成長,特此感謝。也感謝世傑學長、翕雯學姐、毓良學長、錦 銘學長及詠惠,無論是維持實驗室內各項工作與計畫的順利運作,或對於我的協 助與鼓勵,皆功不可沒。很感謝宇帆、慶茵學姐、易平、育菘及俊吉學長提供我 論文研究中實驗與數據的幫助,以及美國農業部 Beltsville 農業研究中心工程師 Diane E. Chan 小姐協助潤飾論文的文字。至於在我求學過程中曾經一同共事的研 究助理、學長姐、同學及學弟妹們,你們都是我最好的同伴,也唯有長期以來良 好的團隊合作與氣氛,才能創造實驗室豐碩的研究成果,謝謝。
最後將此博士論文獻給我最親愛的父親、母親、兄長、女友及親友們,您們 總是無怨無悔地提供我生活與精神上的支持與鼓勵,使我能一路堅持到取得博士 學位,謹以此論文作為最好的禮物呈獻給您們,謝謝。
中文摘要
本論文使用獨立成分分析法為唯一之核心演算法,應用於三種生物材料之近 紅外光定量分析,包含蓮霧(Syzygium samarangense Merrill & Perry)、藥用植物 龍膽(Gentiana scabra Bunge)及白米之研究,亦對不同型態樣本(蔗糖水溶液、
蓮霧完整果、龍膽乾燥粉末及白米粒)進行分析探討。第一部分研究結合獨立成 分分析法與近紅外光光譜於蓮霧糖度之快速定量分析,結合 JADE 演算法、線性 迴歸及光譜前處理方法,分別對蓮霧與蔗糖溶液之近紅外光光譜進行分析。相較 於其他多變量分析方法,獨立成分分析法可提供更完整之蓮霧糖度資訊,其最佳 光譜檢量模式使用一次微分光譜搭配正規化處理,光譜範圍為 600~700 nm 與 900
~1098 nm,Rc = 0.988,SEC = 0.243°Brix,SEV = 0.381°Brix,顯示獨立成分分析 法可快速準確地擷取蓮霧光譜中之糖度資訊,並建立具高預測能力之光譜檢量模 式,更有效地定量蓮霧糖度。第二部分研究應用獨立成分分析法於龍膽指標成分 龍膽苦苷與當藥苦苷之近紅外光分析,對 94 個組織培養瓶苗與 68 個植株樣本(包 含 68 個地上部與 68 個地下部)進行探討。選擇與兩種指標成分高度相關之獨立 成分後,組織培養瓶苗、植株地上部及植株地下部清楚分佈於獨立成分空間之三 個位置,可觀察龍膽苦苷與當藥苦苷含量之變化趨勢。龍膽苦苷之最佳光譜檢量 模式使用二次微分光譜,光譜範圍為 600~700 nm、1600~1700 nm 及 2000~2300
nm,其 Rc = 0.847,SEC = 0.865%,SEV = 0.909%;當藥苦苷之最佳光譜檢量模式
使用一次微分光譜,光譜範圍為 600~800 nm 與 2200~2300 nm,其 Rc = 0.948,
SEC = 0.168%,SEV = 0.216%,皆具有良好之預測能力。本研究成功建立龍膽苦 苷與當藥苦苷之定性與定量關係,可針對不同生長時期之龍膽進行兩種指標成分 含量之檢測,作為快速且準確之龍膽品質評估工具。第三部分研究應用獨立成分 分析法於稻米新鮮度之快速定性與定量分析,新鮮度為決定稻米品質之重要指 標,稻米貯藏時間會影響其外觀、食味及營養價值。本研究對六個收穫時期(95
年第一期、96 年第一期、97 年第一期、98 年第一期、99 年第一期及 99 年第二期)
之白米進行探討,結果顯示不同新鮮度之白米清楚分佈於三維之獨立成分空間
中,對酸鹼度 pH 值所建立之光譜檢量模式亦具有高預測能力,其 Rc = 0.939,SEC
= 0.202,SEP = 0.233,表示結合獨立成分分析法與近紅外光光譜可有效評估稻米 之新鮮度,且 pH 值與脂肪酸度較年份期別為更合適之評量指標。結合獨立成分分 析法與近紅外光光譜可快速且正確地評估生物材料之內部成分,獨立成分分析法 提供近紅外光光譜於生物材料內部成分定量分析一項快速可靠之工具,應用於評 估生物材料內部品質具有重大貢獻。
關鍵詞:近紅外光光譜、獨立成分分析法、蓮霧、糖度、龍膽、龍膽苦苷、當藥 苦苷、稻米新鮮度
ABSTRACT
In this study, independent component analysis (ICA) was first adopted as the sole tool
in conducting NIR quantitative analyses of biomaterials, including wax jambu fruit
(Syzygium samarangense Merrill & Perry), medicinal plant Gentiana scabra Bunge,
and milled white rice, to evaluate the applicability of this method. The influence due to
various types of samples (sucrose solution, intact fruit, dry powder of Gentiana scabra
Bunge, and rice kernel) was also studied. In the first part, ICA was integrated with near
infrared (NIR) spectroscopy for rapid quantification of sugar content in wax jambu. The
JADE algorithm (Joint Approximate Diagonalization of Eigenmatrices) and linear
regression with spectral pretreatments were incorporated to analyze the NIR spectra of
wax jambu as well as sucrose solutions. Unlike other multivariate approaches, ICA
enabled comprehensive quantification of sugar content in wax jambu. In the present
study, ICA was used as the sole tool to build the NIR calibration model of internal
quality of intact wax jambu without any other assisted multivariate analysis methods.
The best spectral calibration model of wax jambu (600 to 700 nm and 900 to 1098 nm)
yielded Rc = 0.988, SEC = 0.243 °Brix, and SEV = 0.381 °Brix using the normalized
first derivative spectra. Thus, ICA can quickly identify and effectively quantify the
sugar contents in wax jambu with calibration models achieving high predictability. In
the second part, ICA was applied to NIR spectroscopy on the analysis of gentiopicroside
and swertiamarin, the two bioactive components of Gentiana scabra Bunge.
Independent components (ICs) that are highly correlated to the two bioactive
components were selected for the analysis of tissue cultures, shoots and roots, which
were found to distribute in three different positions within the domain (2D and 3D)
constructed by the ICs. This setup could be used for quantitative determination of
respective contents of gentiopicroside and swertiamarin within the plants. For
gentiopicroside, the spectral calibration model based on the 2nd derivative spectra
produced the best effect in the wavelength ranges of 600 to 700 nm, 1600 to 1700 nm,
and 2000 to 2300 nm (Rc = 0.847, SEC = 0.865 %, and SEV = 0.909 %). For
swertiamarin, spectral calibration model based on the 1st derivative spectra gave the best
effect in the wavelength ranges of 600 to 800 nm and 2200 to 2300 nm (Rc = 0.948,
SEC = 0.168 %, and SEV = 0.216 %). Both models showed a satisfactory predictability.
This study successfully established qualitative and quantitative correlations for
gentiopicroside and swertiamarin with NIR spectra, enabling rapid and accurate
inspection on the bioactive components of Gentiana scabra Bunge at different growth
stages. Furthermore, determination of freshness is an important issue for rice quality.
The storage time of rice has an enormous effect on its appearance, flavor, and quality of
the nutrients. A total of 180 white rice samples were collected from 6 crop seasons (2nd
crop of 2010, 1st crop of 2010, 1st crop of 2009, 1st crop of 2008, 1st crop of 2007 and 1st
crop of 2006) for the purpose of developing an ICA NIR based procedure for rice
freshness as quantified by pH. Freshness of white rice could be distinguished either
visually by a 3-dimensional diagram composed from ICs 2, 3 and 4, or statistically by a
calibration model (Rc = 0.939, SEC = 0.202, and SEP = 0.233). The results showed that
ICA with NIR has the potential to be a useful tool for evaluating rice freshness.
Compared to harvest time, pH value and fat acidity were more appropriate to serve as
indicators of rice freshness. By combining ICA with NIR spectroscopy, fast and
accurate evaluation of constituents in biomaterials could be achieved. ICA offers a rapid
and reliable tool for quantitative analyses of constituents in biomaterials by NIR
spectroscopy. The obtained results contribute substantially to identify multiple
constituents of biomaterials and evaluate their concentrations.
Keywords: Near infrared spectroscopy, Independent component analysis, Wax jambu,
Sugar content, Gentiana scabra Bunge, Gentiopicroside, Swertiamarin,
Rice freshness
CONTENTS
誌 謝 ... i
中文摘要 ... ii
ABSTRACT ... iv
CONTENTS ... vii
LIST OF FIGURES ... xii
LIST OF TABLES ... xv
CHAPTER 1. GENERAL INTRODUCTION ... 1
1.1 INTRODUCTION ... 1
1.1.1 WAX JAMBU ... 4
1.1.2 GENTIANA SCABRA BUNGE ... 5
1.1.3 RICE ... 7
1.2 GENERAL OBJECTIVE ... 8
1.3 DISSERTATION ORGANIZATION... 9
CHAPTER 2. INTEGRATION OF INDEPENDENT COMPONENT ANALYSIS WITH NEAR INFRARED SPECTROSCOPY FOR RAPID QUANTIFICATION OF SUGAR CONTENT IN WAX JAMBU ... 10
2.1 INTRODUCTION ... 10
2.2 MATERIALS AND METHODS ... 14
2.2.1 SAMPLE PREPARATION ... 14
2.2.2 NIR SPECTRA AND SUGAR CONTENT MEASUREMENT ... 14
2.2.3 DATA ANALYSIS ... 16
2.3 RESULTS AND DISCUSSION ... 22
2.3.1 SUCROSE SOLUTION ... 22
2.3.2 WAX JAMBU ... 35
2.4 CONCLUSIONS ... 46
CHAPTER 3. QUANTIFICATION OF BIOACTIVE GENTIOPICROSIDE IN A MEDICINAL PLANT GENTIANA SCABRA BUNGE BY NEAR INFRARED SPECTROSCOPY ... 48
3.1 INTRODUCTION ... 48
3.2 MATERIALS AND METHODS ... 50
3.2.1 G. SCABRA BUNGE SAMPLE PREPARATION ... 50
3.2.2 NIR SPECTRA AND HPLC MEASUREMENT ... 50
3.2.3 DATA ANALYSIS ... 51
3.3 RESULTS AND DISCUSSION ... 56
3.3.1 GENTIOPICROSIDE CONCENTRATION AND DISTRIBUTION IN G. SCABRA BUNGE ... 56
3.3.2 CORRELATION BETWEEN NIR SPECTRA AND
GENTIOPICROSIDE CONTENT ... 57
3.3.3 GENTIOPICROSIDE QUANTIFICATION USING SPECIFIC WAVELENGTH RANGES ... 61
3.3.4 GENTIOPICROSIDE QUANTIFICATION USING CCD CAMERA WAVELENGTH SPECTRA ... 67
3.4 CONCLUSIONS ... 75
CHAPTER 4. INTEGRATION OF INDEPENDENT COMPONENT ANALYSIS WITH NEAR INFRARED SPECTROSCOPY FOR ANALYSIS OF BIOACTIVE COMPONENTS IN A MEDICINAL PLANT GENTIANA SCABRA BUNGE ... 76
4.1 INTRODUCTION ... 76
4.2 MATERIALS AND METHODS ... 78
4.2.1 GENTIANA SCABRA BUNGE SAMPLE PREPARATION ... 78
4.2.2 NIR SPECTRA AND HPLC MEASUREMENT ... 79
4.2.3 DATA ANALYSIS ... 80
4.3 RESULTS AND DISCUSSION ... 85
4.3.1 DISTRIBUTIONS OF THE TARGET CONSTITUENTS IN GENTIANA SCABRA BUNGE ... 85
4.3.2 CORRELATION BETWEEN NIR SPECTRA AND TARGET CONSTITUENTS’ CONTENTS ... 86
4.3.3 NIR SPECTRA DECOMPOSITION AND ICA ANALYSIS OF THE
TARGET CONSTITUENTS ... 91
4.4 CONCLUSIONS ... 99
CHAPTER 5. INTEGRATION OF INDEPENDENT COMPONENT ANALYSIS WITH NEAR INFRARED SPECTROSCOPY FOR EVALUATION OF RICE FRESHNESS ... 101
5.1 INTRODUCTION ... 101
5.2 MATERIALS AND METHODS ... 103
5.2.1 SAMPLE PREPARATION ... 103
5.2.2 NIR SPECTRA AND PH VALUE MEASUREMENT ... 104
5.2.3 DATA ANALYSIS ... 106
5.3 RESULTS AND DISCUSSION ... 108
5.3.1 RELATIONSHIP BETWEEN FAT ACIDITY AND PH VALUE ... 108
5.3.2 DISTRIBUTIONS OF THE PH VALUE IN RICE ... 110
5.3.3 NIR SPECTRA DECOMPOSITION AND ICA ANALYSIS OF THE PH VALUE ... 112
5.4 CONCLUSIONS ... 117
CHAPTER 6. GENERAL CONCLUSIONS ... 119
6.1 GENERAL DISCUSSION ... 119
6.2 RECOMMENDATIONS FOR FUTURE RESEARCH ... 122
REFERENCES ... 123
LIST OF FIGURES
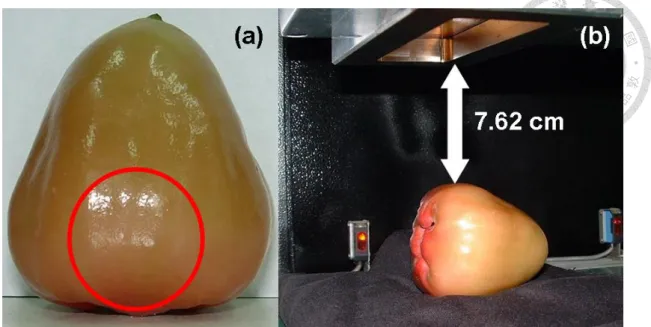
Fig. 2.1 A wax jambu (Syzygium samarangense Merrill & Perry) sample (A) side view
and the NIR measurement location, and (B) sample placement with suggested
distance 7.62 cm between the light source and the top of sample in the on-line
NIRS 6500 spectrophotometer. ... 16
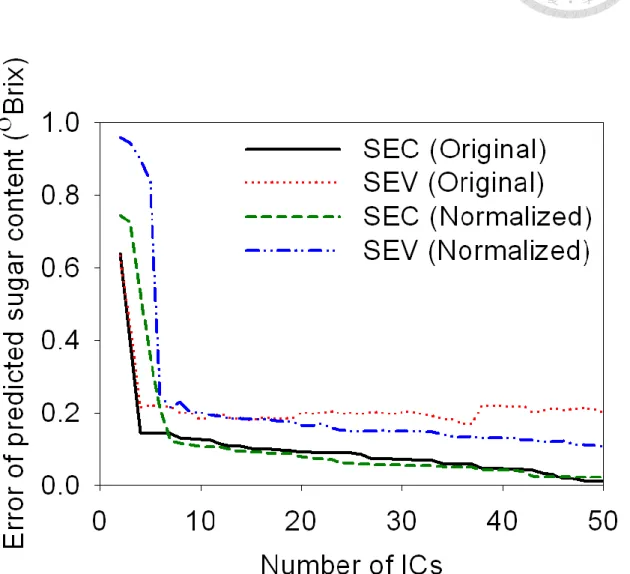
Fig. 2.2 Relationship between the numbers of ICs and errors of the predicted sugar
content for sucrose solutions. The most appropriate number of ICs for
normalized spectra was determined by the tendency of SEC (green-short dash
line) and SEV (blue-dash dot dot line) values. ... 24
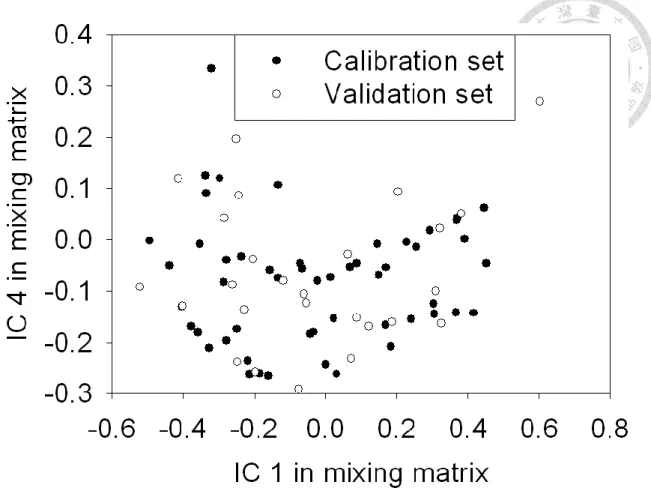
Fig. 2.3 Distribution of calibration and validation samples of sucrose solutions in IC
1-IC 4 space. IC 1 and IC 4 were randomly selected from the 7 ICs. ... 26
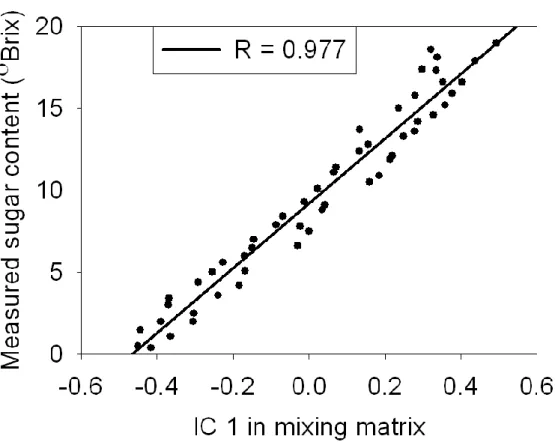
Fig. 2.4 Correlation between the values of IC 1 in the mixing matrix and the reference
sugar contents of sucrose solutions. ... 27
Fig. 2.5 (A) Original NIR spectra of sucrose solutions, (B) IC 1 decomposed from
calibration sets, and (C) the reflectance spectrum of sucrose powder
post-Detrend. ... 30
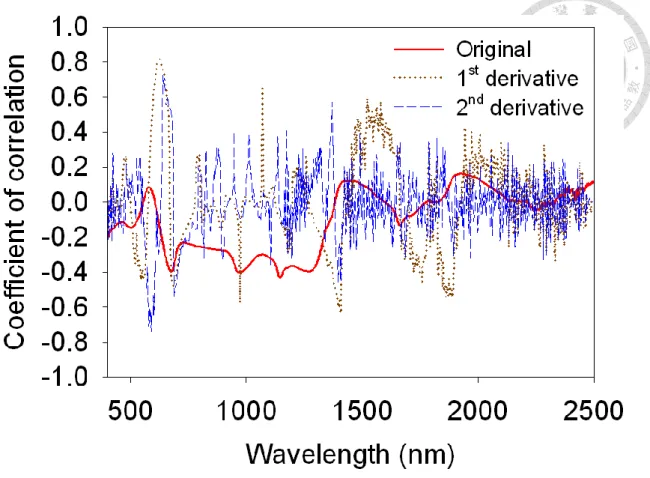
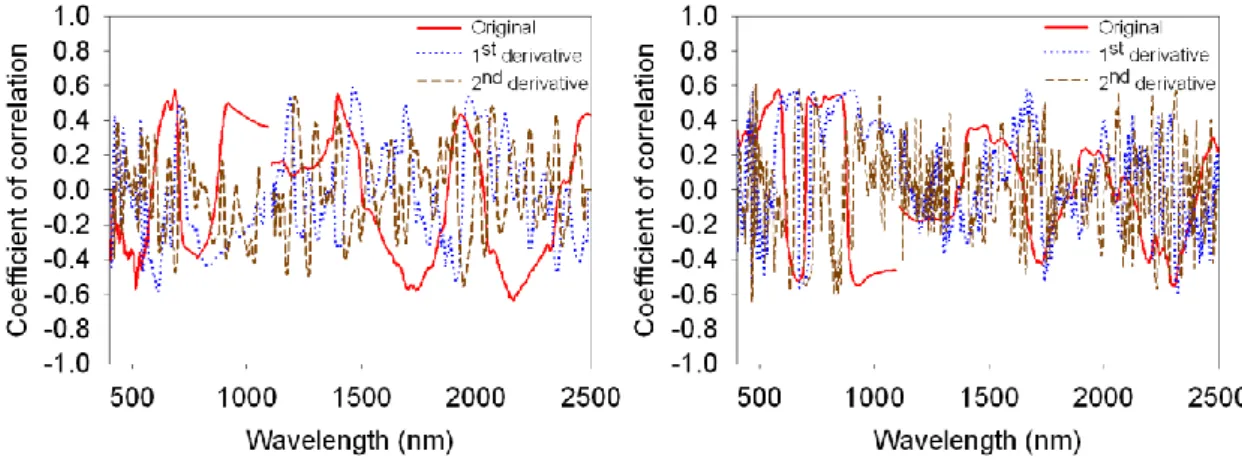
Fig. 2.6 Correlation coefficient distributions of the spectra and the sugar content of wax
jambu through three different spectral pretreatments (original spectra, 1st
derivative spectra, and 2nd derivative spectra). ... 38
Fig. 2.7 Relationship between spectral bands and errors of the predicted sugar content
for wax jambu when applying 7 to 30 ICs. Full spectrum range from 400 to
2498 nm was divided into 21 band regions by taking every 100 nm as a band
region. ... 40
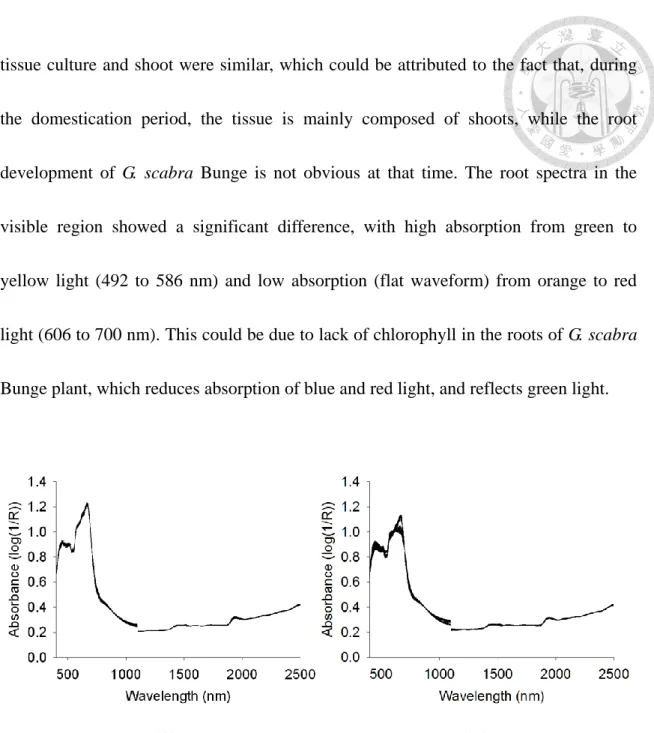
Fig. 3.1 The spectra of G. scabra Bunge powder post-MSC (A) tissue culture and (B)
grown plants. ... 58
Fig. 3.2 Correlation coefficient distributions between absorbance values of the spectra
and gentiopicroside contents of the G. scabra Bunge powder (A) tissue culture
and (B) grown plants. ... 61
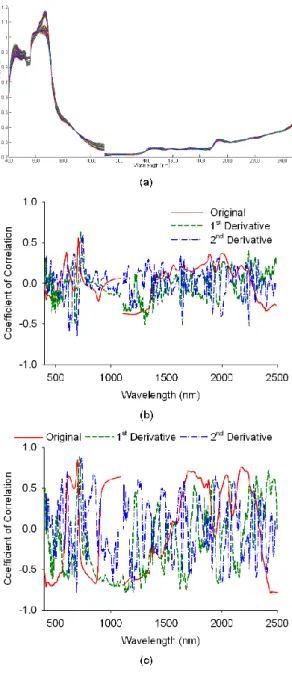
Fig. 4.1 (A) The spectra of Gentiana scabra Bunge powder post-MSC; (B) correlation
coefficient distributions between the spectra and gentiopicroside; and (C)
correlation coefficient distributions between the spectra and swertiamarin. .... 90
Fig. 4.2 The three ICs decomposed from the original spectra of Gentiana scabra Bunge
powder post-MSC that has higher correlation with gentiopicroside and
swertiamarin. ... 92
Fig. 4.3 Scores of tissue culture, shoot, and root in IC 4-IC 5 space established with
calibration samples. (A) = calibration set, (B) = validation set. Scores of
gentiopicroside and swertiamarin in IC 4-IC 5 space established with
calibration samples. (C) = calibration set, (D) = validation set. ... 94
Fig. 4.4 Scores of tissue culture, shoot, and root in IC 4-IC 5-IC 6 space established
with calibration samples. (A) = calibration set, (B) = validation set. Scores of
gentiopicroside and swertiamarin in IC 4-IC 5-IC 6 space established with
calibration samples. (C) = calibration set, (D) = validation set. ... 96
Fig. 4.5 Relationship between the estimated contents and the reference contents of (A)
gentiopicroside; and (B) swertiamarin in Gentiana scabra Bunge. ... 99
Fig. 5.1 Relationship between fat acidity and pH value established by the 18 selected
rice samples (Hu, 2011; Chen et al., 2011). ... 109
Fig. 5.2 Distributions of pH values for six crop seasons of white rice samples. ... 111
Fig. 5.3 Relationship between the numbers of independent components and the model
standard errors for pH value. ... 113
Fig. 5.4 Scores of white rice with 6 crop seasons in the vector space of independent
components 2, 3, and 4 established with calibration samples. a = calibration set,
b = validation set. ... 115
Fig. 5.5 Scatter plot of the reference pH values and the predicted pH values by
independent component analysis of the NIR spectra... 117
LIST OF TABLES
Table 2.1 Summary of sucrose solutions and sample sugar contents. Total samples (n =
78), calibration set (n = 52) and validation set (n = 26) were arranged to have
consistent distributions of sugar content. ... 22
Table 2.2 Regression coefficient matrix of sucrose solutions with 7 ICs were extracted
from the NIR spectra of calibration sets. Correlation between the absolute
value of each IC in regression coefficient matrix and sugar content was
examined. ... 28
Table 2.3 Regression results by ICA and PLSR analyses for sucrose solutions. ... 32
Table 2.4 Summary of wax jambu (Syzygium samarangense Merrill & Perry) and
sample sugar contents. Total samples (n = 114), calibration set (n = 76) and
validation set (n = 38) were arranged to have consistent distributions of sugar
content. ... 36
Table 2.5 Regression results by ICA and PLSR analyses for wax jambu (without
spectral pretreatment). ... 42
Table 2.6 Regression results by ICA and PLSR analyses for wax jambu (with spectral
pretreatment). ... 45
Table 3.1 The gentiopicroside content in tissue culture and grown plants of G. scabra
Bunge. ... 57
Table 3.2 The gentiopicroside content of effective samples, calibration set, and
validation set in tissue culture and grown plants. ... 62
Table 3.3 Prediction of the gentiopicroside content in tissue culture and grown plants of
G. scabra Bunge by MPLSR models in the wavelength of 400 to 2498 nm. . 65
Table 3.4 Prediction of the gentiopicroside content in tissue culture and grown plants of
G. scabra Bunge by MPLSR models in the wavelength of 400 to 1098 nm. . 69
Table 3.5 Prediction of the gentiopicroside content in tissue culture and grown plants of
G. scabra Bunge by SMLR models in the wavelength of 400 to 1098 nm. ... 73
Table 4.1 Contents and distributions of the target constituents in Gentiana scabra
Bunge. ... 86
Table 4.2 The target constituents’ contents of effective samples, calibration set, and
validation set in Gentiana scabra Bunge. ... 87
Table 4.3 Prediction of the target constituents’ contents in Gentiana scabra Bunge by
ICA models. ... 98
Table 5.1 Regression results by ICA analyses for white rice. ... 115
CHAPTER 1. GENERAL INTRODUCTION
1.1 INTRODUCTION
Near infrared (NIR) spectroscopy, a nondestructive sensing method based on specific
absorptions within a given range of wavelength corresponding to the constituents in the
sample (McClure, 2003), has been widely applied for the evaluation of internal quality
of agricultural products (Davey et al., 2009; Lebot et al., 2011). Since NIR spectra of a
mixture is the linear summation of individual spectra of the constituents in the mixture,
such a mixture spectra thus can be regarded as ‘blind sources’ (Hyvärinen et al., 2001)
as the proportion of constituents in the samples remains unknown. Many attempts have
been made in recent years to extract critical features from the spectra using multivariate
analysis (Blanco and Villarroya, 2002; Burns and Ciurczak, 2008), including multiple
linear regression (MLR) (Chang et al., 1998), principal component regression (PCR)
(Wold, 1987), and partial least squares regression (PLSR) (Wold et al., 2001). However,
these methods were not designed for resolving the ‘blind source’ problem and may not
correlate well with the properties of constituents in the mixture, consequently hindering
the applicability of the spectra for chemometric analysis of the constituents
(Al-Mbaideen and Benaissa, 2011; Chen and Wang, 2001; Kaneko et al., 2008).
A multiuse statistical approach originally used to implement ‘blind source separation’
in signal processing (Herault and Jutten, 1986; Vittoz and Arreguit, 1989), independent
component analysis (ICA) is capable of disassembling the mixture signals of Gaussian
distribution into non-Gaussian independent constituents with only a little loss of
information and does not require any information to be added to the source (Comon,
1994). In practice, multiple ICA algorithms have been developed, including JADE
algorithm (joint approximate diagonalization of eigenmatrices) (Cardoso and
Souloumiac, 1993; Cardoso, 1999) and FastICA algorithm (Hyvärinen and Oja, 1997;
Hyvärinen, 1999), making ICA a high-speed and reliable tool (Hyvärinen and Oja, 2000)
for analytical chemistry (Lathauwer et al., 2000; Al-Mbaideen and Benaissa, 2011),
biomedical signal processing, telecommunications, econometrics, audio processing, and
image processing (Hyvärinen et al., 2001).
Application of ICA for spectrum analysis has been demonstrated by Chen and Wang
(2001) to separate the pure spectra of various constituents from the NIR spectra of the
mixture and to build qualitative relationship between the estimated independent
components and the constituents. Such a capability also enabled complete explanation of the constituents’ properties for NIR qualitative analyses (Westad and Kermit, 2003).
In addition, ICA was used to obtain statistically independent and chemically
interpretable latent variables (LVs) in multivariate regression (Gustafsson, 2005). It was
also noted that the number of independent components extracted from the spectra of
mixtures is related to the performance of ICA (Westad, 2005). Moreover, ICA was
employed to identify the infrared spectrum of mixtures containing two pure materials
(Hahn and Yoon, 2006) as well as the constituents in commercial gasoline (Pasadakis
and Kardamakis, 2006; Kardamakis et al., 2007). Equally noteworthy is that the
calibration model built through MLR, after using ICA to extract independent
components of aqueous solutions, gave good predictability (Kaneko et al., 2008),
whereas NIR estimation of sucrose concentration (Chuang et al., 2010) and glucose
concentration (Al-Mbaideen and Benaissa, 2011) were enhanced by using ICA.
While application of ICA for spectral analysis appears promising, available literature
still focuses mainly on chemical samples or non-natural products, such as (1)
identification of constituents in the mixture, especially for chemical compounds (Chen
and Wang, 2001; Hahn and Yoon, 2006; Pasadakis and Kardamakis, 2006; Kardamakis
et al., 2007; Liu et al., 2008; Kaneko et al., 2008; Al-Mbaideen and Benaissa, 2011); (2)
a preprocessing method for improving predictability of calibration model (Zou and
Zhao, 2006); and (3) combination of ICA and other multivariate analysis methods, such
as PCA-ICA (Pasadakis and Kardamakis, 2006), ICA-MLR (Kaneko et al., 2008; Liu et
al., 2009), ICA-PLS (Liu et al., 2009), ICA-LS-SVM (Wu et al., 2008) and ICA-NNR
(Fang and Lin, 2008) to deal with linear or nonlinear problems. However, no literature
exists by using ICA with NIR spectroscopy as the sole tool to quantify internal quality
or constituents of biomaterials without any other assisted multivariate analysis methods.
The applicability of ICA for quantitative inspection of biomaterials thus should be
evaluated and studied. In this dissertation, ICA was first applied as the sole tool in
conducting NIR quantitative analyses of biomaterials, including wax jambu fruit (see
CHAPTER 2), medicinal plant Gentiana scabra Bunge (see CHAPTER 3 and 4), and
milled white rice (see CHAPTER 5), to evaluate the applicability of this method.
Influence due to various types of sample (sucrose solution, intact fruit, dry powder of
Gentiana scabra Bunge, and cargo rice) was also studied.
1.1.1 WAX JAMBU
Wax jambu (Syzygium samarangense Merrill & Perry), an endemic fruit in Taiwan
and parts of southeast Asia has very unique surface and texture that are easily bruised or
damaged, hence requiring wax jambu to be handled delicately from harvest to shipping
and distribution. To date, several researches aimed to develop a non-invasive and rapid
detection method for the analysis of internal quality of wax jambu (You, 2002; Lin,
2002; Chung et al., 2004). For further applications of ICA with NIR spectroscopy in the
inspection of fruits, wax jambu is suitable to serve as an example for discussion. In the
present study, ICA was integrated with NIR spectral analysis to quantify the sugar
content in intact wax jambu. The results of wax jambu were also compared with those
of sucrose solutions –– mixtures of sucrose and de-ionized water. Spectral pretreatments
and linear regression were then used to build spectral calibration models of sugar
content. The analysis results of ICA were also compared with those of PLSR to assess
the abilities in predicting sugar content in wax jambu.
1.1.2 GENTIANA SCABRA BUNGE
Medicinal plants have always been considered an important and reliable source of
pharmacy, since they are rich in many bioactive components. The international trade
market for medicinal plant products continues to expand and covers food, beverages,
drugs, cosmetics, and skin care products. Gentiana scabra Bunge, a perennial
herbaceous plant, is mainly grown in temperate regions such as Taiwan, China, Japan,
South Korea, and Russia. Dried root and rootstock of Gentiana scabra Bunge are
commonly used as pharmaceutical raw materials, since they are rich in many
secoiridoid glycosides such as gentiopicroside, swertiamarin and sweroside (Kakuda et
al., 2001). In particular, gentiopicroside has been shown to protect liver, inhibit liver
dysfunction, and promote gastric acid secretion in addition to its antimicrobial and
anti-inflammatory effects, making it a popular ingredient in Chinese herbal medicine
and health products (Kim et al., 2009).
In early days, Gentiana scabra Bunge was mainly collected from the wild. As the
demand for Gentiana scabra Bunge increases, the wild resources diminish gradually,
thus restoration of Gentiana scabra Bunge became an important issue (Zhang et al.,
2010). Studies in recent years used tissue culture technology to cultivate of Gentiana
scabra Bunge (Cai et al., 2009), by domesticating the tissue culture of Gentiana scabra
Bunge, then transplanting it to the greenhouse for cultivation. In order to monitor the
change of Gentiana scabra Bunge during the growth process, it is necessary to measure
the bioactive components of Gentiana scabra Bunge. However, the commonly used
methods such as micellar electrokinetic capillary chromatography (MECC) (Glatz et al.,
2000), high performance liquid chromatography (HPLC) (Szücs et al., 2002; Kikuchi et
al., 2005; Carnat et al., 2005; Kušar et al., 2010; Hayta et al., 2011a; Hayta et al.,
2011b), liquid chromatography-mass spectrometry (LC-MS) (Aberham et al., 2007;
Aberham et al., 2011), and ultra-performance liquid chromatography (UPLC)
(Nastasijević et al., 2012) are all time-consuming and energy-intense, hence cannot be
applicable for daily quality inspection of Gentiana scabra Bunge during cultivation.
NIR spectroscopy has been widely used in dispensation, such as herbal component
analysis of Chinese herbal plants Angelicae gigantis Radix (Woo et al., 2005), Rhubarb
(Zhang and Tang, 2005), licorice (Glycyrrhizia uralensis Fisch,) (Wang et al., 2007),
Panax Species (Chen et al., 2011), and Lonicera japonica (Wu et al., 2012), as well as
the content detection of active pharmaceutical ingredients (APIs) in tablets (Paris et al.,
2006; Jamrógiewicz, 2012; Porfire et al., 2012). However, it has not been employed to
qualitatively monitor the growth of Gentiana scabra Bunge. In recent years, ICA has
been used in medicinal tests (Fang and Lin, 2008; Wang et al., 2009; Shao et al., 2009).
Considering there hasn’t been any study applying NIR spectroscopy in inspection on
internal components of Gentiana scabra Bunge currently, it is the intent of this study to
apply ICA, which could analyze various components simultaneously, in NIR
spectroscopy analysis on gentiopicroside and swertiamarin to discuss qualitative and
quantitative relationships of the two bioactive components. Efforts were also made to
build spectral calibration models with high predictability in order to evaluate the
potentiality of NIR for quality inspection on Gentiana scabra Bunge.
1.1.3 RICE
Rice is one of the most important and popular food crops in the world, and freshness
of rice depends on the storage conditions such as storage time, storage temperature, and
relative humidity. Among them, the storage time of rice has an enormous effect on its
appearance, flavor, and quality of the nutrients (Zhou et al., 2002). Previous studies
demonstrated that most lipids in rice hydrolyze into free fatty acids and cause the acidity
of rice to increase with prolonged storage (Takano, 1989; Hu, 2011; Chen et al., 2011).
Therefore, the determination of rice freshness is one of the main goals in site
examination. There is a strong need to develop a non-invasive, rapid detection method
for the analysis of freshness. Therefore, the objective of the current study was to inspect
rice freshness in terms of qualitative and quantitative approaches using NIR
spectroscopy. Rice freshness was expressed by both pH value and fat acidity. The pH
values were determined by bromothymol blue - methyl red (BTB-MR) method (Hsu
and Song, 1988) and fat acidity by AACC International method 02-02.02 (AACC
International, 2000). By means of a calibration curve, a relationship between pH and fat
acidity was established. ICA was subsequently integrated with NIR spectral analysis to
quantify the pH in rice. Linear regression was then used to build spectral calibration
models of pH value.
1.2 GENERAL OBJECTIVE
The objective of the dissertation was to apply ICA as the sole tool in conducting NIR
quantitative analyses of biomaterials, including wax jambu fruit, medicinal plant
Gentiana scabra Bunge, and milled white rice, to evaluate its applicability. Influence
due to various types of sample (sucrose solution, intact fruit, dry powder of Gentiana
scabra Bunge, and cargo rice) was also studied in the dissertation.
1.3 DISSERTATION ORGANIZATION
The dissertation is written in the alternative format. The “GENERAL INTRODUCTION” section is followed by chapters containing manuscripts of four
research papers: (1) Integration of independent component analysis with near infrared
spectroscopy for rapid quantification of sugar content in wax jambu (Syzygium
samarangense Merrill & Perry), (2) Quantification of bioactive gentiopicroside in a
medicinal plant Gentiana scabra Bunge using near infrared spectroscopy, (3)
Integration of independent component analysis with near infrared spectroscopy for
analysis of bioactive components in a medicinal plant Gentiana scabra Bunge, and (4)
Integration of independent component analysis with near infrared spectroscopy for
evaluation of rice freshness. These are followed by “GENERAL CONCLUSIONS”
section.
CHAPTER 2. INTEGRATION OF INDEPENDENT COMPONENT ANALYSIS WITH NEAR INFRARED SPECTROSCOPY FOR RAPID QUANTIFICATION OF SUGAR CONTENT IN WAX JAMBU 2.1 INTRODUCTION
Near infrared (NIR) spectroscopy, a nondestructive inspection method based on
specific absorptions within a given range of wavelength corresponding to the
constituents in the sample (McClure, 2003), has been widely applied for the evaluation
of internal quality of agricultural products (Davey et al., 2009; Lebot et al., 2011). Since
NIR spectra of a mixture is the linear summation of individual spectra of the constituents in the mixture, such a mixture spectra thus can be regarded as ‘blind
sources’ (Hyvärinen et al., 2001) as the proportion of constituents in the samples
remains unknown. Many attempts have been made in recent years to extract critical
features from the spectra using multivariate analysis (Blanco and Villarroya, 2002;
Burns and Ciurczak, 2008), including multiple linear regression (MLR) (Chang et al.,
1998), principal component regression (PCR) (Wold, 1987), and partial least squares
regression (PLSR) (Wold et al., 2001). However, these methods were not designed for resolving the ‘blind source’ problem and may not correlate well with the properties of
constituents in the mixture, consequently hindering the applicability of the spectra for
chemometric analysis of the constituents (Al-Mbaideen and Benaissa, 2011; Chen and
Wang, 2001; Kaneko et al., 2008).
A multiuse statistical approach originally used to implement ‘blind source separation’
in signal processing (Herault and Jutten, 1986; Vittoz and Arreguit, 1989), independent
component analysis (ICA) is capable of disassembling the mixture signals of Gaussian
distribution into non-Gaussian independent constituents with only a little loss of
information and does not require any information to be added to the source (Comon,
1994). In practice, multiple ICA algorithms have been developed, including JADE
algorithm (joint approximate diagonalization of eigenmatrices) (Cardoso and
Souloumiac, 1993; Cardoso, 1999) and FastICA algorithm (Hyvärinen and Oja, 1997;
Hyvärinen, 1999), making ICA a high-speed and reliable tool (Hyvärinen and Oja, 2000)
for analytical chemistry (Lathauwer et al., 2000; Al-Mbaideen and Benaissa, 2011),
biomedical signal processing, telecommunications, econometrics, audio processing, and
image processing (Hyvärinen et al., 2001).
Application of ICA for spectrum analysis has been demonstrated by Chen and Wang
(2001) to separate the pure spectra of various constituents from the NIR spectra of the
mixture and to build relationship between the estimated independent components and
the constituents. Such a capability also enabled complete explanation of the constituents’ properties for NIR qualitative analyses (Westad and Kermit, 2003). In
addition, ICA was used to obtain statistically independent and chemically interpretable
latent variables (LVs) in multivariate regression (Gustafsson, 2005). It was also noted
that the number of independent components extracted from the spectra of mixtures is
related to the performance of ICA (Westad, 2005). Moreover, ICA was employed to
identify the infrared spectrum of mixtures containing two pure materials (Hahn and
Yoon, 2006) as well as the constituents in commercial gasoline (Pasadakis and
Kardamakis, 2006; Kardamakis et al., 2007). Equally noteworthy is that the calibration
model built through MLR, after using ICA to extract independent components of
aqueous solutions, gave good predictability (Kaneko et al., 2008), whereas NIR
estimation of sucrose concentration (Chuang et al., 2010) and glucose concentration
(Al-Mbaideen and Benaissa, 2011) were enhanced by using ICA.
While application of ICA for spectral analysis appeared promising, available
literatures still focused mainly on (1) identification of constituents in the mixture,
especially for chemical compounds (Chen and Wang, 2001; Hahn and Yoon, 2006;
Pasadakis and Kardamakis, 2006; Kardamakis et al., 2007; Liu et al., 2008; Kaneko et
al., 2008; Al-Mbaideen and Benaissa, 2011); (2) a preprocessing method for improving
predictability of calibration model (Zou and Zhao, 2006); and (3) combination of ICA
and other multivariate analysis methods, such as PCA-ICA (Pasadakis and Kardamakis,
2006), ICA-MLR (Kaneko et al., 2008; Liu et al., 2009), ICA-PLS (Liu et al., 2009),
ICA-LS-SVM (Wu et al., 2008) and ICA-NNR (Fang and Lin, 2008) to deal with linear
or nonlinear problems. However, no literature exists for ICA with NIR spectroscopy to
be applied as the sole tool to quantify internal quality of intact fruit without any other
multivariate analysis methods. Wax jambu (Syzygium samarangense Merrill & Perry),
an endemic fruit in Taiwan and parts of southeast Asia (Fig. 2.1) has very unique surface
and texture that are easily bruised or damaged, hence requiring wax jambu to be
handled delicately from harvest to shipping and distribution. To date, several researches
aimed to develop a non-invasive and rapid detection method for the analysis of internal
quality of wax jambu (You, 2002; Lin, 2002; Chung et al., 2004). For further
applications of ICA as the sole tool with NIR spectroscopy in the inspection of fruits,
wax jambu is suitable to serve as sample for discussion. In the present study, ICA was
integrated for NIR spectral analysis to quantify the sugar content in intact wax jambu.
The results of wax jambu were also compared with those of sucrose solutions. Spectral
pretreatments and linear regression were then used to build spectral calibration models
of sugar content. The analysis results of ICA were also compared with those of PLSR to
assess the abilities in predicting sugar content in wax jambu.
2.2 MATERIALS AND METHODS
2.2.1 SAMPLE PREPARATION
Sucrose (C12H22O11, FW: 342.30) powder was solubilized in de-ionized water to
prepare 78 sucrose solutions with sugar content ranging from 0.4 to 19.0 °Brix. The
average sugar content was 9.83 °Brix, and the standard deviation was 5.48 °Brix. A total
of 114 wax jambu (S. samarangense Merrill & Perry) samples purchased from Fangliao,
Pingtung County in Taiwan were employed for the study. Before measuring the sugar
content, wax jambu was first pressed to extract 15 mL juice which was centrifuged for
15 min at 2500 rpm and 22°C to clarify the sample in centrifuge KUBOTA 2700
(KUBOTA Corporation Co., Ltd., Osaka City, Osaka, Japan).
2.2.2 NIR SPECTRA AND SUGAR CONTENT MEASUREMENT
A NIRS 6500 spectrophotometer and sample transport (FOSS NIRSystems, Laurel,
MD, U.S.A.) with quartz cuvette were used to measure the transmittance spectra of
sucrose solutions. The wavelength ranged from 400 to 2498 nm with 2 nm intervals.
The quartz cuvette (light path: 1 mm; external dimensions: length = 3.0 cm, width = 0.2
cm, and height = 3.5 cm) was filled with sucrose solution for transmittance
measurements. An on-line NIRS 6500 spectrophotometer (FOSS NIRSystems, Laurel,
MD, U.S.A.) was used to measure the reflectance spectra of the wax jambu samples.
The wavelength range was from 400 to 2498 nm and the interval was 2 nm. As shown
in Fig. 2.1(A), the wax jambu was examined to find an area with no defects, which was
then selected as the location for reflectance measurements. The wax jambu was placed
horizontally in line with the spectrophotometer in a dark compartment, and the distance
between the light source and the top of sample was adjusted to the suggested value of
7.62 cm, as shown in Fig. 2.1(B). The spectrophotometer was controlled by a personal
computer to perform NIR acquisition and spectrum editing. All spectral data were
recorded as the logarithm of reciprocal of reflectance (log 1/R), and NIR spectrum of
each sample was the average of 32 scans. A digital refractometer (PR-101, ATAGO Co.,
Ltd., Itabashi-ku, Tokyo, Japan) was used to measure the sugar content as the reference values. The index ‘°Brix’ used for PR-101 refractometer is a parameter that denotes the
total amount of soluble solids in the sample. For fruits such as wax jambu, most of
soluble solids in the juice are sugars, mainly sucrose, fructose and glucose. Therefore,
the value of °Brix measured from wax jambu can be regarded as the total sugar content.
Fig. 2.1 A wax jambu (Syzygium samarangense Merrill & Perry) sample (A) side view
and the NIR measurement location, and (B) sample placement with suggested
distance 7.62 cm between the light source and the top of sample in the on-line
NIRS 6500 spectrophotometer.
2.2.3 DATA ANALYSIS
2.2.3.1 INDEPENDENT COMPONENT ANALYSIS (ICA)
Independent component analysis (ICA) is a method used to transform the observed
multivariate data to statistically independent components (ICs) and to present them as a
linear combination of observation variables. The number of receptors defined by ICA
algorithm must be more than or equal to the number of sources, and the signals emitted
by the sources are in non-Gaussian distribution (Hyvärinen and Oja, 2000). The ICs are
latent variables; therefore, they cannot be directly observed, indicating that the mixing
matrix is also unknown. The purpose of the ICA algorithm is to determine the mixing
matrix (M) or the separating matrix (W). In order to predict the unknown source, it is
assumed that W = M-1,
ŝ = Wx = M-1Ms (2.1)
where ŝ is the estimation of the sources (s) and x represents the observed spectra of
the objects.
In the present study JADE (joint approximate diagonalization of eigenmatrices)
algorithm (Cardoso and Souloumiac, 1993; Cardoso, 1999) was employed to conduct
ICA analysis. In general, JADE offers rapid performance for dealing with spectra data
due to it works off-the-shelf, an improvement over other multivariate approaches like
PCR and PLSR. Assuming that the spectra obtained through measurement of the unknown mixtures were the linear combination of various components’ spectra, it can
be expressed as:
A = MI (2.2)
The spectra of samples were all linearly composed of m ICs. Matrix Al×n stands for l
samples containing n values; Im×n stands for the matrix of ICs, including m independent
components. Ml×m stands for the mixing matrix, which is related to the component
concentration in the mixture. The linear relationship between the mixing matrix (M) and
the component concentration (C) can be expressed as:
C = MB (2.3)
Among them, B referred to the matrix of regression coefficient. In doing so, the
concentration of each component in the mixture could be determined by the
combination of ICA and linear regression.
2.2.3.2 PARTIAL LEAST SQUARES REGRESSION (PLSR)
Partial least squares regression (PLSR), a typical method in chemometrics (Wold et
al., 2001), has been widely applied to chemical and engineering fields. When PLSR is
applied to spectral analysis, the spectra can be regarded as the composition of several principal components (PCs), and be expressed as a ‘factor’ in the PLSR algorithm. The
factors’ sequence is determined by their influences; the more important factor is ranked
earlier in the order, such as factor 1 and factor 2. Since information from spectral bands
was used in PLSR analysis, the analysis results can be improved by selecting
appropriate number of factors and specific wavelength ranges. To avoid overfitting of the PLSR model’s results with too many factors, the factors were selected based on the
following principles in this study: (1) A maximum factor limit was set at 1/10 of
calibration set data + 2 to 3 factors; (2) new factors were not added if they caused a rise
in the prediction error; and (3) new factors were not added if they resulted in a standard
error of validation (SEV) smaller than the standard error of calibration (SEC).
2.2.3.3 SPECTRAL PRETREATMENTS
The purpose of spectral pretreatments was to eliminate the spectral variation, which
was not caused by chemical information contained in the samples (de Noord, 1994). For
the raw NIR spectra of sucrose solutions and wax jambu, three different spectral
pretreatments were employed in this study: (1) normalization; (2) 1st derivative with
normalization; and (3) 2nd derivative with normalization. Normalization scaled the
spectrum absorbance of all samples to fall within an interval of -1 to 1. For further
applications of ICA in fast on-line inspection of fruits, the procedure of selecting best
pretreatment parameters, including points of smoothing and gap of derivative, were not
employed to save computational time. The gap of derivative was set at a minimal value
of 2, so as to maintain the most wavelength values as inputs for the model.
2.2.3.4 MODEL ESTABLISHMENT
This study used the mathematic software MATLAB (The MathWorks, Inc., Natick,
MA, U.S.A.) to write ICA programs based on JADE algorithm for establishing ICA
spectral calibration models. The results of ICA were compared with the spectral
calibration models of PLSR built by WinISI II (Infrasoft International, LLC., Port
Matilda, PA, U.S.A.) chemometric software package. The analysis procedure of both
ICA and PLSR for wax jambu and sucrose solution samples included: (1) selecting
calibration set and validation set, (2) spectral pretreatments, and (3) determining best
calibration model. Since the sucrose solutions were mixtures of sucrose powder and
water, their composition were rather simple. Therefore, the data of full wavelength
range (400 to 2498 nm) were used for comparing the tolerance abilities of ICA and
PLSR since spectral bands with more noises (e.g. 2200 to 2498 nm) often affect the
analysis results. Identification of specific wavelength ranges was needed for wax jambu
because their composition was more complicated than that in sucrose solutions, which
required additional correlation analysis between wavelengths and sugar content. All of
the sucrose solutions and wax jambu samples were respectively used for analysis to
assess the tolerance abilities of ICA and PLSR. A ratio of calibration to validation
samples of 2:1 was adopted according to the sugar content in the sample. All samples
were ranked ascendantly according to their sugar content. Number 1 and 2 were
assigned for calibration and 3 for validation, with subsequent numbers following the
same alternating sequence. The same sets of calibration and validation were used for
both ICA and PLSR analyses.
After the respective spectral calibration models of sucrose solution and wax jambu
were built, these models were then used to predict the sugar contents of the calibration
and the validation set. The evaluation of predictability was based on the following
statistical parameters, including coefficient of correlation of calibration set (Rc),
standard error of calibration (SEC), coefficient of correlation of validation set (rv),
standard error of validation (SEV), bias, and ratio of [standard error of] performance to
[standard] deviation (RPD), as defined by:
1 21
1 2
SEC
nc
i
i c
Yc
n Yr (2.4)
1 21
Bias 2
SEV 1
nv
i
i v
Yv
n Yr (2.5)
nv
i
i v
Yv n 1 Yr
Bias 1 (2.6)
RPD = SD/SEV (2.7)
where Yc and Yv represent the estimated sugar contents of the calibration set and the
validation set, respectively. Yr is the reference sugar content, nc and nv are the number of
samples in the calibration set and validation set, and SD is the standard deviation of
sugar content within the validation set. RPD is one of the indices used to evaluate the
performance of a model. The greater the value of RPD is considered adequate for
analytical purposes in most of NIR spectroscopy applications for agricultural products
(Williams and Sobering, 1993).
2.3 RESULTS AND DISCUSSION
2.3.1 SUCROSE SOLUTION
The 78 sucrose solution samples were divided into 52 calibration samples and 26
validation samples with a ratio of 2:1. The distribution of their sugar content (°Brix) is
shown in Table 2.1. For all the samples within the calibration and validation sets, the
difference between maximum values of two sets was 0.2 °Brix; the differences for other
items including minimum, average, standard deviation, and coefficient of variation
(CV), were all smaller than 0.5 °Brix. The above sets of samples were conforming to the
consistent requirement of sugar content distributions.
Table 2.1 Summary of sucrose solutions and sample sugar contents. Total samples (n =
78), calibration set (n = 52) and validation set (n = 26) were arranged to have
consistent distributions of sugar content.
Sucrose Solutions
Group n
Sugar Content (°Brix)
Max. Min. Mean SD CV
Total Samples 78 19.00 0.40 9.83 5.48 0.56
Calibration Set 52 19.00 0.40 9.72 5.52 0.57
Validation Set 26 18.80 0.90 10.06 5.52 0.55
2.3.1.1 SELECTION OF THE MOST APPROPRIATE NUMBER OF ICS
According to the definition of ICA, the observed receptor signals can be decomposed
at most into a number of ICs (independent components) equal to the number of samples
(Hyvärinen and Oja, 2000). This study used the data of full range of wavelength (400 to
2498 nm) as the inputs of ICA, conducted ICA for the original spectra of 52 calibration
samples of sucrose solution by selecting 1 to 52 ICs, and observed the prediction error
by using the calibration model. Both situations with and without normalization were
examined. When only one IC applied, the prediction error was high, so the results were
only shown by applying 2 to 50 ICs. As shown in Fig. 2.2, when the number of ICs
increased to 4, SEC of the case without normalization sharply decreased to 0.14 °Brix,
and SEV fell to 0.21 °Brix, indicating that different numbers of ICs can influence the
predictability of the spectral calibration model. However, application of more ICs did
not necessarily help improve the ability of the calibration model because the sucrose
solutions were mixtures of sucrose and water, hence only the initial 4 ICs were applied
in the calibration model.
The results of ICA with normalized spectra can be observed in Fig. 2.2. The
prediction error greatly reduced as the number of ICs increased to 7; the SEC and SEV
with 7 ICs were 0.12 and 0.22 °Brix, respectively. Normalization apparently gave less
variations of SEV compared with that of original spectra.
Fig. 2.2 Relationship between the numbers of ICs and errors of the predicted sugar
content for sucrose solutions. The most appropriate number of ICs for
normalized spectra was determined by the tendency of SEC (green-short dash
line) and SEV (blue-dash dot dot line) values.
2.3.1.2 SPECTRA DECOMPOSITION AND CORRELATION ANALYSIS OF
SUGAR CONTENT
Based on ICA analysis it is critical to examine whether these 7 ICs were statistically
independent. To illustrate the operation, IC 1 and 4 were selected and their correlation
was shown in Fig. 2.3, with the coefficient of determination (r2) being only 4.0 x 10⁻⁸.
This indicated that IC 1 and 4 were independent of each other. Diagrams of every two
ICs among the 7 ICs also showed a similar distribution to that in Fig. 2.3, with all of the
r2 smaller than 0.243, conforming to the mutually independent characteristics of ICs
(Hyvärinen and Oja, 2000).
Fig. 2.3 Distribution of calibration and validation samples of sucrose solutions in IC
1-IC 4 space. IC 1 and IC 4 were randomly selected from the 7 ICs.
Eq. 2.5 shows that the constituent information ‘sugar content’ should mainly
correspond to a specific IC, and there should be a high correlation between the values of
the IC in the mixing matrix and the sugar content. So a diagram was made with the
reference sugar content and the values of each column (each IC) in the mixing matrix.
As shown in Fig. 2.4, the correlation coefficient (r) between IC 1 and the reference
sugar content could reach 0.977, which meant that with 7 ICs extracted, the IC 1 among
all 7 ICs could reveal the most information resulted from the sugar content in the
spectra. The results were in agreement with Westad (2005). Therefore, selection of the
numbers of ICs is important since it influences how the information is used after spectra
decomposition.
Fig. 2.4 Correlation between the values of IC 1 in the mixing matrix and the reference
sugar contents of sucrose solutions.
The regression coefficient matrix by the NIR spectra and the reference sugar content
of calibration sets was shown in Table 2.2, and the values from the top to the bottom
referred to IC 1 to 7. All values were compared in terms of absolute values. It was found
that the value of the first row (IC 1) was the largest, closely followed by the value of IC
4. The results agreed with the order of correlation between each IC and the reference
sugar content, and indicated that the importance of each IC was independent of the IC
sequence. Each major constituent had its corresponding IC decomposed by ICA, in
which IC contribution was clearly defined, so that all constituents of the mixtures could
be distinguished by ICA (Chen and Wang, 2001; Hahn and Yoon, 2006; Pasadakis and
Kardamakis, 2006; Kardamakis et al., 2007; Kaneko et al., 2008).
Table 2.2 Regression coefficient matrix of sucrose solutions with 7 ICs were extracted
from the NIR spectra of calibration sets. Correlation between the absolute
value of each IC in regression coefficient matrix and sugar content was
examined.
IC # Regression Coefficient
1 -2.1811
2 -0.2843
3 -0.1843
4 1.2976
5 0.1876
6 -0.1334
7 -0.1416
The ICs, decomposed from the spectra by ICA, reflected the spectral characteristics of the unknown mixture and constituted the pure materials’ spectra of this mixture under
an ideal state (Chen and Wang, 2001; Hahn and Yoon, 2006; Pasadakis and Kardamakis,
2006; Kardamakis et al., 2007). Since the sucrose solutions were mixtures of sucrose
and water, and the spectra was comprised of both constituents, the ICs decomposed by
ICA should reflect the characteristics of these two pure substances. For the original
spectra of the normalized calibration set, among the 7 ICs applied for ICA, the order of
the 7 ICs, according to the correlation with reference sugar content, was IC 1, 4, 2, 5, 3,
7, and 6. The NIR original spectra of the calibration set and IC 1 were shown in Fig.
2.5(A) and (B), and the reflectance spectrum of sucrose powder post-Detrend was
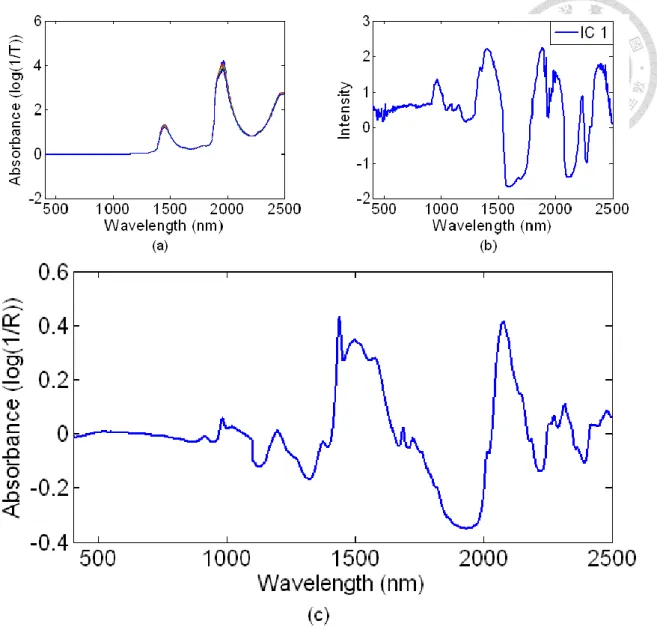
shown in Fig. 2.5(C). The peak positions of IC 1 (964, 1090, 1436, 2100, and 2276 nm)
matched the specific wavelength ranges of sugar content (C-H band) (Chang et al., 1998;
Park, 2003; Hahn and Yoon, 2006), which was also consistent with the absorption bands
seen in Fig. 2.5(C). So IC 1 can be considered to respond mainly to the sugar content,
conforming to the above results. The other ICs had poor correlation with reference sugar
content, and the absolute values in the regression coefficient matrix were much smaller
than that of IC 1, so they exerted an assisting function.
Fig. 2.5 (A) Original NIR spectra of sucrose solutions, (B) IC 1 decomposed from
calibration sets, and (C) the reflectance spectrum of sucrose powder
post-Detrend.
2.3.1.3 SUGAR CONTENT QUANTIFICATION BASED ON ICA AND PLSR
Quantitative analyses of sugar content in sucrose solutions were conducted by ICA
and PLSR using the full range of wavelength from 400 to 2498 nm. The results of
best spectral calibration model was the original spectra normalized, with 7 ICs applied.
The results were Rc = 0.9998, SEC = 0.124 °Brix, rv = 0.9993, SEV = 0.216 °Brix, bias
= 0.014 °Brix, and RPD = 25.54. A comparison was made in light of the result of the
original spectra with and without normalization, and it was found that the calibration
model yielded similar outcomes in the validation sets, whereas the SEC value was
improved when normalization was applied. Although derivatives can improve baseline
shift of the original spectra and amplify the signal characteristics, noise interference
may also be enhanced at the same time, making it unsuitable for spectral bands with
much noises. The spectrum in the range of 2200 to 2498 nm contained more noises;
therefore, the predictability of the spectral calibration models would decrease as
derivatives were attempted.
Table 2.3 Regression results by ICA and PLSR analyses for sucrose solutions.
Method Spectrum
ICs /
Factors
Calibration Set (52) Validation Set (26)
Mean: 9.715, SD: 5.515 Mean: 10.058, SD: 5.515
Rc
SEC
(°Brix)
RSEC
(%)
rv
SEV
(°Brix)
RSEV
(%)
bias
(°Brix)
RPD
ICA
Original 4 0.9997 0.144 6.97 0.9995 0.215 3.57 0.045 25.69
Original + Normalization 7 0.9998 0.124 4.01 0.9993 0.216 3.68 0.014 25.54
1st Derivative + Normalization 4 0.9994 0.193 13.71 0.9984 0.331 10.34 0.028 16.66
2nd Derivative + Normalization 5 0.9983 0.321 19.66 0.9973 0.409 16.20 -0.014 13.48
PLSR
Original 2 0.9995 0.181 11.41 0.9985 0.300 8.78 0.069 18.38
Original + Normalization 4 0.9990 0.218 11.59 0.9975 0.399 8.68 0.022 13.82
1st Derivative + Normalization 3 0.9995 0.192 11.50 0.9950 0.546 12.92 0.031 10.10
2nd Derivative + Normalization 2 0.9990 0.243 20.96 0.9869 0.899 34.99 0.013 6.14
The results of spectral calibration models built by PLSR indicated that the best
spectral calibration model was acquired when the original spectra and 2 factors were
employed, and the results were as follows: Rc = 0.9995, SEC = 0.181 °Brix, rv = 0.9985,
SEV = 0.300 °Brix, bias = 0.069 °Brix, and RPD = 18.38 (Table 2.3). Moreover, with
the SEC = 0.192 °Brix and the SEV = 0.546 °Brix for the 1st derivative with
normalization, and the SEC = 0.243 °Brix and the SEV = 0.899 °Brix for the 2nd
derivative with normalization, it is apparent that the SEV values of both 1st and 2nd
derivatives were many times higher than SEC. The results showed that the PLSR
spectral calibration models had poor predictability when applied to validation sets.
Comparing the quantitative analysis results of ICA and PLSR, all ICA spectral
calibration models had better ability than PLSR in predicting calibration and validation
sets. This means that ICA extracts the characteristic information from the spectra more
effectively, not only improving the expository ability of calibration models for the
calibration sets, but also increasing the tolerance for the validation sets. Results also
showed that ICA was preferable to PLSR due to much lower bias (Table 2.3). This
finding became more obvious with normalization, indicating that ICA had a better
tolerance to the influences caused by factors other than chemical characteristics of the
constituents in the samples, which helped to build more robust spectral calibration
models. In summary for the sucrose solutions, ICA achieved better quantitative analysis
of sugar content than PLSR did, while selecting a suitable number of ICs and spectral
pretreatments could help improve the predictability of spectral calibration models. The
results of sucrose solutions also helped establish proper procedures with useful
information applicable when conducting ICA analysis of wax jambu.
2.3.2 WAX JAMBU
Wax jambu samples totaling 114 were used; their sugar contents ranged from 6.4 to
14.5 °Brix. The average sugar content was 9.92 °Brix with the standard deviation of
1.61 °Brix. All the samples were divided in a 2:1 ratio into 76 and 38 calibration and
validation samples (Table 2.4).
Table 2.4 Summary of wax jambu (Syzygium samarangense Merrill & Perry) and
sample sugar contents. Total samples (n = 114), calibration set (n = 76) and
validation set (n = 38) were arranged to have consistent distributions of
sugar content.
Wax Jambu
Group n
Sugar Content (°Brix)
Max. Min. Mean SD CV
Total Samples 114 14.50 6.40 9.92 1.61 0.16
Calibration Set 76 14.50 6.40 9.89 1.61 0.16
Validation Set 38 14.00 7.10 9.99 1.62 0.16
2.3.2.1 CORRELATION ANALYSIS OF NIR SPECTRA AND SUGAR
CONTENT
Fig. 2.6 showed the distribution of the correlation coefficients for the original, the 1st
derivative and the 2nd derivative spectra of the wax jambu samples and their sugar
contents. The main absorption wavelengths of the original spectra were 676, 968, and
1144 nm, of which 676 nm was located within the visible region of red light, whereas
968 and 1144 nm in the NIR region, belonging to the 2nd overtone of the C-H bond. The
main absorption wavelengths of the 1st derivative spectra were 626, 974, 1070, and