行政院國家科學委員會專題研究計畫 成果報告
資訊空間中自主性虛擬人的行為模擬 研究成果報告(精簡版)
計 畫 類 別 : 個別型
計 畫 編 號 : NSC 97-2221-E-011-113-
執 行 期 間 : 97 年 08 月 01 日至 98 年 07 月 31 日 執 行 單 位 : 國立臺灣科技大學建築系
計 畫 主 持 人 : 施宣光
計畫參與人員: 碩士班研究生-兼任助理人員:賴宛吟 碩士班研究生-兼任助理人員:賴昱臣 碩士班研究生-兼任助理人員:胡善晴 碩士班研究生-兼任助理人員:楊紹遠 碩士班研究生-兼任助理人員:巫明璋 碩士班研究生-兼任助理人員:陳逸倩 博士班研究生-兼任助理人員:陳威光
報 告 附 件 : 出席國際會議研究心得報告及發表論文
處 理 方 式 : 本計畫可公開查詢
中 華 民 國 98 年 10 月 31 日
行政院國家科學委員會專題研究計畫 成果報告 資訊空間中自主性虛擬人的行為模擬
On the Behavioral Animation of Autonomous Virtual Human in Information Spaces
一、基本資料
計畫類別: 個別型計畫
計畫編號: 96WFA2500198
執行期間: 97 年08 月01 日至98 年07 月31 日
執行單位:國立台灣科技大學建築系
計畫主持人: 施宣光
計畫參與人員:賴宛吟、胡善晴、陳彥宏
報告類型: 精簡報告
處理方式: 本計畫可公開查詢
中 華 民 國 98 年 10 月 22 日
二、計畫中文摘要
資訊空間中自主性虛擬人的行為模擬
在虛擬世界中建立具有類似人類行為的自主性虛擬人物是一項嚴峻的挑戰。從電腦動畫、
電子遊戲乃至於避難疏散動線規畫、空間使用評估與自動化設計,自主性的虛擬人物可以作為諸 多領域中的應用的工具,也是引起廣泛興趣的研究課題。本計畫將利用本團隊96 年度對行人移 動模式之模擬的研究成果,從行人在空間中位置移動模式應用到虛擬人的建立,並延伸出空間中 更為多樣化的行為,如站立、群聚、坐、臥等與空間設施相關的舉止活動。本研究目的在建立虛 擬人物在充滿資訊之空間中行為模式的表示模型,特別強調空間資訊以及虛擬人內在狀態是決定 其行為模式的關鍵要素。
本研究基於以下的基本假設:
第一,空間中充滿多不勝數之影響行為的資訊與物理條件,然而多重的影響因子可以結合 成簡單的數學模型以描述影響行為的資訊在空間中的分布模式,表達成一種隨著時間轉變的空間 力場。虛擬人感應到力場的存在而作出回應。
第二,虛擬人的內在行為趨勢受到諸多因素交互作用的複雜影響。其總和的行為趨勢可以 用簡單的馬可夫程序機率模型描述而不失其宏觀下的真確性。此外,我們假設人群中個人的行為 差異分佈模式符合近年來複雜科學領域在研究過很多自然與人為現象後所提出之普適性的冪次 原則。本計畫的研究企圖以疊加多頻率噪音函數而形成的 Perlin noise,加入虛擬人的研究模型 中,藉著對噪音函數的頻率層級以及梯度來對所模擬的群眾對像以及空間內容加以調控,以達成 所需的模擬效果。
三、計畫英文摘要
On the Behavioral Animation of Autonomous Virtual Human in Information Spaces
Making virtual human with human-like behavior is a difficult task. Virtual human may catch up a large spectrum of applications and research interest, from computer animation, games, to the simulation of building occupants evacuation and design evaluation. This research continues on the basis of our prior research for the simulation of pedestrian movement in information space. The scope of research extends to a broader range of space related behaviors. The objective of the research is to devise a representational model, emphasizing the modeling of information dissemination in the space, and the inner state description of the virtual human that may interact with the environment. The intension of the model is to reduce the complexity of the simulation as much as possible while retaining essential control for manipulation so that the virtual human can be used in virtual experiments.
The research is based on the following assumptions. First, there are far too many factors for us to model in the environment that may influence the behavior of virtual human. However, it is possible to combine related factors, and define as some simple mathematical functions that describe the dissemination pattern of spatial information. Therefore the complexity of the environment can be largely simplified. Second, the variations of behavior of virtual humans might be large, but from the macroscopic view, the complex inner states of a virtual human can be defined with some possibility models such as Markov process. In addition, the advances of research in complexity systems and fractals suggest that many natural or artificial systems do exhibit a pattern of self-similarity, which can be simulated by some functions defined with exponential sums. Perlin noise has been successfully used very broadly in animating natural and artificial phenomena. It is expected that with perlin noise, we can further simplify the construct of virtual human without losing their interesting parts of human-like behaviors.
Keywords: virtual human, behavioral animation
1. 前言:
在虛擬世界中建立具有類似人類行為的自主性虛擬人物是一項嚴峻的挑戰。從電腦動畫、
電子遊戲乃至於避難疏散動線規畫、空間使用評估與自動化設計,自主性的虛擬人物可以作為諸 多領域中的應用的工具,同時也是引起廣泛興趣的研究課題。
人在空間中的行為受到各種物理環境、空間資訊以及個人的認知與目的地的影響,其相關 因子極其繁多,相互關係錯綜複雜。資訊是形塑空間的元素,人對空間的感知乃是由各種感官所 接收到的光、音、熱與氣流等資訊傳播媒介的刺激而形成。除了空間中遍佈的光線、聲音、溫度、
氣流等等環境物理特性所構成的資訊之外,在都市中,隨處可見的招牌告示與廣告看板遮蔽了街 道的視野;騎樓底下的跑馬燈與商店櫥窗不斷地播送各式各樣的訊息,取代了建築物的正面與進 口意象;在家庭中,播送資訊的電視則成為客廳的中心。透過各種媒介傳播的資訊塑造出我們對 空間的認知,進而改變我們在空間中的行為模式。資訊空間在本研究中指的是描述空間的重點即 在於其間資訊的傳播模式,以資訊分佈來描述空間,而不特別強調對實質空間的幾何與物理特徵 作詳盡的描述。人在空間中的行為模式是基於其內在行為趨勢和其於所在位置接收到的資訊兩者 的交互影響而產生的結果。可以把空間中的虛擬人視為資訊處理單元,依據其內在狀態決定其回 應外在資訊的模式,從而展現出對應的行為序列。
建立虛擬人物作為研究與應用工具可以從下列三個層面加以探討。
第一,以虛擬人物作為實驗工具,探討其在各種不同的設定與情境下與真實人物的行為舉 止的差異與相似之處,以了解其內在狀態與外在環境中之相關因子與外在表徵行為之間的關聯 性。
第二,以虛擬人作為設計方案的設計以及評估工具,透過虛擬人的設置來模擬空間的使用 方式。
第三,從人工生命的觀點來看,不論虛擬人是否和真實人物有近似的行為模式,虛擬人物 本身就是有意義的研究課題。對虛擬人物的研究有助於了解生命的基本構成要素,在何種條件下 具有複雜行為的生命可以產生。
2. 研究範圍、目的與研究假設:
此計畫將利用本年度執行中的國科會研究計畫「資訊空間中行人移動模擬」的研究成果,
進一步探討、建立虛擬人物的演算模型。
研究範圍將從行人位置移動模式的模擬應用到虛擬人的建構上,並延伸出多樣化的行為,
如站立、群聚、坐、臥等與空間設施相關的舉止活動。研究範圍的重點將不在虛擬人動作的細部 特徵,而在於各單元動作之間的串聯模式的再現。例如當虛擬人身處某種特定內在狀態時其所展 現出之單元動作,如行走、徘徊、駐留、群聚、觀看、坐下等等將串結形成某種特定模式。
本研究的目的在建立虛擬人物在充滿資訊之空間中行為模式的表示模型,特別強調空間資 訊以及虛擬人內在狀態是決定其行為模式的關鍵要素。本計畫將以前期研究所建立之外部環境以 及內在狀態的表示模型為基礎,進一步擴充到人行動線之外的其他與空間設施相關的行為模式。
虛擬人物的演算模型將扮演虛擬世界到真實世界中的資訊橋樑。演算模型的包括資料結構以及相 關演算法的建立。資料結構將演算所需的資料從輸入端到輸出端作出合理而有效率的規畫與對應,
讓輸入資料一步一步在演算法的處理下推導出相對應的結果。本計畫欲提出能夠描述並再現此類 模式的運算模型,讓所模擬的虛擬人能夠在所處的物理環境中按照所賦予的內在狀態,而表現出 相對應的行為模式。透過對虛擬人與虛擬環境的操弄,研究人員能觀察其展現出的行為模式。
本研究基於以下兩項假設試圖建立一個簡單而有效的理論模型以描述虛擬人在資訊空間中 的行為模式。
假設一,為空間雖然充滿多不勝數之各類資訊與可能影響人之行為的物理條件,但其對其 間人物之總合效應可以用資訊散佈的模式加以敘述。在模擬系統中,我們不可能,也不需要鉅細 靡遺的建立所有可能影響到人物活動的空間細節,再一一釐清每一個細節可能對人群活動的影響。
例如當行人在複雜建築室內空間中欲走向樓梯時,會根據自身獨有的認知條件而決定其行為動向。
可能是根據室內空間裝修上的特徵,或者本身的對該空間的認知地圖,也可能是走廊上的標示,
或甚至跟隨其他行人而到達目的地。空間細節對行為的影響因素雖然眾多,但往往可以歸納成某 種簡單模式。本研究假設一將空間中每一項影響因子皆可簡化成描述空間資訊傳播模式的動態函 數以清楚呈現行人能正確的認知其目的地方向的機率。
假設二,個別行人的內在行為動機雖然複雜,但正如宏觀下群體的行為能用簡單的機率模 型描述而不失其真確性。好比在分析氣體在不同溫度與壓力條件下的行為模式時,並不需要計算 每一個分子的詳細動向即可用機率與統計成功的作出準確的描述模型,如果企圖根據個別行人的 內在狀態來模擬其行為模式往往陷入無法掌控的細節與其間之交互作用而無法釐清。因此本研究 將行人互異的行為動機視為某種機率分佈狀態,則有助於發展出簡化的模型來模擬複雜的群體行 為模式。透過可觀測之數據經過適當的分析來推估其機率分布模式,以機率與統計成功的作出準 確的描述模型。本計畫分上下年度二階段進行,上半年度已經根據所提出之理論模型完成雛型程 式並開始實際操作測試。行人移動模擬的部分已經完成牙醫診所蒐集行人動線資料並已嘗試取得 更能反映實際現象的馬可夫矩陣。下半年度計畫將蒐集校園空間行人動線資料進一步以較大的規 模測試程式與理論模型的可行性。基於上述的假設,我們認為本計畫的研究目標是可以達成的,
而其結果可以驗證前項假設是否可行,如果可行的話將對虛擬人物的建構有所貢獻。
3. 研究方法
計畫的執行過程將首先提出演算模型的構想,進行程式編寫後,在虛擬場景中進行實驗以 觀察虛擬人在場景中的行為模式。獲得初步結果後,透過實地的觀察資料的分析,利用分析結果 調整虛擬人的相關設定,以測試其是否能夠在類似的場景中再現實體世界中行人的行為模式。以 下分別就研究程序中主要研究架構分別說明。
3-1 虛擬人定義
本計畫針對空間中各種可能影響虛擬人行為的事物建立其資訊傳播的方式,而不以描述其 實體型像為主。本研究將人的複雜形態簡化為統一的虛擬角色,及虛擬人是所有人的綜合體。
在文獻中,多數行人模擬的研究以視覺資訊為主,重點為再現行人於其所處位置與方向,
視覺可及之資訊,據此判斷其可能之行為,例如以空間語法主導之大部分研究(Gibson,1984;
Hillier et al, 1993; Turner and Penn, 2002)。然而根據本研究的觀察,人在環境行為過程中視覺不 是唯一資訊來源,而每個人根據其背景知識與能力不同可以採取互異的策略取得適當的空間資訊 來導引其行為。針對這個問題,我們不認為鉅細靡遺的描述真實世界的物理情境,然後盡可能的 讓虛擬人與其互動是一種可行的研究方向。(Okazaki 1993)將空間中各個活動據點視為磁極,
而將其對行人可能產生的影響表示成為磁場,行人的移動模式則根據其與所在位置之磁場強度與 方向決定。下圖為(Courty 2007)使用群眾活動資訊擷取技術分析得的來的資訊,將其表達為影 響群眾活動的空間力場,再以之應用於人群移動模式的模擬。
圖 3-1 群眾活動資訊圖
本計畫將採用類似的方法將空間中影響行為的因子表達成空間力場,由一個從空間位置對 應到一個純量或者向量的函數所定義,而整個空間的資訊將是許多力場函數所成的集合。
3-2 實驗流程
計畫初期將應用上述架構建立電腦程式,電腦程式包括空間資訊傳播模組與虛擬人模組。
第二階段以電腦程式讓虛擬人以各種不同的設定模式,在不同的場景中測試,了解其間的交互作 用。第三階段進行實地觀測出真實空間中行人可能的移動型為機率,再以Kalman filter結合隱馬 可夫模型分析取得相關參數後匯入電腦程式,比對模擬的成果,藉此完成虛擬人演算模型的測試 檢討,並探討其後續開發應用的可能性。
圖 3-2 實驗階段圖
3-3 實驗之「行人內在行為趨勢的表示模型」
本研究經修正後用多重的馬可夫轉換矩陣來描述虛擬人在某一個特定模式下的行為趨勢,
而以多個或者一個可以依時間參數而產生馬可夫轉換矩陣的函數來描述更長時段的行人群體行 為趨勢。
馬可夫鏈(markov chain)是一種具備馬可夫性質(markov property)的不確定離散時間程 序(discrete-time stochastic process)。所謂的馬可夫性質指的是系統在下一個時刻的可能狀態完 全依據目前狀態而定,不必回溯到更早的時刻。在不確定的程序中,系統的狀態可能在接續步驟 中維持原先狀態也可能發生變化,而馬可夫鏈可以用來描述系統在接續步驟中各種狀態的變化程
第一階段:程式編寫
•理論模型之建構
•程式編寫
•觀察空間場景:醫院診所空間使用情形
第二階段:虛擬人模擬
•測試不同模式
•修正理論模型與程式
第三階段:實驗驗證階段
•觀察記錄: 校園空間
•實驗一:多重空間(建築系RB 8F 整層)
•實驗二:單一空間 (建築系辦梯廳)
研究結果與研究未來之發展性
序,並用以預測在足夠時間的轉換後,系統最後呈現的狀態。馬可夫轉換矩陣描述系統從一個狀 態在下個時刻轉換成其他狀態的機率。以醫院空間為例,馬可夫轉換矩陣可以描述在掛號處的行 人在下個時刻產生移動到他處(例如候診室或領藥處)的行動趨勢之機率。
本計畫將結合Perlin noise的演算法,加入上述由馬可夫鍊與空間資訊傳播模型中,以創造 空間中虛擬人的動態模擬。應用的面向包括虛擬人的動作與行為趨勢,以及空間資訊的傳播模 式。
3-4 實驗驗證階段
本計畫之驗證階段將分兩實驗進行,兩次實驗皆從監控攝影機的資料紀錄空間節點在固定 時段中的人數,來取代行人移動路徑的追蹤,如果各空間節點人數呈現穩定狀態時,就可以經由 馬可夫轉換矩陣之固有值與固有向量反向計算出矩陣內部的數值,也就是描述該時段中行人移動 趨勢的機率模型。
實驗方法是根據是每一個進行模擬的空間節點都應該可以互相連通的概念,因此描述該空 間中行人移動趨勢的馬可夫鏈應是屬於所謂的Ergodic Markov Chain,意指系統的任一狀態都有 可能在經過一或多次轉換後到達所有其他的狀態。我們也可以把行人絕不會到達的空間節點排除 在模擬之外而不會造成任何的遺憾。 Ergodic Markov Chain的一個重要特性就是這個系統最後一 定可以導致均衡的機率分布模式。而從這個最後的機率分布模式可以反推分析未知的馬可夫轉換 矩陣。
3-4-1實驗一:都市空間行人活動
實驗地點:台北火車站、高鐵車站與捷運地下街 實驗方法:放聲思考口語分析
1. 行人行為跟拍與放聲思考口語分析
為了驗證本研究描述行人行為模式的表是模型,使用了行人跟拍與放聲思考口語分析,
針對在都市空間中行走的受試者進行分析。台北火車站、捷運與高鐵車站共構的地下通道系統是 一個複雜的都市動線系統,整合了城市中最重要的交通節點、商店街、人行動線,並連結了地面 上許多重要的都市活動標的,如百貨公司、飯店、商場。本研究選擇這一個複雜的都市空間作為 觀察實驗行人行為的場所。實驗總共分析了七位受試者。每位受試者進行兩次尋路的測試,並被 要求在測試期間對錄音機進行放聲思考,其後並有工作人員在不影響受試者行為的前提下進行錄 影跟拍,記錄受試者的行為舉止,並以之與所錄下的放聲思考進行核對。
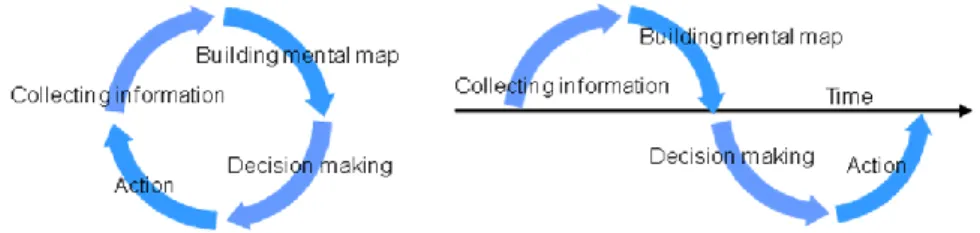
實驗分析的結果顯示行人在都市空間中的行為展現了具備類似結構的循環程序。每一個 循環由下列四個步驟所構成,說明如下:
1. 資訊蒐集:觀察周邊環境,尋找有幫助或有興趣的資訊。
2. 建構心智地圖: 將所蒐集到的資訊與既有的心智地圖整合。心智地圖的內涵包括地標的物 的空間關係、路徑、目的地,以及目前所在位置的認知。
3. 決策制定:評估目前狀態並決定下一步的行動。決策制定的過程包括對既有心智地圖的評 估與比較、修正,確認是否有任何缺漏或者矛盾之處,然後針對所認知的目前位置、目的 地位置以及可行路徑進行決策。
4. 行動:展開行動並藉知以改變自身處境以取得進一步的有用資訊,或者縮短自身位置與目 的地的距離。每一步行動都將導致資訊可及性的變動。
在絕大多數的狀況下,放聲思考的錄音與跟拍攝影的資料經分析後都符合具備上述四個步驟 的連續循環程序。在例外的情況下則有些顯示一或二個步驟的缺漏。圖 3-3 左側將四個階段顯示 為不斷循環的迴圈;右側則是將迴圈以時間向度展開後所得到的波狀圖型。
圖 3-3 四階段的循環程序 (胡善晴 2009)
下表是實驗分析過程中所製作的口語分析的一部份。實驗分析時分別由兩位不同的研究人員 進行編碼後核對具有高度的相似性,其比對信度為 0.93。從分析中可以看出雖然在某些地方有模 糊與不易判別之處,但絕大多數的步驟都符合上述四個步驟的循環模式。某些缺漏的步驟也有可 能是受試者無法完全將其心智過程放聲錄音,以及從後面拍攝的錄影資料無法顯示某些如眼球移 動等細微的動作跡象與心智活動。因此,我們假設某些長時間的階段過程可以進一步分解成更細 微的循環程序,也讓整個行為模式成為多重結構的循環程序。而較細微層次的循環程序需要更精 細的觀察方式才能探知。
表 3-1:某受試者尋路過程之錄影跟拍與放聲思考分析的一部份 (胡善晴 2009)
起始時間 放聲思考口語記錄 尋路狀態描述 編碼代號
03’31’’ 現在看到 6 號出口,我再度來 到了地圖的前面。
決定再閱讀一次地圖。 A1
03’52’’ 懷寧街、懷寧街…懷寧街、站 前地下街的出口 3,那我要怎 麼…出口 6 是往這邊,所以我 要經過出口 6,出口 5、出口 4、
出口 3,所以應該是往這邊。
1. 了解所在位置與目的地 之相對位置,並確認中途 行經之其它出口。
2. 判斷下一步前進方向。
B3→C1、
C2、C3
04’45’’ 可是,出去好像是… 對前進方向感到疑惑。 D2
A2/B/C1.C2/D3 05’07’’ 我好像走到一個商店街。 受測者前進到美食商店街。 D3
A3/B/C1.C2/D3 05’33’’ 感覺我好像進到了商店街,完
全沒有指示;我就退回去,原
準備返回出口 6:凱薩飯店。 D3
A3.A2/B/C3/D2
本的地方,再確認一下。
05’56’’ 所以站前地下街的出口是在哪 呢?
返回出口 6:凱薩飯店。 D2
A2/B/C2/D2 06’36’’ 出口?站前地下街?可是我現
在在站前地下街沒錯,凱薩…
1. 閱讀地圖。
2. 確認現在所在位置。
A1→B2
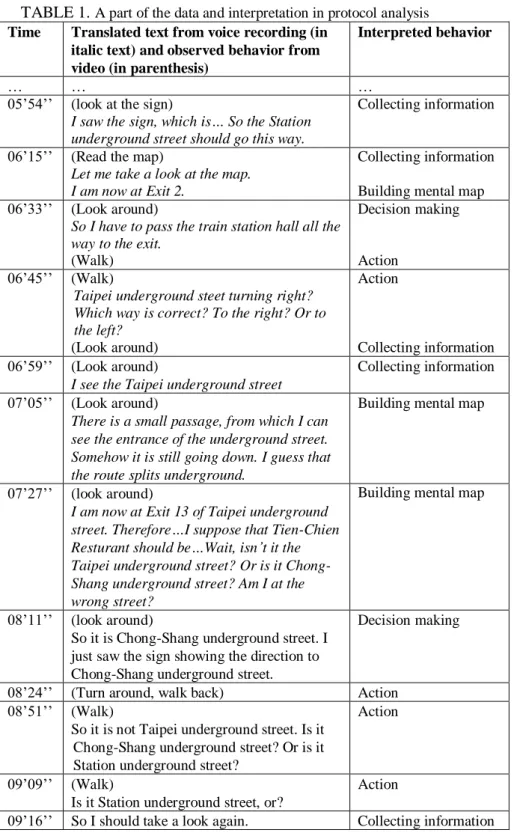
圖 3-4 為將受試者的行為模式依時間軸展開,用不同方向的曲線連結四個循環步驟顯示出來 的結果。從圖中可以看出來受試者在觀察蒐集資訊並建構心智地圖後作出決定,毫不猶豫的走了 一段不短的路程,一直到某些與心智地圖矛盾的資訊出現後,出現幾個快速回圈顯示受試者處於 一種不確定的狀態,頻繁改變自身處境以蒐集所需的資訊並測試心智地圖的正確性。
圖 3-4 四階段的循環程序(胡善晴 2009)
上述實驗顯示出可及的空間資訊、受試者心智地圖、決策程序以及藉之以改變狀態的行動 之間有著密切的關係。一個行人可能會朝向某一個特定的標的移動,或者在都市空間中某些具有 吸引力的標的之間徘徊,無論是哪一種狀況,其決策都是基於行人內部的狀態,以及在其處境之 中所能從環境中蒐集到的資訊而定。因此在本研究的理論模型中設定行人的有限狀態乃是基於其 針對某些特定資訊模式下可能做出的反應進行設定。因此,在虛擬人的模擬過程中分為兩個部分,
分別為環境資訊的傳播,以及虛擬人內部狀態的轉換。
3-4-1實驗二:多重空間 (某大樓八樓梯廳)
實驗地點:某大樓八樓梯廳 實驗方法:
藉由監視錄影機之錄像觀察行人於多重空間時,每小時所呈現出的記錄資料,再以程式模 擬出虛擬人的行為模式。
空間區塊編碼 空間描述
P 兩側梯間
A 電梯
O 系辦梯廳
B C 研究生研究室
D E F G H 教授研究室
I J K L 系辦空間
M N 走廊
R 安全逃生門
圖 3-5 實驗空間設計資料-大樓梯廳平面
在此以8:00-9:00為例,當虛擬人出現在實驗空間中時,會發生的各種行為模式。
例如:當此虛擬人從電梯A出來,有16/25的機率會到梯廳O,9/25的機率會走向兩側P;假 設他到了梯廳O,在這個小時內又會有10/24的機率會回到電梯A,14/24的機率會往走廊N前進;
接下來他有4/19的機率會進他的研究室H,以此類推。
表 3-2 8:00-9:00行人於八樓各空間中出現的記錄
A A→O: 16/25 O→N: 10/24 N→H: 4/19 圖 3-6 虛擬人出現模擬圖
3-4-2實驗三:單一空間 (某大樓梯廳)
實驗地點:某大樓梯廳 實驗方法:
將實驗空間縮小範圍於某大樓梯廳空間,將空間分割為一3*5矩陣(如圖3-5),藉由監視錄影 機之錄像觀察每10秒鐘行人出現的位置,再將時間分為早(8-11a.m.)中(11-14 p.m.)晚(14-18 p.m.) 三大區段並疊加,最後結果將形成具規律變化的多頻率噪音函數(Perlin noise)。
圖 3-7 實驗空間設計資料-某大樓梯廳 (GAS團隊,2009)
圖 3-8 PM12:41:01~12:45:00行人出現於某大樓梯廳的記錄列表
4. 結果與討論:
4-1 本研究主要成果為以下三項:
4-1-1 資訊空間中虛擬人的模擬程式建構
行人移動模擬的部分已經將所收集數據經平均後,代入最小誤差演算法反推馬可夫矩陣的 各項參數。最後將所推得的馬可夫矩陣匯入程式進行模擬。此外,經由在建築系八樓的監視器觀 測後顯示,此模擬程式將為空間中每個區塊建立一個可以描述人可能出現的機率模型。
4-1-2 行為矩陣驗證
歷年來行人相關的研究多以聚集人群為單位,研究重點都偏重於規律性的移動行為的描述,
但無法預測於不同時間軸上,個體於空間中出現的位置所形成的規律性。有鑑於此,本研究已針 對錄影資料分析比對行人在建築系梯廳走動的位置與出現機率,經實驗觀察後發現行人在空間中 移動確實具有規律的特性與現象。經研究發現,建築系辦前的梯廳之行人,在不同時段其分佈呈 現出一固定形態,而駐足人群的群落規模與數量,具有冪次的趨勢型態。
表 4-1 經由觀察後建築系八樓各空間中出現的冪次的趨勢型態記錄
12:42:50 12:43:00 12:43:10 12:43:20 12:43:30
12:43:40 12:43:50 12:44:00 12:44:10 12:44:20 4-1-3 虛擬人模擬程式的應用
本研究進一步將所觀測之結果,應用於先前建構之虛擬人模擬模型中,藉由改變函數的頻 率層級和梯度來調控不同空間中行人的模擬行為。本研究結果未來更可應用於動畫設計、電子遊 戲乃至於避難疏散動線規畫、空間使用評估與自動化設計上。
4-2 討論:
目前本研究初步驗證模擬程式之可行性,研究結果顯示本研究方法具有良好的空間詮釋能 力,研究結果可作為輔助室內空間配置,以此分析動線、資訊空間與行人移動互動影響之工具。
未來研究方向可朝三方面深入探討:
1. 空間設計:空間互動設計 2. 空間規畫:虛擬校園之規畫
3. 空間評估:e化建築空間使用效能評估。
六、 參考文獻
Gibson, W. (1984). Neuromancer. New York: Ace Books.
Hillier B., Penn, A., Hanson, J., Grajewski, T., & Xu, J. (1993). Natural movement:
Or configuration and attraction in urban pedestrian movement. Environment and
Planning B, 20, 29-66.
Okazaki, S., and S. Matsushita (1993), A Study of Simulation Model for Pedestrian Movement in Architec- tural Space, International Conference on Engineering for Crowd Safety, 1993
Turner A, Penn A, (2002), Encoding natural movement as an agent-based system: an investigation into human pedestrian behaviour in the built environment, Environment
and Planning B: Planning and Design 29 473 – 490
Courty, N. and T. Corpetti (2007), Crowd motion capture, Computer Animation and
VirtualWorlds Volume 18, Issue 4-5, September - December 2007, p. 361-370
胡善晴 (2009), “地下街尋路模型之初探”, 國立台灣科技大學建築系碩士論文
ON THE SIMULATION OF PEDESTRIAN BEHAVIOR
A stochastic model based on Markov chain and information space
SHEN-GUAN SHIH,YEN-HUNG CHEN,SHAN-CHING HU, CHING-YUAN LIN
National Taiwan University of Science and Technology
Abstract: Pedestrians move according to their internal states and the spatial information that they perceive at their locations. We use Markov chain to define the state transition of a pedestrian as a stochastic process, and the concept of cellular automata to simulate the way information disseminates in space. We have implemented an agent- based computer program to observe some emergent behaviors from the interactions between pedestrians and the information space they are surrounded. It is expected that the representational model can be used to assist designers in analyzing the relation between building plan and the circulation pattern.
Keywords: pedestrian behavior, simulation
Résumé : Pedestrians move according to their internal states and the spatial information that they perceive at their locations. We use Markov chain to define the state transition of a pedestrian as a stochastic process, and the concept of cellular automata to simulate the way information disseminates in space. We have implemented an agent-based computer program to observe some emergent behaviors from the interactions between pedestrians and the information space they are surrounded. It is expected that the representational model can be used to assist designers in analyzing the relation between building plan and the circulation pattern.
Keywords: pedestrian behavior, simulation
1. Introduction
Pedestrian movement is an important research issue for the design, evaluation and management of building and urban spaces. Some researchers realized that pedestrian movement can be simulated with various models, including cellular automata (Yang et al. 2005) (Schreckenberg et al. 2001) (Fang et al. 2003), fluid dynamic (Helbin et al. 1992), multi-agents (Dijkstra et al. 2002) (Haklay et al.), axial maps (Kim et al. 2004), and magnetic forces (Matsushita et al. 1993). The focuses of research are mostly on the rebuild of pedestrian movement in a virtual world (Haklay et al.) and/or the analysis of behavior patterns (Helbing et al. 2005).
Pedestrians move according to their preferences and the spatial information they perceive from their positions. A pedestrian finds the way to its destination in various means. One can look at signs, ask other people, use
2 S.G. SHIH, Y.H. CHEN, S.C. HU, C.Y. LIN
mental maps, or simply wonder around to see if any clue of the right way can be found. Such information may exist in various forms. We do not need to reconstruct the physical environment in details to simulate pedestrian movement, if we are able to specify the distribution of information in space.
In this research, we assume a generic and simple pattern over the way spatial information disseminates through space by means of probability and statistics. Besides way-finding information, some physical factors of the environment such as temperature and noise may also influence pedestrian movement. Such factors can also be regarded as spatial information spreading out from every position to its surroundings. Various forms of information can be integrated into one platform so that a model based on the dissemination of information can be defined to setup the environment for the simulation of pedestrian movement.
A pedestrian may move towards a preplanned destination, or wonder for various attractions in a building or urban space. It would be difficult to define a representational model for human mind and derive sufficient data to initiate a realistic simulation. However, if we look from the macroscopic view at a large number of pedestrians, all kinds of specific influences to pedestrian behavior can be constrained into some distributional patterns of probability. This paper describes a model based on simulating the dissemination of information in space, and stochastic processes that define reactions of pedestrians who sense the information. The objective of the research is to devise a representational model, emphasizing the modeling of information dissemination in the space, and the internal state description of the virtual pedestrian. The research is based on the following assumptions.
First, there are far too many factors for us to model in the environment that may influence the behavior of virtual human. However, it is possible to combine related factors, and define as some simple mathematical functions that describe the dissemination pattern of spatial information. Therefore the complexity of the real world can be largely simplified. Second, the variations of behavior of virtual humans might be large, but from the macroscopic view, the complex internal states of a virtual human can be defined with some stochastic models such as Markov process.
2. Protocol analysis on way-finding behavior
To test the concept of pedestrians’ moving behavior in this research, we use protocol analysis to study way-finding behavior in an urban area. A complex underground shopping area which is intersected with passages to the subway, train station, and some city attractions such as department stores and hotels was chosen as the test place for the experiment. The way-finding behavior of seven subjects were recorded and analyzed. Each of the subjects was assigned to two way-finding tasks. All subjects were asked to think aloud,
ON THE SIMULATION OF PEDESTRIAN BEHAVIOR 3
which is to talk to a voice recorder what they were thinking and trying to do as they tried to find their way to the assigned destination. A camera man followed each of the subjects to record the behavior along the way. The voice and video recording were analyzed and encoded for protocol analysis.
Our analysis shows that the subjects iterate loops with similar structure.
Each loop is consisting of four steps described as the following.
1. Collecting information: seek for helpful information in the surroundings.
2. Building mental map: integrate the gathered information with the mental map that is in mind. A mental map consists of information regarding spatial relationship among landmarks, path and destination, as well as the current position of self in that map.
3. Decision making: Evaluate the current situation and decide what to do next. This step involves the evaluation of the mental map with the current situation to find if there is missing information or conflicts.
4. Action: Take an action to alter the current situation for gathering more information or moving towards the destination. By action it means movements that lead to some change of the accessibility of information.
In most cases, from the voice and video recording we can observe clues for complete loops with all the four steps, and in other cases observable clues for one or two steps might be missing. The left-hand side of figure 1 shows a loop with the four steps as a circle, while the right-hand side draws the loop differently by breaking and stretching the circle along the time axis to show the behavior pattern.
Figure 1. The four-step loop in the way-finding behavior
The following table shows a snapshot from the recorded data and interpretation of one subject. The snapshot consists of four loops. Ambiguity and conflict are not totally avoidable in the interpretation but the overall looping structure seems to be apparent. Some missing steps might be the result of the subject’s incapability of thinking aloud all the time, and the incapability of video recording in showing some details of human behavior such as eye movement. Therefore, we supposed that each step in the loop can be further broke down into smaller loops with similar structure. The finer loops could be observable with some other means of observation.
4 S.G. SHIH, Y.H. CHEN, S.C. HU, C.Y. LIN
TABLE 1. A part of the data and interpretation in protocol analysis Time Translated text from voice recording (in
italic text) and observed behavior from video (in parenthesis)
Interpreted behavior
… … …
05’54’’ (look at the sign)
I saw the sign, which is… So the Station underground street should go this way.
Collecting information
06’15’’ (Read the map)
Let me take a look at the map.
I am now at Exit 2.
Collecting information Building mental map 06’33’’ (Look around)
So I have to pass the train station hall all the way to the exit.
(Walk)
Decision making
Action 06’45’’ (Walk)
Taipei underground steet turning right?
Which way is correct? To the right? Or to the left?
(Look around)
Action
Collecting information 06’59’’ (Look around)
I see the Taipei underground street
Collecting information 07’05’’ (Look around)
There is a small passage, from which I can see the entrance of the underground street.
Somehow it is still going down. I guess that the route splits underground.
Building mental map
07’27’’ (look around)
I am now at Exit 13 of Taipei underground street. Therefore…I suppose that Tien-Chien Resturant should be…Wait, isn’t it the Taipei underground street? Or is it Chong- Shang underground street? Am I at the wrong street?
Building mental map
08’11’’ (look around)
So it is Chong-Shang underground street. I just saw the sign showing the direction to Chong-Shang underground street.
Decision making
08’24’’ (Turn around, walk back) Action 08’51’’ (Walk)
So it is not Taipei underground street. Is it Chong-Shang underground street? Or is it Station underground street?
Action
09’09’’ (Walk)
Is it Station underground street, or?
Action
09’16’’ So I should take a look again. Collecting information
ON THE SIMULATION OF PEDESTRIAN BEHAVIOR 5
(Stop and Look around) 09’22’’ (look around)
So it is the direction towards Station underground street, which is further down.
Building mental map
09’47’’ Just follow the crowd. Must go to the right, it’s the Exit 3 of the station underground street.
Decision making Action
… …
Figure 2 shows the analysis of a subject’s way-finding effort as a wavy line after the recording data was interpreted and encoded. The subject quickly made decisions and walk a long way confidently until some surrounding information was found to be conflict to her mental map. Then she walked around and around, seeking for the right way.
Figure 2. The wavy line diagram showing the looping pattern of the subject’s way- finding behaviour
3. The model and simulation of pedestrian movement
The experiment described above shows close relationship between spatial information, the mental map of the person, the decision making process, and the action he/she takes to alter the situation. A pedestrian may move towards a preplanned destination, or wander for various attractions in a building or urban space. In either case, the decision is made based on the internal state of the pedestrian and the information he/she perceives from surroundings.
We concern possible reactions of a person when he/she perceives a certain pattern of spatial information. It is assumed that a pedestrian traverses within a finite number of states, each of which is defined by the target position he/she is heading for. Therefore, the simulation is divided into two tasks.
The first is to define what kinds of spatial information are spreading out, and how. The second is to classify possible states of the pedestrian and the pattern of state traversing.
3.1. The dissemination of information
The simulation consists of a rectangular grid and a set of agents walking on the grid. A set of attractions are placed on the grid. Each attraction spreads out the information of its existence to surrounding cells. Virtual pedestrians, collect information regarding the targeted attraction, and walk towards the direction which the information shows.
6 S.G. SHIH, Y.H. CHEN, S.C. HU, C.Y. LIN
We use the term “pheromone” to name spatial information that may influence pedestrian movement, due to the analogy to ants moving around according to the distributional pattern of pheromone. Various kinds of pheromone spread out on the grid, depending on the content and purpose of simulation. Two kinds of information are considered in this research. The first type of information concerning way-finding in space. Each type of attraction for pedestrians in the space is defined as a source of pheromone.
The pheromone disseminates from the source to surrounding areas according to some specific rules that define the amount of pheromone a cell receives from its neighbors. A pedestrian that is moving towards the attraction would follow the direction that is indicated by the strongest scent of the pheromone.
The second type of information indicates physical condition of the space.
Temperature, noise and crowd density are examples of the kinds of information they might be.
Pheromone disseminates into the surroundings in various ways, depending on the type of information and the type of grid cells. For example, we can use the shortest path algorithm to simulate the pheromone that represents way-finding information based on the assumption that the probability a pedestrian would find the right way to its destination is proportional to the distance of its current position and the destination. We do not need to simulate all the spatial characteristics regarding how the pedestrian finds the way if we are interested in only the macroscopic view of pedestrian movement. We can also use dissemination rules that comply with the physical law of heat transmission to simulate a map of temperature on the grid.
3.2. Pedestrian
A pedestrian is viewed as an information processing system that reacts to the accessible information. An agent that represents a pedestrian in the program is defined as a stochastic system with finite states. Each state of the agent represents a specific preference of the pedestrian to some attractions or places with desirable physical condition. Each state of the agent is associated to some rules that describe a preferred pattern of pheromone. The agent moves to reduce the difference between the preferred pattern of pheromone and that of the present position. When the current situation matches the desirable pattern, the action of the state is completed, and the agent switches to another state according to the specific possibility of the stochastic system.
Markov chain is used to define the probability of state transition of an agent. Using Markov chain, it is possible to combine various kinds of pedestrians into one single representation, despite of the fact that each pedestrian may have different preferences and purposes. It greatly simplifies the simulation for we do not need to know the preferences of individual
ON THE SIMULATION OF PEDESTRIAN BEHAVIOR 7
pedestrian. Instead we create a generic agent that represents all pedestrians in the simulation with one single matrix. The matrix that describes such a generic agent can be derived by a method called hidden Markov modeling (Giles et al., 1993). With hidden Markov modeling we can derive the unknown probabilities of state transition of a Markov chain from observable data. In this research we assume that for spaces of interest, we may derive one single state transition matrix for all pedestrians. For example, when we make a simulation on a hospital building, we may use only one type of agents, with one single state transition matrix to define the preferences of all pedestrians, including patients, nurses, doctors and administration people.
Preferences of pedestrians may change in simulation. Pedestrian movement would be different at the beginning of working hours, lunch time, and after working hours in a day. A simple way is using multiple Markov chains for different periods of time in a day. In this case, the discontinuity of pedestrian behavior upon the transition from one Markov chain to another can be smoothen by randomly selecting only a number of agents each time for applying the new Markov chain. The entire population would switch to another pattern of movement smoothly. Another solution is to define the state transition matrix as a function of time so that the transition probability varies with the time of a day and/or a week.
Agents may have interactions with other agents. Collision avoidance is a kind of short range interaction. Long range interaction may be simulated by defining agents as sources of pheromone, so that a crowd can be regarded as distraction or attraction in the simulation, depending on the state of the agent.
Agents may have influences to the spreading of pheromone in the space and all agents would react to the dynamic pattern of pheromone.
4. The simulation
We have done some experiments using a prototype program implemented with the model described in this paper. At the time we are not able to compare the result of the simulation to realistic data of pedestrian movement.
However, we do observe some interesting results from the behavior of agents in the virtual world.
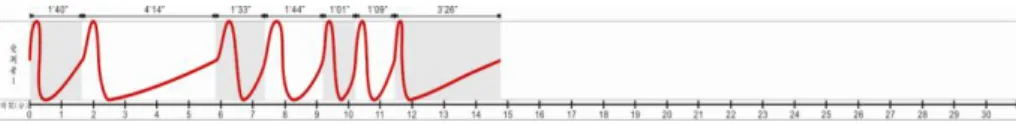
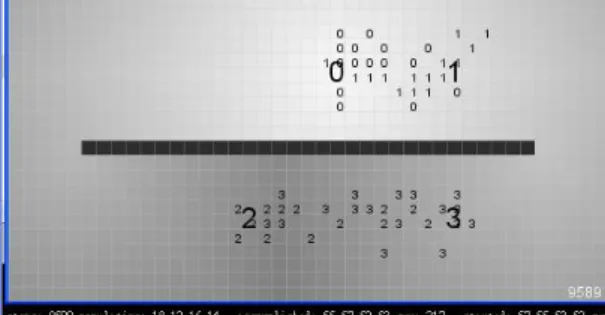
We start from a very simple configuration. The space is divided into two areas with a wall in between them. On each side of the wall, two attractions are placed symmetrically. A number of agents are divided into two groups.
One group moves alternatively between attractions 0 and 1, and the other group moves between attractions 2 and 3. The positions of attractions are marked with numbers in large font and the positions of agents are marked with small font in all figures showing the on-going status of simulation. The number that represents an agent shows the target attraction of the agent.
After an agent has successfully reached an attraction, it transits to another
8 S.G. SHIH, Y.H. CHEN, S.C. HU, C.Y. LIN
state stochastically with the state transition matrix of Markov chain. Agents in the experiments are initialized with various speeds. We assume a normal distribution of speeds with 40% of maximum difference in the simulated population.
Figure 3. Simulation with 30 agents for each group with two attractions.
Figure 3 shows a snapshot of a simulation with 60 agents divided into two groups of the same size. Some interesting result can be found in this simple experiment. First, the numbers of agents that are heading towards specific attractions are distributed equally regardless the initial distribution of the population. When the distribution of population is changed to some unbalanced proportion, such as all agents heading towards attraction 3 and zero for attraction 2, it restores to the equilibrium state within 200 steps in the simulation. As we can see in figure one, the population of each group is restored back to 15 equally. The number of agents in a group is calculated with the average of 100 steps. Second, we find some agents do not choose the shortest path, which are the horizontal lines that connect two pairs of attractions. The agents that walk in the peripheral area are fast moving agents who detour from the shortest path to over pass agents that move slower, or simply avoiding collision with agents that head towards the opposite direction. Third, in some occasions, agents with the same direction line up to avoid frequent collision with agents heading towards the opposite direction, just like prior research on pedestrian movement has shown in their studies (Helbing et al., 2001).
Figure 4. Simulation with 60 agents in each group.
ON THE SIMULATION OF PEDESTRIAN BEHAVIOR 9
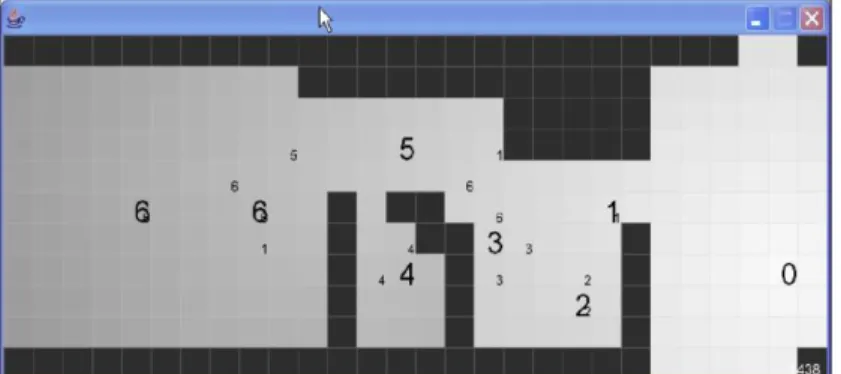
In figure 4, we increase the number of agents in each group to 60. This time the numbers of agents heading towards the same attractions are no longer distributed evenly. Although the spatial situations of all attractions are identical, the number of agents who head towards attractions 0, 1, 2 and 3 are 18, 41, 17, and 42 respectively. Notice that the proportions of population in the group of attraction 0, 1 and the group with attractions 2, 3 are roughly the same. And again, the state of equilibrium is stable regardless of the initial distribution of population. As we increase the size of population, the uneven distribution of population remain stable, but at a more extreme proportion, as shown in figure 5. In these simulations, the attraction that has more agents heading towards may vary, but the proportion of population remains nearly constant.
Figure 5. Simulation with 80 agents in each group.
Figure 6 shows that the proportion of population moving towards different attractions drops from 1 to less than 0.3 as group population increases from 30 to 100. Figure 7 shows the number of agents who reach the target attraction in 10 steps within groups of various populations. The figure shows that with 50 agents in the group, the circulation reaches its maximum efficiency. When the population is smaller than 50, the circulation does not reaches its full capacity, and when the population is greater than 50, circulation jam starts to hold back pedestrians from reaching the target attraction.
0 0.5 1 1.5
30 40 50 60 70 80 90 100
proportion
group population distributed proportion
Figure 6. Proportion of populations moving towards different attractions.
10 S.G. SHIH, Y.H. CHEN, S.C. HU, C.Y. LIN
0 20 40 60
30 40 50 60 70 80 90 100
accomplishments
group population agents reaching attractions
Figure 7. The number of agents reaching attractions in 10 steps
With the simulation in figure 8, we tested another situation where positions of attractions are moved closer to each other. The numbers of agents heading towards attractions 0 and 1 are 18 and 12 respectively. The numbers of agents heading towards attractions 2 and 3 are 16 and 14 respectively. It is obvious that not only blocked circulation may cause uneven distributions; shorter circulation also causes uneven distributions.
Figure 8. Simulation with various distances between attractions.
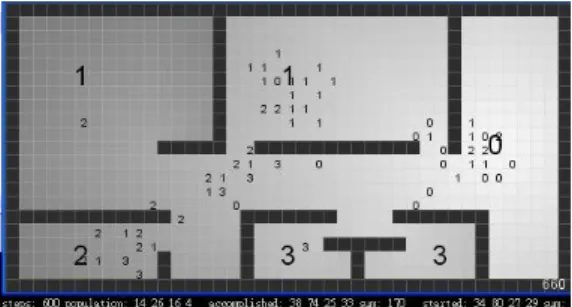
Figure 9 shows a simulation of 60 agents in a building plan with a corridor of 1 meter in width. There is a circulation jam in the corridor. The total times of agents who have reached a target attraction in 10 steps is 66.
After the corridor is widened to 2 meters, the circulation jam is lessened and the number of times an agent reaches a target attraction in 10 steps increases to 170, as it is shown in figure 10. The experiment shows that a designer can modify the design while the simulation is running, and see the effect of the modification very soon after the modification.
ON THE SIMULATION OF PEDESTRIAN BEHAVIOR 11
Figure 9. A building plan with a 1 meter corridor
Figure 10. A building plan with a 2 meter corridor 5. Integration with computer aided design applications
The prototype program can be integrated with computer aided design applications. The building plan can be modified without interrupting the simulation. In figure 11, the entrance of the room in the center was moved to its upper right corner. Agents that are heading for attraction number 1 realize that change soon after the modification of the space layout and follow a new path to enter that room.
Figure 11. The entrance to the central room is moved to its upper-right corner 6. Deriving data from real world
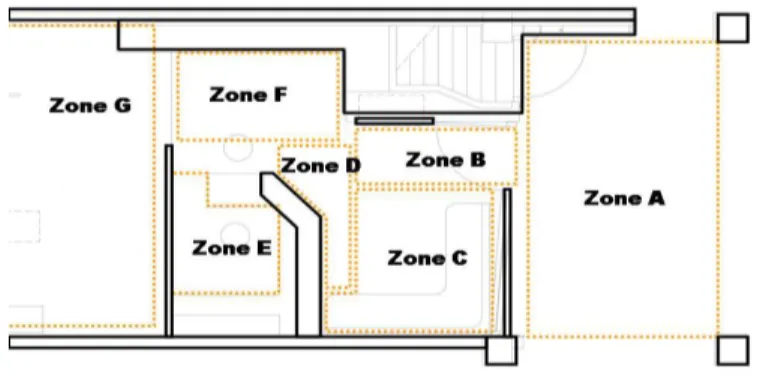
A dentist clinic is chosen for collecting data for pedestrian movement. The floor area of the clinic is about 5 meters wide and 18 meters long. Four video
12 S.G. SHIH, Y.H. CHEN, S.C. HU, C.Y. LIN
cameras were installed in the clinic to monitor the space. The floor area of the clinic is divided into seven zones according to their usage. Figure 12 shows the plan dissected into zone A to zone G.
Figure 12.Zone A to Zone G in the floor plan of the clinic
The numbers of pedestrians that visit each zone within every 10 second time span were counted. Table 2 shows a part of the observed data. Figure 13 shows the picture taken from the camera with boundaries of zones marked with dash lines.
TABLE 2. Number of people visiting each zone within 10 second spans Time Zone A Zone B Zone C Zone D Zone E Zone F Zone G 18:53:20 1 0 1 1 2 1 6 18:53:30 0 0 1 1 2 1 6
18:53:40 2 1 1 1 0 1 5
18:53:50 0 2 0 1 0 0 8 18:54:00 0 0 0 0 1 2 8 18:54:10 3 0 0 0 0 2 9 18:54:20 0 0 2 1 0 0 8
ON THE SIMULATION OF PEDESTRIAN BEHAVIOR 13
Figure 13. A snap shot from the monitoring video
The collected data is analyzed using an algorithm called regression or curve fitting. State transition matrix that satisfies the observed data was estimated. However, the matrix is not unique, and the matrix with the minimum deviation from all data points could the best guess. This desirable best-fitting matrix can be obtained by least square method, which uses the minimal sum of the deviations squared from a given set of data. (Fraleigh et al. 1995) We used the derived state transition matrix for our prototype program to simulate pedestrian movement in the clinic. The picture in figure 16 shows a snapshot of the simulation, in which three people are staying in zone G, while one person is about to leave for zone B. There is a person near zone F is moving towards zone G. So far we have no measurement over the difference between the simulation and the actual situation.
Figure 16. A snapshot from the simulation of pedestrian movement in the clinic 7. Conclusion
The result of the research is very positive to the objective of developing a tool for assisting designers to test pedestrian circulation in their design. It is expected that the model can be used to implement simulations that facilitate design process by providing early assessment to the circulation, as well as building management. The model can also be used to facilitate simulation games for education or for entertainment.
For realistic simulation, the model would require further calibration with data gathered from field study. With the current state of the program, it can be used to do virtual experiments for the discovery of agent behavior that may or may not have relations to pedestrian moving behavior in the real world. However, such virtual experiments can be used to do pilot study for designing realistic experiments or observation on real pedestrians.