Brand strategy and Brand Equity in Consumer products
Content
Introduction………..3
Literature Review And Propositions……….4
Advertising, Promotion and Brand Assets ………4
Advertising Appeals………...6
Different Effect of Advertising Appeals……….…6
Advertising Expenditure and Stock Price………..7
Brand Assets and Stock Price……….7
Data………8
Variable Defined……….9
Research Framework……….10
Result………...11
Factors Affecting Sales(Annually)………..…11
Factors Affecting Sales(Specific Firm)………...…13
Factors Affecting Market Share(Annually)……….………14
Factors Affecting Market Share(Specific Firm)………..…15
Stability of ad appeal strategy………..…18
Cluster analysis………..……..…19
Factors Affecting Stock Price……….…..…21
Factors Affecting value of(Stock Price / Food Stock Index)………..…23
Case Study………..…….25
Aggregate Analysis………..……25
Annual Analysis………...……27
Brand Analysis……….………29
Conclusion………...……34
Summary of Proposition Outcomes………...…..……34
Management Application……….……37
Further Research Propositions……….…………37
Reference……….……42
Brand for Industrial Business………..46
Introduction
Brand Asset was regarded as a vital concept in practical and theoretical fields nowadays. Base on the viewpoint of consumer, the importance of brand assets (image and association) on decision making when purchasing is getting heavier. The meaning brand represents is no more than a symbol or a code, it contains brand image, brand association and brand attitude inside the consumer mind. Frequently, the first step of creating a successful brand by firms is “To establish good communication with consumer”. Of the mix of marketing communication strategies, advertising and promotion strategies are the best tools of linking up brand concept with consumers by marketing staffs. According to a research outcome pointed out, annual advertising expenditure of some well-known business is equal to 7 percent of annual sales. The question is why they preferred preparing such huge budget rather than saving it as earning? There is no denying the importance of advertising work. Since we comprehend the value of it, we must investigate its effect even detail and deeply.
Try imaging yourself as a specialized manager possessing resource allocation authority. You must face many tough questions. Such as which ad appeal type of advertising do consumers prefer?Should advertising strategy of a brand be stable or totally different with the strategy in the past?What is the relationship between stock price and marketing strategy ? What characteristics ( population statistics variables/personality/life style) do high advertising-oriented segmentation have?
What personality(population statistics variables/personality/life style) do high loyalty segmentation own? These issues are the questions marketing experts desired to solve very much. Hence, the main shaft of this paper stresses on the questions we mentioned above.
A successful brand construction needs to be cooperative with many external factors well. When people see the ultimate outcomes, we can’t help turning our heads
to see if outstanding brands have unusual or key marketing strategy. In light of this, we do not only use a mathematical method, but also we will try to test and prove our results by practical case study. However, a lasting operating organization can’t think over in a short-term viewpoint. We will explore the questions mentioned above both in a short-term and long-term concept.
In a world, marketing strategy research should contain multiple dimensions, such as “advertising expenditure/share”, “promotion expenditure/share”, “sales/market share”, “psychology market share”, “advertising appeal strategy”, and “consumer characteristic”. This paper will put all of them into consideration for the sake of being close to reality. Expecting this paper can provide firms with some consultation of the marketing strategy.
Literature Review And Propositions
Advertising, Promotion and Brand Assets
Most literatures have proved that advertising is positively related to brand assets (Boonghee,Naveen,and Sungho,2000) (Cobb,Beal, and Donthu,1995)(Simon and Sullivan,1993) (Boulding, Lee,and Staelin,1994)(Barth et al.,1998).On the contrary, promotion is related negatively to brand assets (Boonghee,Naveen,and Sungho,2000) (Boulding, Lee,and Staelin,1994). However, in such a compete market, firms may draw on the attention of short-term performance rather than long-term brand building.
Promotion might drive instant and visible sales upgrade, but it also damage brand value in the meantime. How could we trade off between short-term gain and long-term loss? We will address the strategic issue of how advertising and promotion.
work.
We classify advertising and promotion effects into five categories from Aakers’
brand equity dimension perspective. Brand loyalty, perceived quality, brand
association, brand awareness and market behavior make up Aakers’ five brand equity dimensions.
Shimp(1997)find that advertising is positively related to brand loyalty. Mela, Gupta & Lehmann(1997)proved that advertising can reduce number of disloyal group. But promotion makes repurchase rate down (Ehrenberg & harlton, 1973) (Shoemarker & Shoaf, 1977)(Guadagni & Little, 1983). Gupta(1988)note that promotion brings out short term brand switch and sales upgrade without effecting brand loyalty. Mela,Gupta & Lehmann(1997)even certificate that promotion cut down brand loyalty. Besides, Aaker and Jacobson(1994)prove that advertising might raise perceived quality. But promotion resulted in a low-quality image (Winer,1986) (Ortmeyer et al,1991).
Advertising strengthen brand association and brand attitude (Shimp,1997).
Otherwise, Krishnamurthi and Raj(1985)indicated that price-oriented ad may enhance price elasticity, and non price-oriented ad may induce price elasticity.
Promotion lowers brand association (Shimp, 1997).
Prentice(1991)notified that activities which can build consumer equity have effects on sales at least for four years. Lal and Padmanabhan(1995), Mela,Gupta &
Lehmann(1997)proved promotion has no effect on market share.
Base on the literatures above, we realize that advertising and promotion. play a pivotal role in the building brand process. Owing to sales and market share are the most objective indexes, we adopt them as substitute variable of brand assets.
Following is the proposition we bring up. This paper wants to test and verify the relationship between market input(such as ad expenditure, promotion expenditure, place, ad share and promotion share) and output (sales and market share) of the firm by two conceptions. One is based on an absolute conception another is based on a comparative conception. We will also explore this proposition according to specific
firm data and specific year data.
Proposition 1:Absolute market input is positively related to absolute market output.
Comparative market input is positively related to comparative market output. Certain firm would perform better than other firm.(We will try to explore the distinguishing characteristic of the firm)
Advertising Appeals
It is called the way advertisings convey to message receiver “appeal”. Kolter
(1991)stated that ad appeal should express some distinct benefit, motive or cognition.
Rational appeal ad displays the function or benefit which product or service can bring, such as product qualities, functions and features. Emotional appeal ad urges consumers’ desire by stimulating their positive or negative feelings. However, the name researchers attaches to appeal types differ. Vaughn ( 1980 ) calls them
“thinking” and “feeling”, while Aaker and Norris ( 1982 ) describe them
“informational/rational/cognitive” and “image/emotional/feeling”. Johar and Sirgy
(1991)label them “value-expressive” and “utilitarian”. Value expressive advertising appeal holds a creative objective to create an image of the generalized user of the advertised product. Utilitarian advertising appeal is simply a creative strategy that highlights the functional features of the product. Laskey, Day, and Crask (1989) develop typology of main message strategies which including five emotional strategies categories and six rational strategies categories.
Besides, firms often integrate discounting/gift giving/drawing lots activities with advertising. “Promotional advertising” is very popular today, and people usually know the promotion information in this way. This paper will discuss promotional ad effect
as well as rational and emotional ad effect.
Different Effect of Advertising Appeals
John and Sirgy (1991) investigated if value expressive and utilitarian appeal ads have divergent ad persuasion and suitable circumstances. The study has shown that value expressive appeal is usually effective(1)in the mature stage of product life cycle(2)when the product is scarce(3)when the product is conspicuous consumed
(4)when the consumer is not highly involved with the product(5)the consumer is not highly knowledgeable(6)the consumer is of the high self-monitoring type.
Laskey, Fox.and Crask (1995) present the effectiveness of a message strategy appears to depend on both the product category and the specific effectiveness measure examed. The effectiveness of informational and transformational ads was not significant either for persuasion or for recall. However, a significant difference was found for key message comprehension. Darley and Smith (1993) find that the most objective appeal perform superior than mixed appeal, the mixed appeal ad perform superior than the most subjective appeal ad.
Previous studies about ad appeal performance usually stressed on the concept of recall, comprehension and persuasion. No empirical work has been studied the sales effectiveness of rational, emotional and promotional appeal ads. One of our study objectives is to shed some light on the relative effectiveness of the three advertising appeal strategies. We want to search for the effectiveness of rational, emotional and promotional appeal advertisings on sales both in long term and shor- term period. We will also analysis the effect by different year and firm data. Besides, we lead variable
“appeal variation” into our model to find out which ad appeal is suitable in different situation.
Proposition2:The performance of each advertising appeal expenditure different with each firm. In addition, ad appeal variation will improve market share.
Performance of ad appeal variation is better in low market share firms than high market share firms. Performance of ad appeal is better in low ad share firms than high ad share firms.
Advertising Expenditure and Stock Price
Hirschey and Weygandt (1985) used q ratio(market value of firm/tangible assets replacing value ) as dependent variable. Results show that advertising expenditure effect lasting 1-5 years. Adding one unit ad expenditure increase seven unit of market value in the future.
Chauvin and Hirschey (1994)deemed that goodwill, net income, advertising expenditure, research and develop expenditure, intangible and tangible have positive and significant influence on sock price.
Proposition3:We regard advertising input (expenditure or share) has positive significant and deferred effect on stock price. Also we will analysis the model according to specific firm data and specific year data.
Brand Assets and Stock Price
Aaker and Jacobson (1987) find that lagged perceived quality is positively related to current return on investment for four businesses groupings. Aaker and Jacobson (1994) noted that perceived quality is positively related to stock return.
Even the change in perceived quality has a significant influence on stock return comparable to that of the changes in a firm’s financial performance. Aaker and Jacobson (2002) take high-tech industry for example. The results show that changes
in brand attitude are associated contemporaneously with stock return and lead accounting financial performance.
Ohlson model(1995)stated that value of a firm can be expressed by function form of book value and abnormal earnings. Abnormal earnings bear on the difference between total earning and current capital cost. It also stands for the ability a firm gets extra earning in the future. So we can explain clearly the relation between brand and stock price by Ohlson Model as well. Barth et al (1998) use ordinary least squares and two stage least square estimating simultaneous equations. They verify that brand value do related significant on stock price, while stock return do positively related significant on the change of brand value. Kerin,Sethuraman(1998)demonstrate the relationship between brand value and market value divided book value is a concave function with decreasing returns to scale. In finance and accounting viewpoints, Simon and Sullivan(1993)can obtain brand value when stock price is given.
To summarize, previous results show that brand value enhance stock price. As a result, we make sure that brand is a vital driver of a firm’s value. Developing and strengthening brand is more than keep up with modern trend but hold an important position of raising firm’s value added.
Proposition4:We regard marketing factors(advertising expenditure/share, promotion expenditure/share, market share)has positive and significant and deferred effect on stock price according to specific firm data and specific year data. Certainly, factors which would influence stock price contain more than marketing factors. We will use some other factors to investigate whether they will affect stock price also. Besides, this paper will instead variable “(stock price/ food stock index)” of stock price to explore the same question we mention above.
Data
For this study, we choose food and drinking industry owing to consumers are not highly involved with food and drinking. The purchase desires of consumers are affected by advertising and promotion activities constantly.
Our analysis requires monthly data on promotion expenditure, promotion share, ad expenditure, ad appeal analysis, ad share, sales, market share, psychology market share, brand analysis, consumer characters, stock price and some financial information.
This paper focus on the public offering companies that having panel advertising /promotion and financial performance data. The panel data consists of nine firms over five year period running from 1998 to 2002. Ad expenditure and ad films of firms comes from Taiwan Effective Ad Expenditure Statistics of corp.潤利. Promotion expenditure and financial information comes from the financial statements each firm over the years. Otherwise, data of brand analysis and consumer characters comes from e-icp database.
Variables Defined
Marketing expenditure per month is equal to one third of quarter marketing expenditure listed on income statement. We subtract firm’s ad expenditure from total marketing expenditure to obtain promotion expenditure.
Market share of j firms (including i product)means sales of the firm j divided by total market sales(=
∑ ∑ ∑
=
=
=
÷ n
1 i
ij 1
n 1 i
ij Sale
Sale m
j
). Ad share means firms ad expenditure
divided by market ad expenditure. Deferred ad share means ad share earlier one month.
We investigate the product penetration in three huge retail stores and five chain
stores in Taiwan. Place score of j firm =
∑
×∑
=
= n ij
i ij n ij
i P
Sale Sale
1 1
Pij means the place penetration rate of the brand product I in firm j, if product can be purchased in all the retail stores, full score is 1.
We separate total advertising expenditure into three categories as rational ad, emotional ad, and promotional ad. Rational ad expenditure equals the value that rational ad ratio multiply by total ad expenditure. Likewise calculation of emotional and promotional ad expenditure is the same way.
We measure ad appeal strategy change by the value of ad variation as follows.
ad l promotiona of
ratio ad l promotiona of
ratio ad
emotional of
ratio ad emotional of
ratio
ad rational of ratio ad rational of ratio n
variatio appeal
Ad
91 88 y
1 - y y
91 88 y
1 - y y
91 88 y
1 - y y
∑
∑
∑
=
=
=
− +
−
+
−
=
Research Framework
The procedure of this paper is shown in the flowing drawing(Figure 1).
First we want to solve the question of the relationship between input(marketing strategies) and out put dimension (sales, market share and stock price)of firms.
Second, we want to probe into if the consumer with different loyalty and ad attractive differ in the aspect of population statistic, personality and life style.
Knowing the answer well helps firms to set up superior market strategies in different segmentation.
Finally, this paper helps us see the relationship between brand ad appeal and consumers’ distinguishing characteristics by particularizing three successful brand cases over the years. We want to comprehend if the ad appeal strategy of the brand matched the consumers’ characteristics so that the brand became the first choice.
FIGURE 1
Research Framework
Input of firm Segmentation Output of firm
1.Cluster by loyalty and ad attractive
2.Cluster by brand purchase (three brand case)
Result
Factors Affecting Sales(Annually)
We empirically examine the long-term and short-term effects of different appeal ads on sales by method of stepwise regression. Next, We will choose different independent variable combinations to look for the most suitable regression model.
We can see the result of Model I of sales(Table1). In the long run, advertising expenditure(β=3.59)is effective than promotion expenditure(β=3.156). In 1998, promotion expenditure plays an important role on sales. But advertising expenditure didn’t. During 1998 to 2001, influence power of advertising is getting heavier. As well as influence of promotion expenditure is on the rise. This also stresses the viewpoint that consumers are not easily satisfied by only advertising or promotion. Next model will try to analysis which advertising appeal ads work better than other appeal ads.
Ad Strategy
(share, expense, appeal, appeal variation)
Market Share Population statistic,
Personality, life style
Brand which consumers purchase most often Brand which consumers impress the best
Promotion Strategy
(share, expense)
Stock Price Sales
Other financial Factors
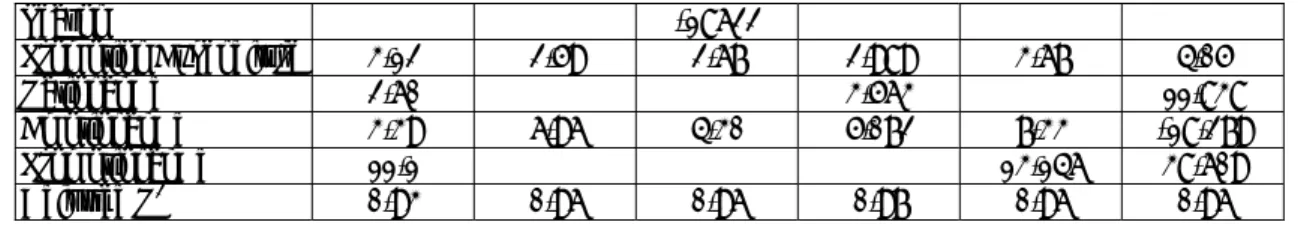
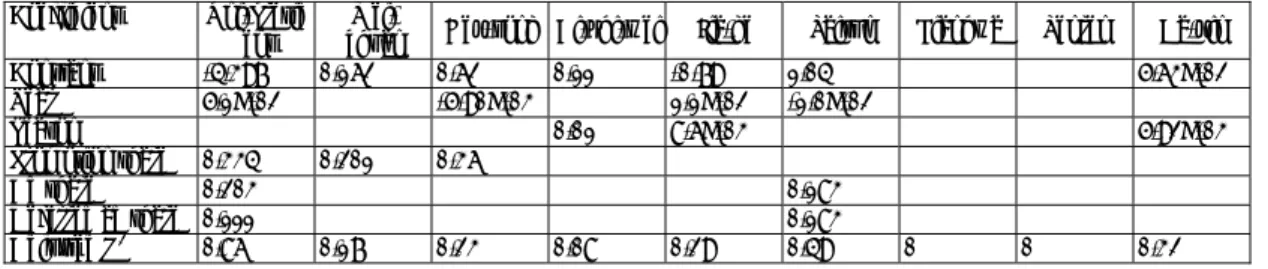
Table 1. The Stepwise Regression Model I of Sales(annually)
Coefficient 1998-2002 1998 1999 2000 2001 2002
Constant -1757972 72950 94317 22511 -39071 -43443
Year
Season -17450
Promotion Expenditure 3.156 2.673 2.689 2.983 3.742 4.424 Advertising Expenditure 3.590 2.508 3.942 4.799
Adjusted R2 0.925 0.958 0.960 0.966 0.956 0.944
In Model Ⅱ of sales, the results(see Table 2)show that the performance of emotional ad is better than rational ad. We also comprehended promotion expenditure and promotional ad expenditure have quite influence on sales of firms. Among different ad strategies, promotional ad (β=11.1)is the best appeal strategy, emotional appeal ad (β=3.39)is secondary, and rational ad (β=2.6)is the last one.
Take annual circumstance for example, trend of emotional ad effect is getting gliding, even its effects turn out to be negative in 2002. We conjecture that the emotional appeal advertisings are too popular to stimulate consumers’ purchasing desires. On the other hand, expenditure of rational ad which attract consumer’
attention performed better and better these years. Consumers enhance purchase motivation for the reason of product quality and trust. Effect of promotional advertising on firms’ sale is very big and on the rise. But it is questionable that the promotional ad has such strong influence?Maybe it is owing to the cost of promotion is not at promotional advertising but at promotion expenditure. Benefit of them is displayed on sales together. According to cost benefit principle, cost is transfer somewhere. This cause makes the strong influence of promotional advertisings.
Table 2. The Stepwise Regression Model Ⅱof Sales(annually)
Coefficient 1998-2002 1998 1999 2000 2001 2002
Constant -1379418 58354 101698 21195 -37617 -34970
Year 15683.2
Season -18622 Promotion Expenditure 3.12 2.59 2.67 2.989 3.67 4.05
Rational Ad 2.60 3.563 11.838
Emotional Ad 3.39 6.96 4.30 5.072 7.33 -18.279
Promotional Ad 11.1 13.146 38.609
Adjusted R2 0.93 0.96 0.96 0.97 0.96 0.96
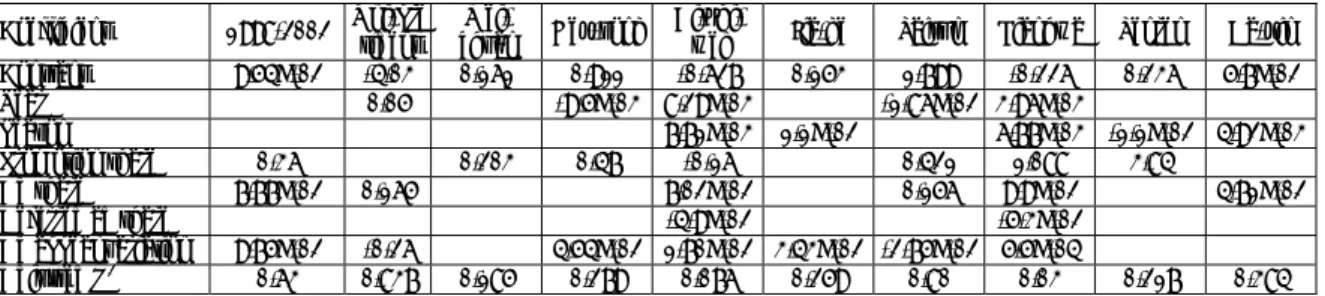
Factors Affecting Sales(Specific Firm)
How did the specific firm perform actually these years? First(see Table 3), the emotional advertising (β=8.77)of Corporation Uni-president is the best than other emotional advertising of other firms. Besides, it is hard for other firms to catch up with the performance of promotional ad (β=34.78)of corp. Uni-president. Corp.
Wei-chuan is the best rational advertising(β=4.11)maker. The promotion expenditure achievement of corp.Hey-song(β=2.46) is better than that of other firms. But gap between them is not very obvious.
Table 3. The Stepwise Regression Model Ⅰ of Sales(specific firm)
Coefficient Uni-pres ident Wei-
chuan Hey-son
g Ai-zhi-
wei Jia-ge Taisun Lianhwa Tenren Da-yin Constant 1563006 294163 86291 44827 317913 220962 69993 66288 55007 Year
Season -74750 -31213 -20374 8866 4819 -2990
Promotion Expenditure of firms 2.003 2.46 2.22 1.00
Rational Ad 4.114 2.68
Emotional Ad 8.774 3.819 7.365 5.91 3.93
Promotional Ad 34.779
Adjusted R2 0.351 0.47 0.52 0.30 0.161 0.45 0.20 0.25 0.16
Second, what would the results change if we take off the “Promotional ad”
variable(Model Ⅱof Sales, Table 4)?Compare Table 3 with 4, we find that the outcome is similar except the corp.Uni-president. The explaining power of Uni-president decreases from 0.35 to 0.27. Else, emotional ad of corp.Uni-president remains optimun. Rational ad of corp.Wei-chuan and promotion expenditure of corp.Hey-song continue keeping the best condition.
Table 4. The Stepwise Regression Model Ⅱof Sales(specific firm)
Coefficient Uni-pres
ident Wei-
chuan Hey-son
g Ai-zhi-w
ei Jia-ge Taisun Lianhwa Tenren Da-yin Constant 1639550 294163 86291 44827 317913 220962 69993 66288 55007 Year
Season -88137 -31213 -20374 8866 4819 -2990
Promotion Expenditure of
firms 2.003 2.46 2.22 1.00
Rational Ad 4.114 2.68
Emotional Ad 13.61 3.819 7.365 5.91 3.93
Adjusted R2 0.27 0.47 0.52 0.30 0.161 0.45 0.20 0.25 0.16
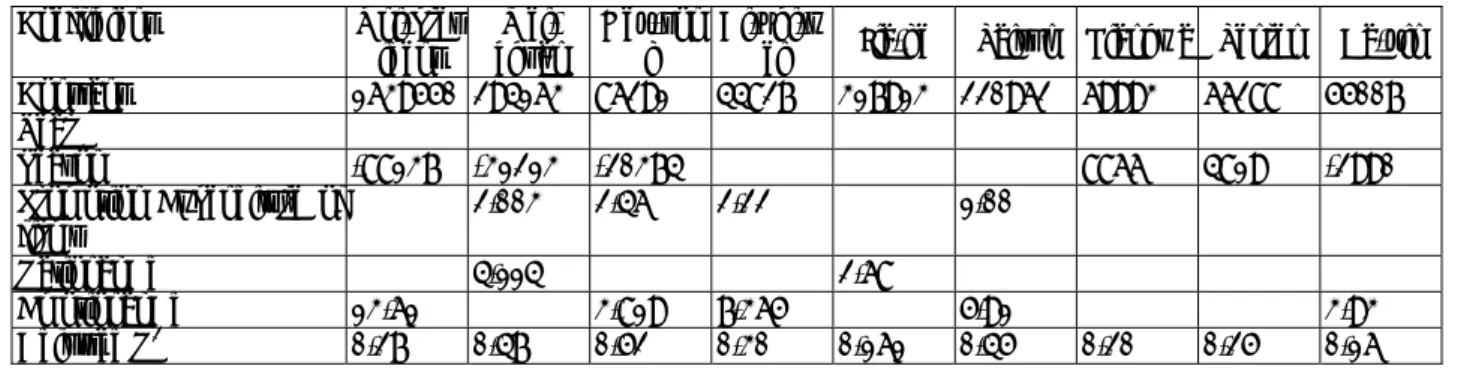
Factors Affecting Market Share (Annually)
In Table 5, it is manifested that both promotion share(β=0.52) and advertising share (β=0.22)have positive effect on market share. Unusual finding showed promotion share acts more effective than advertising share on market share. This result is not to be compared with our anticipation. However, place(β=-2.96E-02), market ad expenditure(β=-3.95E-07)and stock index of food (β=-7.00E-05)have negative but slight influence on market share.
Among yearly promotion performance, 2001 promotion campaign(β=0.68) is the most effectual than other year. To deserve to be mentioned, corporation ad expenditure is not a determinant factor in the period from 1998 to 2000. As a matter of fact, effect of market ad expenditure is more essential than other market strategy.
Until 2001, ad effect in the food and beverage industry appeared gradually as the ad quality makes progress.
Table 5.The Stepwise Regression Model of Market Share(annually)
Coefficient 1998-2002 1998 1999 2000 2001 2002
Constant 0.34 0.64 0.35 0.40 0.304 0.30
Year
Month
Season
Prosperity leading index
Sales of manufacturing industry
Prom expenditure of firm 5.47E-07
Prom expenditure of market
Promotion share 0.52 0.435 5.27E-07 0.68 0.66
Place -2.96E-02 -5.36E-02 -3.56E-02 -4.92E-02 -2.58E-02 -2.51E-02
Ad expenditure of firm 1.84E-06 2.14E-06
Ad expenditure of market -3.95E-07 -1.44E-06 -2.57E-07 -7.05E-02 -7.28E-07
Ad share 0.11
Deferred ad share
Stock quotes -2.08E-05
Food Stock index -7.00E-05
Adjusted R2 0.49 0.46 0.40 0.52 0.67 0.64
Factors Affecting Market Share (Specific Firm)
Our first regression model of market share is listed in table 6. \Take corp.
Uni-president for example, promotion share, advertising share, deferred advertising share, stock quote are all positively related to market share. Among these variable, promotion share(β=0.54) are the most useful tool, next is advertising share(β=0.17), deferred advertising share(β=0.11) is the last. It is thus evident that ad earlier stage of Uni-president put deeply impression on consumer resulting in effecting current market share.
Specially, market share of Taisun firm increase with promotion share, ad share, deferred ad share and stock quotes. Unusually, effect of deferred ad share(β=0.19)
on market share is greater than that of current ad share(β=0.13).
Table 6. The Stepwise Regression Model Ⅰ of Market Share(specific firm)
Coefficient Uni-presid ent
Wei-
chuan Hey-song Ai-zhi-wei Jia-ge Taisun Lianhwa Tenren Da-yin Constant -4.912 0.15 0.694 0.11 -0.91 1.425 0.201 0.09 Year 6.18E-02 -6.79E-03 1.26E-06 -1.51E-02
Month -4.18E-03
Season 9.9E-03 6.48E-03 4.73E-03 Prosperity leading index -6.84E-08 Salesof manufacturing industry prom expenditure of firm Prom expenditure of market -7.04E-08 -2.53E-08 Promotion share 0.54 0.35 0.38 Place
Ad expenditure of firm Ad expenditure of market 1.32E-07 2.55E-07 -1.17E-07 Ad share 0.174 7.94E-02 0.13 0.12 Deferred ad share 0.11 0.194 Stock quotes 1.92E-05 -6.02E-06 1.33E-05 Food Stock index 2.91E-05 -1.13E-04 Adjusted R2 0.90 0.35 0.38 0.08 0.52 0.77 0.134 0 0.47
In model Ⅱ,We subtract some variables including in modelⅠ.Such as month, prosperity leading index, sales of manufacturing industry , promotion expenditure of firm , promotion expenditure of market , place, ad expenditure of firm and ad expenditure of market. See outcomes of model Ⅱ in table 7.
The explaining power of corp.Uni-preisdent(Adjusted R2=0.86)and Taisun
(Adjusted R2=0.77) is quite well. Explaining factors of corp. Uni-preisdent include year, promotion share, ad share and deferred ad share. Besides, explaining factors of corp.Taisun include year, promotion share, ad share ,deferred ad share, stock quotes and food stock index. As stock quotes increase, market share of corp. Taisun increase at the same time. While food stock index and market share of corp. Taisun move in the opposite direction. After all, sales of corp. Taisun come from oil, tea, water and sweet porridge. The upturn of Stock quotes stands for the prosperous prosperity of total economy. However the increase percentage of Taisun sales is greater than that of the market. The upturn of the Food Stock index stands for the prosperous prosperity of the food ad beverage industry. But the increase percentage of Taisun sales is not more than that of the market which leads to market share of corp. Taisun decline.
Table 7. The Stepwise Regression Model Ⅱ of Market Share(specific firm)
Coefficient Uni-presid ent
Wei-
chuan Hey-song Ai-zhi-wei Jia-ge Taisun Lianhwa Tenren Da-yin Constant -4.397 0.15 0.62 0.11 0.2 1.425 5.63E-02 Year 5.1E-02 -5.90E-03 -1.5E-02 Season 0.01 6.68E-03 5.92E-03 Promotion share 0.334 0.35 0.36 0.379 Ad share 0.203 7.9E-02 0.127 Deferred ad share 0.111 0.194 Stock quotes -6.02E-06 1.33E-05 Food Stock index 2.9E-05 -7.10E-05 -1.13E-04
Adjusted R2 0.86 0.35 0.23 0.08 0.31 0.77 0 0 0.32
In model Ⅲ(See Table 8),We subtract variable “stock quotes” and “food stock index” including in modelⅡ. The explaining power Taisun(Adjusted R2=0.49)
declines. And effect of ad share and deferred ad share is the same. This result indicates that ad effect last at least one month. Promotion share performance of corp.
Hey-song is the best among the nine companies.
Table 8 The Stepwise Regression Model Ⅲ of Market Share(specific firm)
Coefficient Uni-presid ent
Wei-
chuan Hey-song Ai-zhi-wei Jia-ge Taisun Lianhwa Tenren Da-yin Constant -4.397 0.162 0.62 0.11 -0.79 1.04 5.63E-02 Year 5.1E-02 -5.90E-03 1.1E-02 -1.0E-02 Season 0.01 8.6E-03 5.92E-03 Promotion share 0.334 0.201 0.36 Ad share 0.203 0.183 Deferred ad share 0.111 0.183 Adjusted R2 0.86 0.17 0.23 0.08 0.29 0.49 0 0 0.32
Stability of ad appeal strategy
We introduce variable “ad appeal variation” into our paper(Table9). It is proved that ad appeal variation(β=9.75E-02) is significant and it improves regressive explaining power in the meanwhile. However, promotion share, ad share and ad appeal variation are positively related to market share. The more ad appeal variation is, the better market share performed.
In the next step, we decide to take individual firm for example. Different firm has diversity outcomes. To our surprise, the relationship between ad appeal variation and market share of corp.Uni-president and Taisun is negative. Previous discussion has proclaimed that their ad share is positively and significantly related to market share. There is of no use to improve market share by changing ad appeal strategy, while brand image and association are very strong and profound. Situations of corp.Hey-song, Ai-zhi-wei and Lianhwa are contrary. Ad appeal variation is positively
related to market share, which means effect of ad appeal variation on market share of these firms is positive and significant.
Table 9.The Stepwise Regression Model of Market Share (Stability of ad appeal strategy ) Coefficient 1998-2002 Uni-pre
sident Wei-
chuan Hey-song Ai-zhi-
wei Jia-ge Taisun Lianhwa Tenren Da-yin Constant 9.54E-02 -4.03 0.161 0.911 -0.627 0.153 1.799 -0.226 0.236 5.7E-02 Year 0.05 -9.5E-03 8.29E-03 -1.86E-02 3.96E-03 Season 7.71E-03 1.1E-02 6.77E-03 -1.1E-02 4.92E-03 Promotion share 0.36 0.203 0.47 -0.16 0.421 1.088 3.84 Ad share 7.77E-02 0.165 7.02E-02 0.156 9.9E-02 4.71E-02 Deferred ad share -4.9E-02 -5.3E-02 Ad appeal variation 9.75E-02 -0.26 4.54E-02 1.70E-02 3.43E-02 -2.75E-02 5.5E-04
Adjusted R2 0.63 0.837 0.185 0.279 0.076 0.259 0.80 0.03 0.217 0.384
Cluster analysis
We considered some firms manipulate their ad appeal strategy well, but some don’t. This paper wants to continue finding out the suitable ad variation strategy. We classify firms with both market share and ad share by the method of cluster analysis
(table10 and table 11). We desire to see what is the best ad appeal variation strategy in different situation.
Table10.Descriptive Statistics of the High/Low Market Share Clusters
1998-2002 Strong market share firms Weak market share firms
Number of sample 540 108 432
Mean of Market share 0.19 0.36 0.15
Table 11. Descriptive Statistics of the High/Low ad Share Clusters
1998-2002 High ad share firms Low ad share firms
Number of sample 540 145 395
Mean of Ad share 0.13 0.31 0.06
From Table 12, we can see clearly the suitable strategy in different situation.
Hence research outcomes revealed that ad appeal variation might lift market share
(β=9.75E-02). But the strong market share firms bring entirely different results(β=
-0.02), while ad appeal variation has no effect on market share of weak market share firms.
Besides, ad appeal variation improve market share of the High ad share firms
(β=0.07). But effect of ad appeal variation is less than low ad firms. Effect of ad share on market share of strong ad share firms is larger than that of low ad share firms.
As far as low ad share firms are concerned, ad appeal variation is positively related to market share. Otherwise, ad share is negatively related to market share. It showed that effect is not appeared yet.
Table 12.The Stepwise Regression Model of Market Share (Cluster Analysis ) Coefficient 1998-2002 Strong market
share firms Weak market
share firms High ad share
firms Low ad share firms Constant 9.54E-02 -1.94 0.117 -1.685 0.80
Year 0.03 1.96E-02 -7.65-E03
Season
Promotion share 0.36 0.35 0.443 0.312
Ad share 7.77E-02 0.08 0.211 -0.196
Deferred ad share 0.06
Ad appeal variation 9.75E-02 -0.02 0.07 0.101
Adjusted R2 0.63 0.27 0.30 0.747 0.60
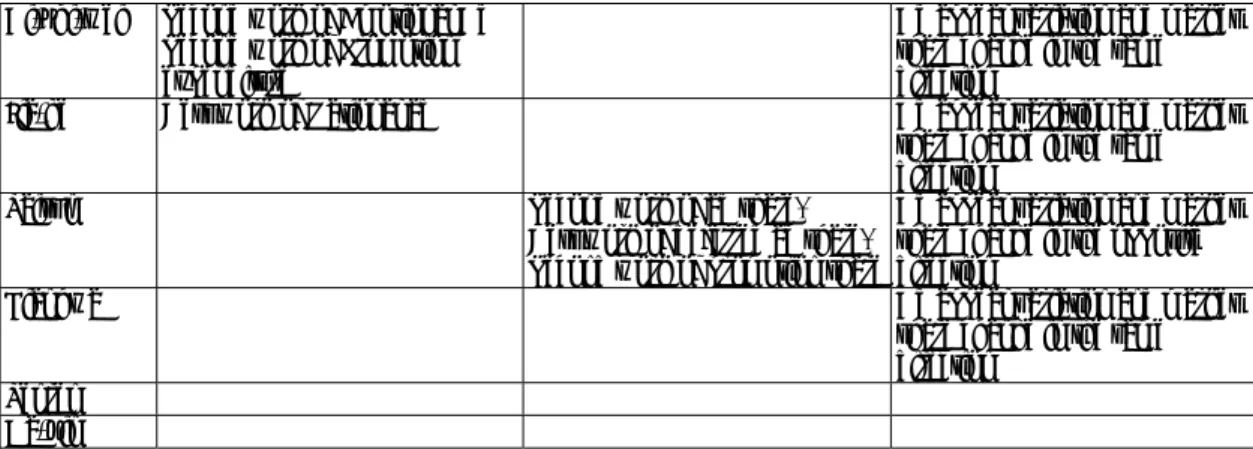
Table 13 lists the main marketing performance of the nine corporations. We only pick out the representative results. Next we want to see the relationship between stock price, marketing input and other financial information.
Table 13.Brief Summary of the Firm
Firm Ad appeal effect on sales (Deferred)ad share on market share,Promotion share on market share
Ad appeal variation on market share
Uni-president Best work of Emotional Ad/Best work of Promotional Ad
Best work of ad share/ Second work of deferred ad share/ Best work of promotion share
Ad appeal variation and market share change in the opposite direction
Wei-chuan Best work of Rational Ad Hey-song Best work of Promotion
expenditure Ad appeal variation and market
share change in the same direction
Ai-zhi-wei Second work of Emotional Ad Second work of Promotion expenditure
Ad appeal variation and market share change in the same direction
Jia-ge Best work of Rational ad Ad appeal variation and market
share change in the same direction
Taisun Second work of ad share/
Best work of deferred ad share/
Second work of promotion share
Ad appeal variation and market share change in the opposite direction
Lianhwa Ad appeal variation and market
share change in the same direction
Tenren Da-yin
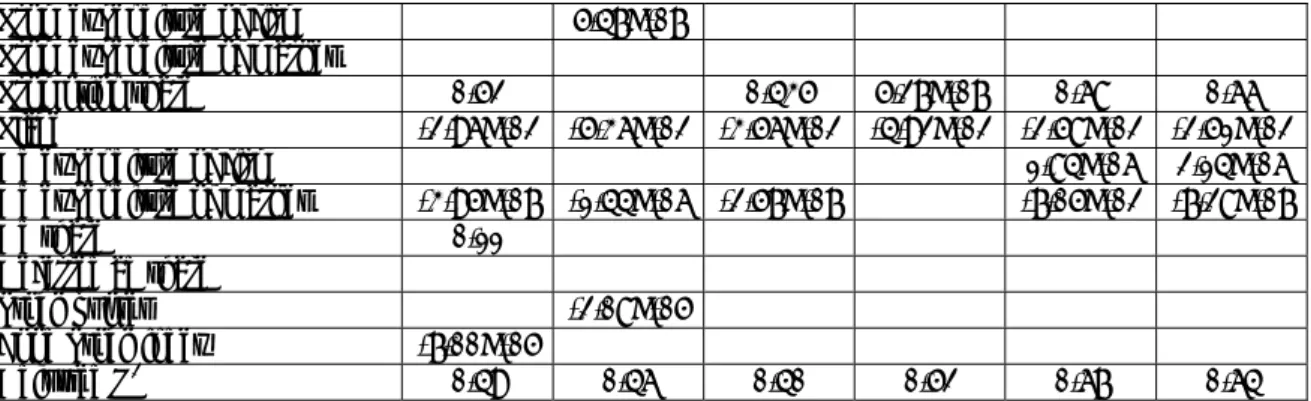
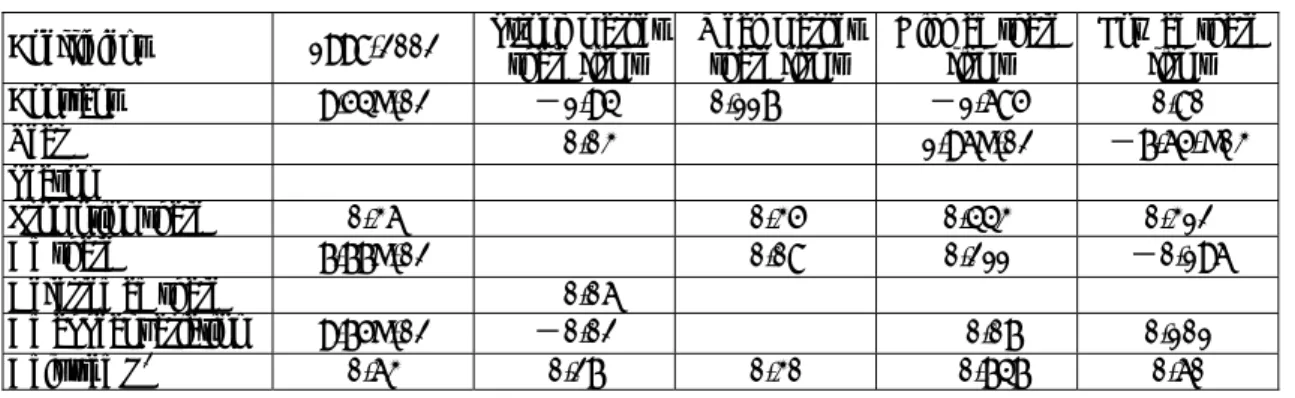
Factors Affecting Stock Price
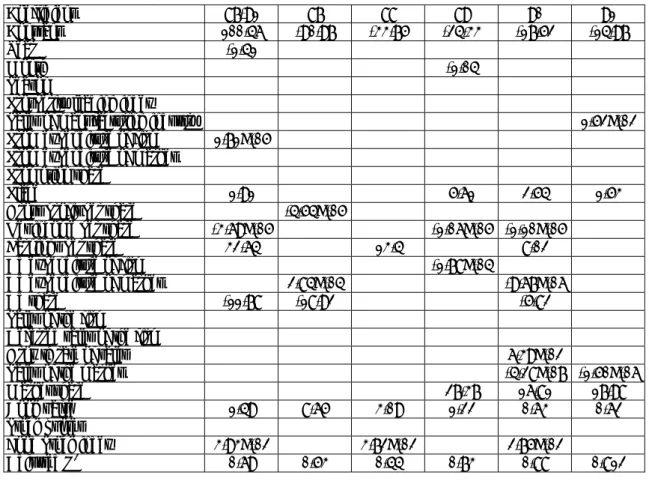
We also adopt stepwise regression method to view which variables might control the firms’ stock price fluctuation(see Table 14 and Table 15). In a long-term period view, firms’ promotion expenditure, place, earnings per share, book value and food stock quotes are positively related to firms’ stock price. Besides, year, net income and ad share have negatively and significant effect on firms’ stock price. Descend of firms’ stock price year by year reflect trend of overall economic environment. The reason why ad share lowers stock price is investors regard ad expenditure as
“expenses” not “assets”. Once some firms’ ad expenditure stands a high position in the industry, investors might reduce purchase intention. It happens that ad share and stock price perform in the opposite position.
Base on our assumption, market share is positively related to stock price. This assumption is denied in 1998 and 1999. Until 2000, market share become positively related to stock price.
Stock price of individual firm can’t be described by specific variable. This conclusion manifested that security market displays a perfect condition. We can’t use simple mathematical form to predict stock price.
Table 14.The Stepwise Regression Model of Stock Price(annually)
Coefficient 87-91 87 88 89 90 91 Constant 100.46 -90.97 -33.75 -24.33 -17.52 -14.97
Year -1.41
Month -1.04
Season
Prosperity leading index
Sales of manufacturing industry 1.52E-02 Prom expenditure of firm 1.71E-05
Prom expenditure of market
Promotion share
Place 1.91 5.61 2.54 1.53
Gross profit per share -4.54E-05
Net income per share -3.69E-05 -1.06E-05 -1.10E-05
Earnings per share 32.64 13.4 8.02
Ad expenditure of firm -1.78E-04
Ad expenditure of market 2.84E-04 -9.67E-06
Ad share -11.78 -18.92 -5.82
Sales of the firm
Deferred sales of the firm
Growth rate of sales 6.39E-02
Sales of the market -4.28E-07 -1.50E-06
Market share 27.37 16.81 17.98
Book value 1.49 8.65 3.09 1.22 0.63 0.62
Stock quotes
Food Stock index 3.93E-02 3.72E-02 2.75E-02
Adjusted R2 0.69 0.53 0.44 0.73 0.88 0.812
Table 15.The Stepwise Regression Model of Stock Price(Specific firm)
Coefficient Uni-president Wei- chuan Hey-song Ai-zhi-wei Jia-ge Taisun Lianhwa Tenren Da-yin Constant 236.10 8.48 8.21 -12.05 753.43 -47.41 846.832 -101.83 4.13
year -2.88 -7.72 -10.59 1.20
month
season 0.888 -1.05
Prosperity leading index 0.383 0.874 Sales of manufacturing
industry 2.50E-02 -1.37E-02 -6.06E-02 Prom expenditure of firm
Prom expenditure of market -1.47E-05
Promotion share 23.63 -70.7 -32.93 296.723
Place
Gross profit per share
Net income per share 5.89E-04 -9.35E-05 1.12E-04
Earnings per share -11.08 -291.69 23.53 Ad expenditure of firm 1.18E-04 -1.31E-03 Ad expenditure of market
Ad share
Sales of the firm Deferred sales of the firm Growth rate of sales Sales of the market
Market share -27.09
Book value 1.46 1.35 -2.47 1.52 2.073
Stock quotes 1.18E-03 -2.83E-03 -6.47E-04 -1.75E-03 Food Stock index 0.12 6.47E-02 2.06E-02 6.59E-02 2.15E-02 3.62E-02 7.15E-02 Adjusted R2 0.97 0.93 0.91 0.95 0.98 0.97 0.93 0.94 0.93
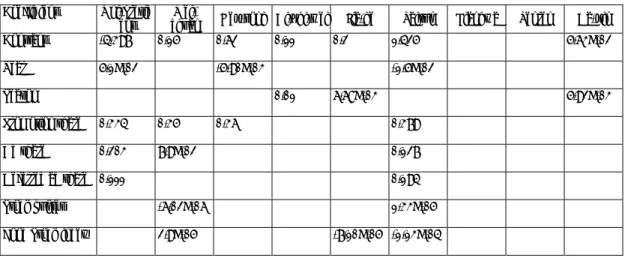
Factors Affecting(Stock Price/ Food Stock Index)
We introduce variable of (Stock Price/Food Stock Index) in this mode(Table 16 and 17). To compare with discussing stock price only, this model is a comparative concept. It is from the 1998 to 2002 data, factors effecting value of (Stock Price/
Food Stock Index)include year, earnings per share, market share and book value.
Among them, market share play a vital role in the excess stock value compare to aggregate food stock index. This outcome is divergent with the former model of stock price.
The outcomes of single year show that only book value is common explanatory variable. In 2000 and 2001, the larger market share, the larger ratio of stock price to food stock index. Among the nine firms, only Uni-president firm’s market share and stock price /food stock index present to be positive and significant .
Table 16.The Stepwise Regression Model of(Stock Price/ Food Stock Index)(annual)
Coefficient 1998-2002 1998 1999 2000 2001 2002 Constant -0.162 -5.4E-02 -4.24E-02 -4.88E-02 -2.02E-02 -2.2E-03
year 1.51E-03
season 5.31E-03
Prosperity leading index
Earnings per share 2.06E-02 3.3E-02 4.37E-02 Growth rate of sale
Market share 3.08E-02 6.16E-02 6.80E-02
Deferred market share -7.93E-02 7.09E-02
Book value 5.47E-03 7.56E-03 7.2E-03 6.62E-03 5.75E-03 4.66E-03
Stock quotes -3.3E-06 -4.07E-06
adjusted R2 0.38 0.26 0.39 0.45 0.72 0.71
Table 17.The Stepwise Regression Model of(Stock Price/ Food Stock Index)(specific firm)
Coefficient Uni-president Wei- chuan Hey-song Ai-zhi-wei Jia-ge Taisun Lianhwa Tenren Da-yin Constant 2.71E-02 -9.46E-03 1.07E-03 1.5E-02 1.50 -7.78E-02 -1.12E-02 -0.32
year -1.55E-02 4.33E-03 season 2.27E-03 -2.03E-03 Prosperity leading
index
1.03E-03 1.47E-03 Earnings per share -2.92E-02 1.75E-02 3.32E-02 Growth rate of sale
Market share 0.14 -0.141
Deferred market share -7.56E-02 -5.54E-02 -0.167 Book value 5.30E-03 3.94E-03 1.09E-03 -4.99E-03 7.02E-04
Stock quotes -3.55E-06 adjusted R2 0.53 0.63 0.28 0.174 0.77 0.681 0.35 0.80 0
Case Study
Aggregate Analysis
This paper want to discuss if consumer personality and life style is different among the segmentations clustering by advertising attraction and loyalty score . We obtained data from E-icp database. E-icp was engaged in consumer consumption behavior annually from 1980s’ until now. Our analysis data includes 5 years lasting from 1998 to 2002.
Here advertising attraction score means the times someone stimulated by advertising when purchasing j categories of food and beverage commodities. Perfect score is one. The bigger ad attraction score is to signify the consumer think highly of advertising. We can determine advertising accepting level by ad attraction score.
Similarly, loyalty score is measured as the times consumer repeated purchasing some brand of j categories commodities. Perfect score is one. High loyalty score means the consumers are used to repeat purchasing commodities, which are a faithful group of brand and they are not likely to be brand switchers.
This paper segment all samples each year into four groups by the criterion of ad attraction score and loyalty score. We used one way ANOVA to test if the segmentation is effective or not. It is showed that segmentation method is workable.
There did exist significant difference between the four groups on the dimension of ad attraction grade and loyal extend. Here we defined segmentation 1 to be high loyalty and high ad attractive, segmentation 2 to be high loyalty and low ad attractive, segmentation 3 to be low loyalty and high ad attractive, and segmentation 4 to be low loyalty and low ad attractive.
Which segmentation did a successful leading brand obtain support from on earth?We use panel data(Which brand do you purchase most often?)(Which brand impress you the best?)to obtain total market share and market share of the four segmentation each category. If some segmentation market share is greater than overall market share, the segmentation can get one point. High score means the segmentation is provided with high contribution.
According to the condition that consumer actually buy goods, the high loyalty/low ad attractive segmentation contributed most, then the high loyalty/ high ad attractive segmentation contribute secondary, after that is the low loyalty/ high ad attractive segmentation. The low loyalty/low ad attractive one is the least contributed segmentation. (See table 18)
Table 18 Contribution of the four segmentations (actually purchasing brand)
High loyalty Low loyalty
High ad attractive 36 25
Low ad attractive 41 14
Another observed perspective is the best brand within the consumers’ mind, at this time the high loyalty/high ad attractive segmentation contributed most, then the high loyalty/ low ad attractive segmentation contribute secondary.(See table 19)
Table 19 Contribution of the four segmentations(ideal brand)
High loyalty Low loyalty
High ad attractive 40 29
Low ad attractive 31 24
Summarily, not only the leading brand of actually market state or the leading brand in the consumers’ mind, both high loyalty and high ad attraction are the key
factors. Do different .segments own distinguishing characteristic or life style they?
Catch consumers’ psychology states more accurately must help when firm determine market strategies. We go on excavating consumer deeply by panel data.
Annual Analysis
Due to there exists 16 items inquiring customers about personality character. We extract personality dimension by Varimax Rotation Principle of Factor Analysis.
Hence, the outcome of 1998 shows that the five dimensions are extracted. By way of reliability test, only one dimension is reliable(Alpha =0.7134). In additional, there are 132 items about consumer life style in E-icp database. We extracted thirty-seven dimensions concerning with life style. Subsequently, we try to test if the four segmentations have some traits distinctive. Results(See Table 20)show that the four clusters have nothing different in personality, life style items and population statistic variable. However, there is significant difference between the four clusters in life style dimension. For instance, segmentation 2 is the cluster that least believe in advertising.
To our surprise, cluster 2 thinks highly of fashion factor than cluster 4. They prefer popularity than practical utility, try to attract the opposite sex, have fast food regularly, dressing painstakingly in order to express personal style, and so forth.
Practically, firms usually segment customers by standards of population statistic variables such as sex, age, income, and educational background. Therefore, we also want to test if population statistic variable influence loyalty and ad attractive. Results of 1998 show that educational background effect loyalty. Consumers who get master degree or above have the lowest loyalty, while customers who get elementary school diplomas have the highest loyalty.
Table 20.Summary of the four clusters of 1998
Cluster 1 Cluster 2 Cluster 3 Cluster 4 high loyalty/
high ad attractive high loyalty/
low ad attractive low loyalty/
high ad attractive Low loyalty/
low ad attractive
Loyalty score 0.85 0.87 0.36 0.25
Ad attractive score 0.67 0.0 1.0 0.10
No of sample 283 454 106 343
Brief summary
(For further details, see Appendix)
Life style dimension of the four cluster is significant different.
(See Appendix)
There is no different in personality items, population and statistics variables between the four clusters.
Following the precedent of the way we execute above, the results of 1999 (See Table 21)perform that the personality dimensions, personality items, life style dimensions , life style items and population statistics variables are different between the four segmentation. We find cluster 2 is more serious, overcautious and introvert than cluster 3. Cluster 2 deliberates slowly, than cluster 4.
Table 21.Analysis of the four clusters of 1999
Cluster 1 Cluster 2 Cluster 3 Cluster 4 high loyalty/
high ad attractive high loyalty/
low ad attractive low loyalty/
high ad attractive Low loyalty/
low ad attractive
Loyalty score 0.80 0.82 0.23 0.26
Ad attractive score 0.76 0.00 0.65 0.00
No of sample 213 497 222 377
Brief summary
(See Appendix)
There is really different in personality dimensions/items, life style dimensions/items between the four clusters.
(See Appendix)
There is no different in statistics variables between the four clusters.
Results of 2000 to 2002 show that it is certain that the four clusters different in the aspects of personality and life style. This paper gives no unnecessary details. (See appendix)
Brand Analysis
We comprehended that emotional advertising of Uni-president corp. performs well than others, while rational advertising of Wei-chuan corp. manifests the best than
others. In this section, we desire to explore the specialties owning by whom purchase goods of Uni-president and Wei-chuan.
Uni-president ab sour milk
On aggregate, purchasers of uni-president ab sour milk (See Table 22) have an idea that it is an enjoy to do joyful things, want to acquire others’ confirm, believe in expert endorse, agree that Japan products are attractive, educational level of wife higher than that of husband is acceptable, to be used to save, change new hairdo infrequently , do exercise rarely, not fashionable ,and so on. Purchasers of this brand are old-fashion, more passive when facing health issues. When they see informational advertising of Uni-president ab sour milk, they are convinced by expert endorse, further they build up strong brand association and became loyalty group.
Table 22.Consumer analysis of the brand Uni-president ab sour milk Uni-president ab
sour milk 1998 1999 2000 2001 2002
Population statistics
variables No difference No difference High level of education/
High income
No difference No difference
loyalty No difference No difference No difference No difference Higher Ad attractive score No difference Higher No difference No difference No difference Personality Unstable mood
/open and fashion/
gumptious and social
No difference No difference No difference No difference
Life style No difference Annotation A Annotation B No difference Annotation C
(+)stands for that the purchasers of Uni-president ab sour milk agree the item more than non-brand purchasers.
(-)stands for that the purchasers of Uni-president ab sour milk agree the item less than non-brand purchasers.
Significant level is 0.95.
【Annotation A】
1 I always do things with plan(-),2.I like traditional drama(-),4.I can chat cheerfully with someone unfamiliar(-),8.It is a natural phenomenon for male and female dressing differently(-),
34.I often buy patent medicine in pharmacy for the sake of convenience(-),58.It is an enjoyment of doing joyful things(+),66.I am always confused where my money is(-),73.I wish to be confirmed by others(+),74.The goods which is endorsed by experts are nice(+),81.Romantic life is impractical(-),82.It is ok to take care of myself only. I don’t need to be responsible for public.
(-),86. Japan product is fancy and attractive(+),97.I live a regular pattern life(-),107.Caring for spouses is more vital than for children in marriage(-)。
【Annotation B】
5.Fooling around in network and TV game player is the way I spend leisure hours(-),7.My capability is can not catch up with that of others(-),22.Household product purchasing opinions of children are ignored(-),31.The educational level of wife higher than that of husband is acceptable
(+),33.I might take account of buying fashion but impractical products(-),38. Revenue and expenditure of mine are balanced. I have saving behaviors.(+),47.I would rather buy new things than have old things fixed(-)64. I always feel to be short of self space.(-),79.Police should be more compulsory in order to keep law and discipline(+),82. It is ok to take care of myself only. I don’t need to be responsible for public.(-),93. I usually keep watch for billboard of popular songs and blockbuster(-),103.Bringing up children might influence my career(-),106.For the sake of realizing idea, I prefer to give up higher rewards(-),109.It is merely a propaganda for business to participate in public welfare.(+)。
【Annotation C】
17.Watching TV is my major entertainments(+),24.I pay much attention to the atmosphere and layout of restaurants.(-),30.I usually exercise to keep the health(-),34.I read illustration on package carefully when purchasing products.(-),41.I accept the viewpoints of my relatives and friend regularly.(-),47.having nothing to do makes me uncomfortable(-),48.I might pursue further education or on job training actively in order to be promoted.(-),49.I might choose products which is good for health and beauty, even they are not delicious.(-),54.I would be a volunteer in hospital and service association(-),56.I often read books and newspaper in order to get new information
(-),64.On purpose of promoting spirit level, I often read books related to spirit and potential.
(-),65.I don’t like dressing up like others.(-),66.I would buy the product, which make me more beautiful and nicer.(-),68.I am regarded as a fashion person(-),74.One who have high level of education would have greater success opportunity(-),75. Police should be more compulsory in order to keep law and discipline(-),80.I will look for someone to share trivial things without doing all affairs.(-),94.I believed that our education system is fine.(-),95. I like to go vacation near mountain and sea during the holiday.(-),96.I often try changing new hairdo.(-),99. Bringing up children might influence my career(-),100.I use new invest and finance tool actively, not merely saving.(-),104.I would arrange my retirement life properly(-)。