SARCOPENIA PREVALENCE AND ITS ASSOCIATED FACTORS IN AN ELDERLY TAIWANESE METROPOLITAN POPULATION
Cheng-Chieh Lin, MD, PhD,
1,2,3Nai-Hsin Meng, MD,
4Wen-Yuan Lin, MD, PhD,
1,2Chia-Ing Li, PhD,
2,3Chiu-Shong Liu, MPH, MD,
1,2,3Chih-Hsueh Lin, MD,
1,2Chiu-Kai Chang, MD,
4Yih-Dar Lee, MD,
5,6Cheng-Chun Lee, MD,
2,7Tsai-Chung Li, PhD *
8,91 Department of Family Medicine, China Medical University Hospital, Taichung, Taiwan 2 School of Medicine, College of Medicine, China Medical University, Taichung, Taiwan 3 Department of Medical Research, China Medical University Hospital, Taichung, Taiwan 4 Department of Physical Medicine and Rehabilitation, China Medical University Hospital,
Taichung, Taiwan
5 Department of Psychiatry, Medical College, National Cheng-Kung University, Tainan, Taiwan
6 Bristol-Myers Squibb (Taiwan) Ltd, Global Development & Medical Affairs, Taipei, Taiwan
7 Department of Neurology, China Medical University Hospital, Taichung, Taiwan 8 Graduate Institute of Biostatistics, College of Public Health, China Medical University,
Taichung, Taiwan
9 Institute of Health Care Administration, College of Health Science, Asia University, Taichung, Taiwan
* Correspondence to: Tsai-Chung Li, China Medical University, 91 Hsueh-Shih Road, Taichung, 40421, Taiwan, Tel: 886-4-2205-3366 ext 6605, Fax: 886-4-22078539, e-mail:
[email protected]
Short Title: Sarcopenia in an elderly Taiwanese population
Key words: sarcopenia; prevalence; elderly; Taiwanese population
To the Editor: Sarcopenia is defined as the loss of skeletal muscle mass and strength that
occurs with advancing age. This problem is increasingly being recognized in the elderly.
1The European Wording Group on Sarcopenia in Older People (EWGSOP) proposed an algorithm for sarcopenia detection (ASD).
2Sarcopenia is considered to be characterized by a high risk for adverse health outcomes, including falls, fractures, functional decline, increased
mortality, and low quality-of-life scores.
2-3Previous population-based studies have pointed out that the prevalence of sarcopenia ranges between 8% and 50% in persons aged ≥50 years, varying according to ethnicity, place of residence, age, and diagnostic method used.
4-8Taiwan is facing a great gerontological challenge because it has the fastest-aging population in the world. However, no study has reported the prevalence of sarcopenia in Taiwan. This study aimed to determine the prevalence of sarcopenia using the EWGSOP algorithm in a general
elderly population in a Taiwanese metropolitan area.
We performed a cross-sectional survey of a sample comprising 761 ethnic Taiwanese elders aged ≥65 years (65–98 years) who lived in eight administrative units of the North District of Taichung City, Taiwan in 2009. Elders with low muscle mass plus presence of either low muscle strength or low physical performance were defined as sarcopenia.
Presarcopenia was defined as low muscle mass only and severe sarcopenia when the three
conditions were present. Low muscle mass was determined by the skeletal muscle mass index
(SMMI), equal to the appendicular skeletal muscle mass divided by height
2. Skeletal muscle
mass was measured by dual-energy X-ray absorptiometry (GE-LUNAR DPX PRO, Lunar
Corporation, Madison, WI, USA). Low muscle mass was defined if their SMMIs were two standard deviations (SD) or more below the gender-specific means for young adults proposed by Sanada et al.
9Low muscle function was defined as grip strength in the lowest quintile at baseline measured by a handgrip dynamometer (TTM-110D, TTM Co. Japan) according to subgroups of gender and body mass index.
10Low physical performance was measured by the slowest quintile of the population according to subgroups of gender and standing height
based on the walking time to 15 feet.
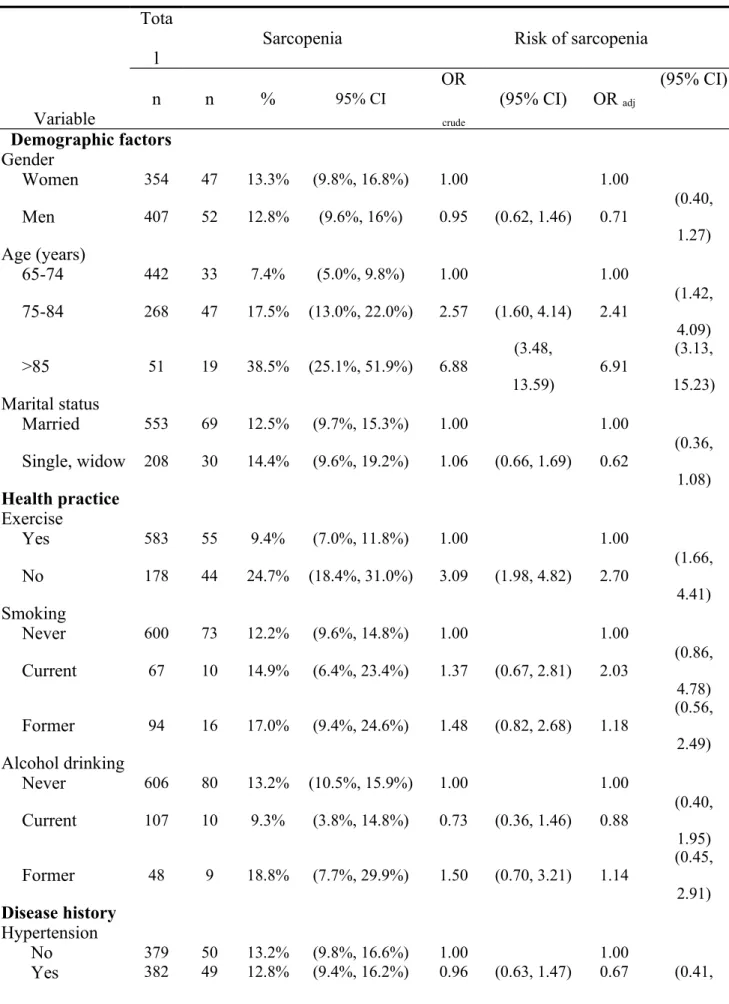
10More than half of the elders were male, aged 65–74 years, married, and with
hypertension. The crude prevalence rates of presarcopenia, sarcopenia, and severe sarcopenia were 6.83%, 6.96%, and 6.04%. The age- and gender-weighted prevalence of sarcopenia (including severe sarcopenia) was 14.4% (13.0%–15.7%). The age-specific prevalence rates of sarcopenia were 6.8%, 14.6%, and 41.7% in men aged 65–74, 75–84, and ≥85 years, as well as 8.1%, 21.4%, and 26.7% in women aged 65–74, 75–84, and ≥85, respectively. After considering the age, gender, marital status, regular exercise, co-morbidity status (diabetes, stroke, heart disease, cataract, and fall history), the following were found to be associated with increased prevalence of sarcopenia (Table 1): older age [odds ratio (OR) = 2.43, 95%
confidence interval (CI) = 1.42–4.15 for 75–84 years; OR = 6.26, 95% CI = 2.75–14.25 for
≥85 years], no regular exercise (OR = 2.62, 95% CI = 1.61–4.26), and fall history (OR =
1.72, 95% CI = 1.03–2.90).
We used the criteria proposed by EWGSOP to evaluate sarcopenia prevalence in an elderly non-institutionalized civilian population of a metropolitan area in Taiwan. Sarcopenia was more common in older age groups, persons without regular exercise, and persons with fall history. These findings suggested that sarcopenia was prevalent among the elderly Taiwanese population and was thus a serious public health challenge in Taiwan metropolitan
areas.
A few surveys have been conducted on diverse community-dwelling populations to estimate sarcopenia prevalence.
4-8In general, our prevalence findings were lower than those in the U.S. (15%–25% for <70 years old and >40% for ≥80 years old in the New Mexico Elder Health Survey) and Mexico (48.5% in women and 27.4% in men), closer to those in the Netherlands (15.7%), but higher than those in France (9.5%) and U.S. (7% for men and 10%
for women in NHANE III). One reason for the divergent prevalence of sarcopenia is the methods of assessing muscle mass. Some of these studies used DXA,
5,7,8some used
bioelectrical impedance,
6and the others used calf circumferences.
4In conclusion, sarcopenia was present in 14.4% of an elderly Taiwanese population aged ≥65
years in a metropolitan area. Substantial variations in the age, regular exercise status, and fall
history were observed. Efforts such as exercise and treatment interventions for sarcopenia are
needed to decrease the adverse effects in this elderly population.
ACKNOWLEDGMENTS
Conflict of Interest: The editor in chief has reviewed the conflict of interest checklist provided by the authors and has determined that the authors have no financial or any other kind of personal conflicts with this paper. This study was supported by grants from the National Health Research Institutes of Taiwan (NHRI-EX98-9838PI), China Medical University (CMU98-S-11 & CMU 99-S-27), and the Taiwan Department of Health Clinical
Trial and Research Center of Excellence (DOH101-TD-B-111-004).
Author Contributions: Study concept and design: CC Lin, TC Li. Analysis and interpretation of data: TC Li, NH Meng, CI Li. Critical revision of the manuscript for important intellectual content: CS Liu, CH Lin, CK Chang, YD Lee, CC Lee. Wrote the paper: CC Lin, TC Li.
Sponsor’s Role: None.
References
[1] Morley JE, Baumgartner RN, Roubenoff R et al. Sarcopenia. J Lab Clin Med 2001;137:231-243.
[2] Cruz-Jentoft AJ , Baeyens JP, Bauer JM et al. Sarcopenia: European consensus on definition and diagnosis: Report of the European Working Group on Sarcopenia in Older People. Age Ageing. 2010;39(4):412-423.
[3] Patel HP, Syddall HE, Martin HJ et al. Hertfordshire sarcopenia study: design and
methods. BMC Geriatr 2010;10:43.
[4] Arango-Lopera VE, Arroyo P, Gutiérrez-Robledo LM et al. Prevalence of sarcopenia in
Mexico City. European Geriatric Medicine 2012;3(3):157-160.
[5] Baumgartner RN, Koelher KM, Gallagher D et al. Epidemiology of sarcopenia among
the elderly in New Mexico. Am J Epidemiol. 1998;147(8):755-763.
[6] Janssen I, Heymsfield SB, Ross R. Low relative skeletal muscle mass (sarcopenia) in older persons is associated with functional impairment and physical disability. J Am
Geriatr Soc. 2002;50:889-896.
[7] Rolland Y, Lauwers-Cances V, Cournot M et al. Sarcopenia, calf circumference, and physical function of elderly woman: a cross-sectional study. J Am Geriatr Soc.
2003;51:1120-1124.
[8] Visser M, Deeg DJH, Lips P. Low vitamin D and high parathyroid hormone levels as
determinants of loss of muscle strength and muscle mass (sarcopenia): The Longitudinal
[9] Sanada K, Kearns CF, Midorikawa T et al. Prediction and validation of total and regional skeletal muscle mass by ultrasound in Japanese adults. European Journal of
Applied Physiology 2006;96:24-31.
[10] Fried LP , Ferrucci L, Darer J et al. Untangling the concepts of disability, frailty, and
comorbidity: implications for improved targeting and care. J Gerontol A Biol Sci Med
Sci 2004;59(3):255-263.
Table 1. Prevalence of sarcopenia based on demographic characteristics and comorbidity Tota
l Sarcopenia Risk of sarcopenia
Variable n n %
95% CIOR
crude
(95% CI) OR
adj(95% CI)
Demographic factors Gender
Women
354 47 13.3% (9.8%, 16.8%) 1.00 1.00Men
407 52 12.8% (9.6%, 16%) 0.95 (0.62, 1.46) 0.71 (0.40,1.27)
Age (years)
65-74
442 33 7.4% (5.0%, 9.8%) 1.00 1.0075-84
268 47 17.5% (13.0%, 22.0%) 2.57 (1.60, 4.14) 2.41 (1.42, 4.09)>85
51 19 38.5% (25.1%, 51.9%) 6.88(3.48,
13.59) 6.91
(3.13, 15.23)
Marital status
Married
553 69 12.5% (9.7%, 15.3%) 1.00 1.00Single, widow
208 30 14.4% (9.6%, 19.2%) 1.06 (0.66, 1.69) 0.62(0.36, 1.08)
Health practice
Exercise
Yes
583 55 9.4% (7.0%, 11.8%) 1.00 1.00No
178 44 24.7% (18.4%, 31.0%) 3.09 (1.98, 4.82) 2.70 (1.66,4.41)
Smoking
Never
600 73 12.2% (9.6%, 14.8%) 1.00 1.00Current
67 10 14.9% (6.4%, 23.4%) 1.37 (0.67, 2.81) 2.03 (0.86, 4.78)Former
94 16 17.0% (9.4%, 24.6%) 1.48 (0.82, 2.68) 1.18 (0.56, 2.49)Alcohol drinking
Never
606 80 13.2% (10.5%, 15.9%) 1.00 1.00Current
107 10 9.3% (3.8%, 14.8%) 0.73 (0.36, 1.46) 0.88(0.40, 1.95)
Former
48 9 18.8% (7.7%, 29.9%) 1.50 (0.70, 3.21) 1.14(0.45, 2.91)
Disease history
Hypertension
No
379 50 13.2% (9.8%, 16.6%) 1.00 1.00Tota
l Sarcopenia Risk of sarcopenia
Variable n n %
95% CIOR
crude
(95% CI) OR
adj(95% CI)
1.09)
Diabetes mellitus
No
642 77 12.0% (9.5%, 14.5%) 1.00 1.00Yes
119 22 18.5% (11.5%, 25.5%) 1.75 (1.04, 2.96) 1.51(0.83, 2.74)
Heart disease
No
540 63 11.7% (9.0%, 14.4%) 1.00 1.00Yes
221 36 16.3% (11.4%, 21.2%) 1.57 (1.01, 2.46) 1.47 (0.89, 2.45)Hyperlipidemia
No
563 77 13.7% (10.9%, 16.5%) 1.00 1.00Yes
198 22 11.1% (6.7%, 15.5%) 0.85 (0.51, 1.41) 0.88 (0.50, 1.55)Arthritis
No
608 81 13.3% (10.6%, 16.0%) 1.00 1.00Yes
153 18 11.8% (6.7%, 16.9%) 0.82 (0.47, 1.44) 0.70 (0.38, 1.29)Stroke
No
718 87 12.1% (9.7%, 14.5%) 1.00 1.00Yes
43 12 27.9% (14.5%, 41.3%) 2.75 (1.36, 5.55) 1.71 (0.77, 3.83)Cataract
No
403 39 9.7% (6.8%, 12.6%) 1.00 1.00Yes
358 60 16.8% (12.9%, 20.7%) 1.88 (1.22, 2.91) 1.25(0.76, 2.06)