國立臺灣大學電機資訊學院光電工程學研究所 碩士論文
Graduate Institute of Photonics and Optoelectronics College of Electrical Engineering and Computer Science
National Taiwan University Master Thesis
應用於折射率感測的穩定封裝之微光纖線圈共振腔 與其長時間穩定性提升
A Stable Packaged Microfiber Coil Resonator for Refractive Index Sensing and Its Long-term Stability
Improvement
呂宣毅 Xuan-Yi Lu
指導教授:王倫 博士 Advisor: Lon A. Wang, Ph.D.
中華民國 106 年 3 月
March, 2017
i
誌謝
能完成這本論文與碩士學業,首先必須要感謝我的父母親,從小到大我的父 母總是為了我不辭辛勞地打理我生活上的大小事,讓我能無後顧之憂地專心於課 業學習與實驗研究,感謝你們的付出和支持。同時,我也要感謝王倫老師的指導,
不僅是實驗上的建議與鼓勵包括了人生態度與對未來生涯的建議,我都會謹記在 心。
感謝宗翰學長讓我有機會可以一探微光纖共振腔這個領域。在進來研究所前 我從未想過原來光纖可以做得僅有數個微米,也沒想過自己有朝一日居然能夠操 控這麼纖細的微光纖來進行研究。學長的指導和傳承下來的研究設備是這個研究 的基石。
感謝實驗室的學長們:建宏、方向、智昇、哲安、志豪、耀宇、彥博、偉弘,
謝謝你們帶領我認識這個實驗室。或許研究的領域各不相同,但是當我請教學長 們問題時,學長們也是盡可能地幫忙我。和學長們相處,讓我感覺實驗室就像是 個大家庭一樣。相信這樣的氣氛會在我們實驗室不斷延續下去。
感謝惟中、永泰、世昌、昇宏。在這個碩士班過程有幸認識你們,和你們一 起歡笑、一起難過、一起努力。大家互相鼓勵、彼此切磋,這些都是能夠讓研究 能夠繼續向前的原因之一。
感謝世昕、健甫、冠宏、建霖。謝謝你們幫忙這個有時表現落漆的學長,給 我研究上的幫助與建議,這些我都銘記在心。
在研究所的這段時間,仔細想想要感謝的人還有很多,應力所育文學長、生 醫電子所的筌凱和柏承、機械工廠的師傅們… …等等,感謝老天爺讓我能夠與 這麼多人結緣。我不是一個太會說話的人,想不出什麼美麗的詞藻來表達對所有 人的感謝之情。在此只能用簡單一句話來作結,謝謝大家。
中文摘要
近來,微光纖線圈共振腔在非線性光學和光纖感測吸引許多目光。和以半導 體製作的微共振腔相比,微光纖線圈共振腔擁有例如低傳輸損耗,容易和一般光 纖元件結合等特點。透過增加線圈數或堆疊線圈,微光纖線圈共振腔可以達到相 當高的品質因子。然而,沒有保護的微光纖線圈共振腔很容易受到外界環境干擾,
限制了微光纖線圈共振腔的應用。因此,微光纖線圈共振腔的保護方法是本篇論 文的主要焦點。
在此論文中,首先我們介紹微光纖線圈共振腔的製作過程和保護方法。我們 利用改良的小型光纖抽絲塔,以氫氧焰作為熱源製作直徑 3 微米的微光纖。接著 我們展示微光纖線圈共振腔的製作架構。透過具有超長工作距離的物鏡和 CCD 元 件,我們可以即時觀測繞線過程,有助於儘早檢測出錯誤。具有良好同心度和穩 定性的繞線系統使我們可以準確地控制微光纖線圈共振腔每圈的間隔。我們使用 以正己烷稀釋過的聚二甲基矽氧烷作為微光纖線圈共振腔的包裝材料。稀釋過的 聚二甲基矽氧烷擁有較低的黏滯性,方便在繞線過程中調整線圈。以此方法製作
的微光纖線圈共振腔品質因子可以達到 5 x 10⁵,而且頻譜表現可以維持 5 天。
接著我們嘗試以聚二甲基矽氧烷包裝之微光纖線圈共振腔進行折射率感測。
將微光纖線圈共振腔放置在一壓克力架構中,並以葡萄糖水溶液作為折射率變化。
微光纖線圈共振腔的偵測極限為 7 x 10⁻⁴。為了增加微光纖線圈共振腔應用的潛
力,我們將剩餘微光纖部分以紫外光固化膠覆蓋,進一步提升微光纖線圈共振腔 的穩定性。如此微光纖線圈共振腔的表現可以維持長達一個月沒有明顯劣化。
關鍵字:微光纖、微光纖線圈共振腔、高品質因子、折射率感測、微光纖封裝方 法
iii
Abstract
Recently, microfiber coil resonators (MCR) have attracted much attention in
nonlinear optics and optical sensing. Compared with the semiconductor based micro
resonators, MCRs have attractive properties such as low propagation loss and easy
connection with conventional optical fiber devices through their tapered sections.
Moreover, by increasing coil turns or stacking microfiber turns, MCRs can achieve very
high quality factor. However, an unpackaged MCR is easily affected by surrounding
disturbance, which limits its applications. Therefore the methods to protect MCRs is
the main focus of this work.
In this work, we firstly introduce fabrication process and protection method of
MCR. A 3-μm diameter microfiber was produced by using a modified miniature fiber
drawing tower. The hydrogen oxygen flame was applied as heat source. Then the
experimental setup for fabricating MCR is demonstrated. With the extra long working
distance objective and CCD, the coiling process could be observed in situ. This helps
us early detect the faults during coiling process. The coiling system with good
concentricity and stability helps us control the microfiber coil accurately.
Polydimethylsiloxane (PDMS) diluted with hexane was used as package material for
MCR. Hexane-diluted PDMS has lower viscosity so the microfiber coil could be turned
around easily. The quality factor of PDMS-packaged MCR was 5 x 10⁵ and could
maintain for 5 days.
Next, we tried to use PDMS-packaged MCR as refractive index sensor. PDMS-
packaged MCR was put in a PMMA structure and glucose solutions were used for
different refractive index. The detection limit of PDMS-packaged MCR was about
7×10⁻⁴ RIU. To increase the potential of practical applications, long-term stability of
MCR was further improved by protecting microfibers with UV glue. The performance
of MCR could maintain over a month without degradation.
Key words: microfiber, microfiber coil resonator, high quality factor, refractive index
sensing, microfiber package method
v
Statement of Contribution
1. Develop the package method for microfiber coil resonator and improve the long-
term stability. The result had been poster presented in MOC 2015.
2. Cooperate with the group of Prof. A. B. Wang in NTU to fabricate micro-two-phase
flow detection by microfibers in microfluidic chip. The result had been published
on the journal Sensors and Actuators B: Chemical 2016.
CONTENT
誌謝 ... i
中文摘要 ... ii
Abstract ... iii
Statement of Contribution ... v
CONTENT ... vi
LIST OF FIGURES ... viii
LIST OF TABLES ... xi
LIST OF ABBREVIATIONS ... xii
Chapter 1 Introduction ... 1
1.1 Motivation ... 1
1.2 Literature Review ... 5
1.2.1 Microfiber Resonator-based Sensors ... 5
1.2.2 Package Materials of Microfiber Device ... 6
1.3 Theory of MCRs... 8
1.4 Organization of the Thesis ... 14
Chapter 2 Fabrication and Optical Characteristics of PDMS-packaged MCRs . 15 2.1 Fabrication of PDMS-packaged MCRs... 15
2.2 Optical Characteristics of PDMS-packaged MCRs ... 23
vii
3.1 Experimental Setup of Refractive Index Sensing ... 27
3.2 Measurement Results and Discussion ... 33
3.3 Long-term Stability Improvement ... 43
Chapter 4 Conclusions and Future Work ... 50
References ... 52
LIST OF FIGURES
Fig. 1-1 A schematic diagram of single layer MCR... 4
Fig. 1-2 A schematic diagram of MCR. ... 13
Fig. 2–1 Photograph of modified miniature fiber drawing tower. ... 16
Fig. 2-2 (a) Schematic setup for fabrication of MCRs... 19
Fig. 2-2 (b) Photograph of the fabrication system. ... 20
Fig. 2-3 Top view of V-shaped groove carved on the Teflon bar. ... 21
Fig. 2-4 Photograph of bevel of Teflon bar………21
Fig. 2-5 Photograph of a bare MCR after ethanol was dropped on it. ... 22
Fig. 2-6 Photograph of PDMS-packaged MCR with 3 turns. ... 22
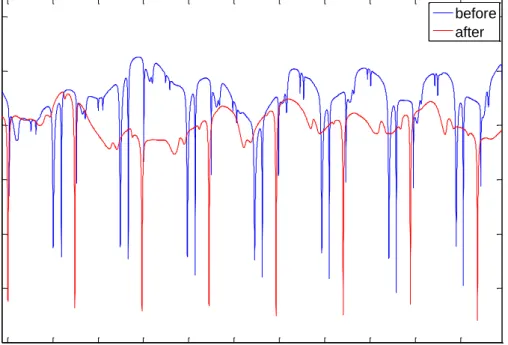
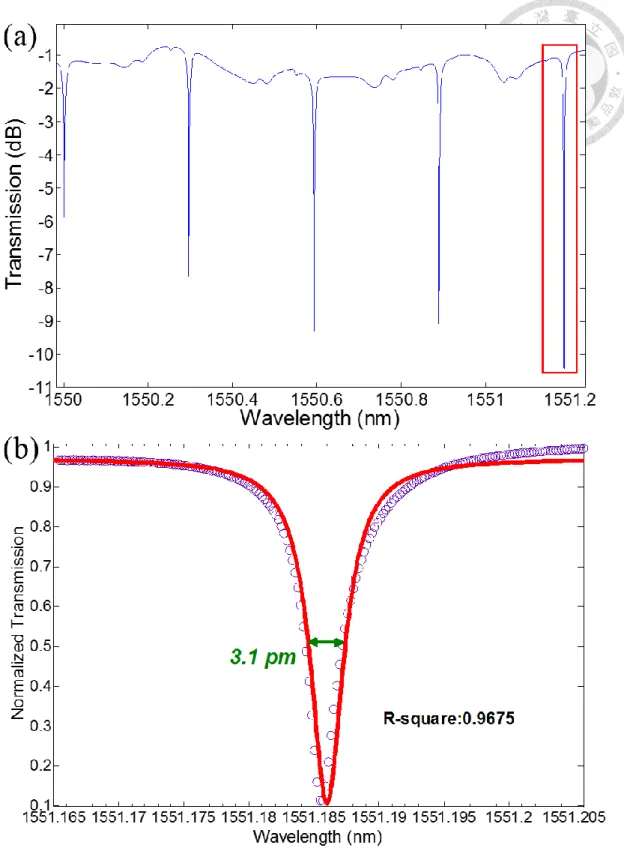
Fig. 2-7 Transmission spectra of MCR before (blue line) and after (red line) curing. 24 Fig. 2-8 (a) Transmission spectrum of PDMS-packaged MCR and (b) one resonant dip and its Lorentz curve fitting……… ... 25
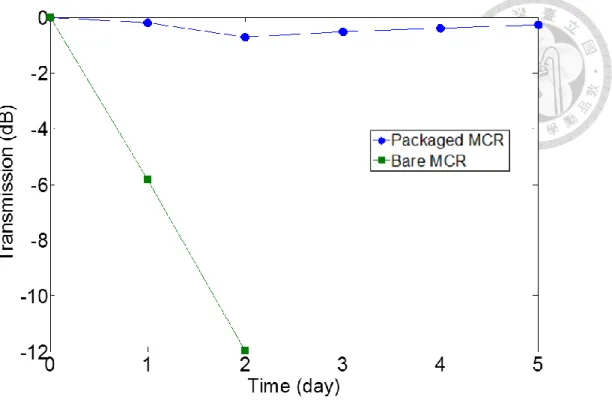
Fig. 2-9 Power evolutions of a bare and a PDMS-packaged MCRs over 5 days measured in 1550 nm wavelength……… ... ……26
Fig. 2-10 Transmission spectra of simulation (red line) and PDMS-packaged MCR (blue line)……….. ... 26
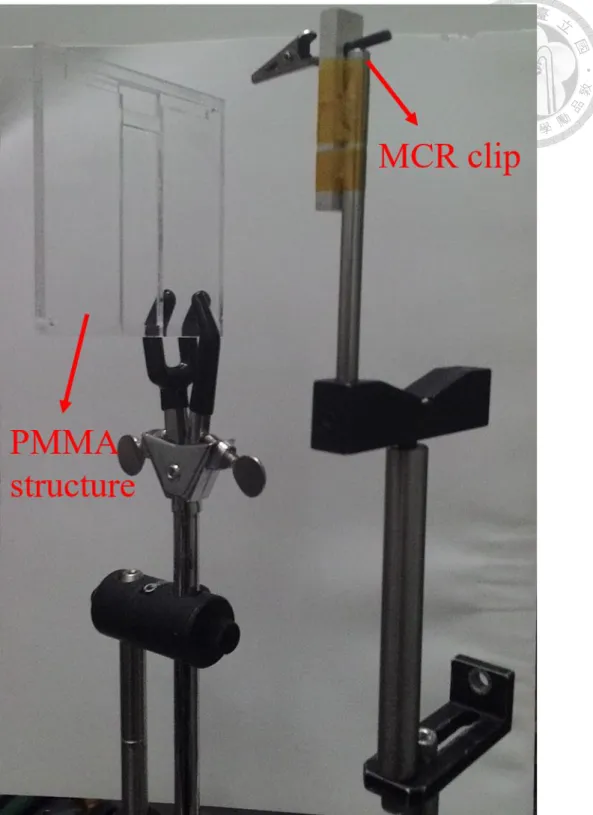
Fig. 3-1 Photograph of 4-layer PMMA structure and MCR clip. ... 29
ix
Fig. 3-2 Dimensions of four PMMA plates for PMMA structure. ... 30
Fig. 3-3 (a) Photograph of PDMS-packaged MCR in PMMA structure. (b) Close-up
Photo of PDMS coating zone and RI sensing region. ... 31
Fig. 3-4 Photograph of a PDMS-packaged MCR during RI sensing. ... 32
Fig. 3-5 Transmission spectrum of PDMS-packaged MCR before RI sensing. ... 36
Fig. 3-6 (a)-(e) Measured transmission spectra of PDMS-packaged MCR in each
glucose solutions of first measurement. (f) The shifts of the resonant dip in the
transmission spectra………..………37
Fig. 3-7 (a)-(e) Measured transmission spectra of PDMS-packaged MCR in each
glucose solutions of second measurement. (f) The shifts of the resonant dip in the
transmission spectra………..………38
Fig. 3-8 (a)-(e) Measured transmission spectra of PDMS-packaged MCR in each
glucose solutions of third measurement. (f) The shifts of the resonant dip in the
transmission spectra………..………39
Fig. 3-9 Dependence of the measured wavelength shifts on the refractive index of
glucose solutions and its linear fit to the data ………. ... 40
Fig. 3-10 Microscopic image of microfiber in the RI sensing region after RI sensing...40
Fig. 3-11 Photograph of microfibers after they were immersed in 30% glucose solution
and deionized water………..41
Fig. 3-12 Transmission spectra of PDMS-packaged MCR before and after RI
sensing………..41
Fig. 3-13 Lorentz curve fittings of (a) dip A and (b) dip B. ... 42
Fig. 3-14 Photograph of U-shaped Aluminum and MCR clip. ... 46
Fig. 3-15 Photograph of package system. ... 46
Fig. 3-16 Photograph of microfiber in PDMS with micro-bending... 47
Fig. 3-17 Photograph of PDMS-packaged MCR on UV glue coating substrate. ... 47
Fig. 3-18 (a) Transmission spectrum of PDMS-packaged MCR and (b) one resonant dip and its Lorentz curve fitting….. ... 48
Fig. 3-19 Transmission spectra of the original PDMS-packaged MCR with protection and the same one after one month……... 49
xi
LIST OF TABLES
Table 3-1 Refractive indices for the glucose solutions with different
concentrations. ………31
Table 3-2 Values, averages and standard deviations of wavelength shift at different
glucose solutions. ………36
LIST OF ABBREVIATIONS
MCR Microfiber coil resonator
PDMS Polydimethylsiloxane
FSR Free spectral range
FWHM Full width at half maximum
CCD Charge-coupled Device
PMMA Polymethylmethacrylate
PE Polyethylene
1
Chapter 1 Introduction
1.1 Motivation
Since the prediction of their low losses by Kao and Hockham [1], optical fibers
have been developed for enormous applications comprising the fields of
telecommunications [2], lasers [3], gratings [4], and sensors [5], etc. Compared with
electrical wires, optical fibers have the advantages of extremely high bandwidth and
large data carrying capacity, low loss for long distance transmission, no crosstalk and
low bit error rates, immunity to electromagnetic interference, difficult to eavesdrop for
signal security, small size and low weight, and so on. Other than the above-mentioned
advantages for telecommunication, fiber optic components also benefit from those
characteristics and therefore we can produce many useful devices such as polarizers,
couplers, isolators, circulators, filters, interferometers, modulators and amplifiers [6, 7].
These devices form the physical layer of an optical distribution network, an important
sector for the Internet.
Contrary to using optical fiber in telecommunication, the use of optical fiber in the
scale of several micrometers is much struggled. When the optical fibers were used as
components or sensors, sometimes they needed to be bent for more efficient
performance. However, the diameter of optical fiber (typically 125 μm) is limited to the
minimal bending radius. A single-mode bend optimized fiber can be bent down to
radius of curvature of 12 mm with low loss and long lifetime [8]. Bending radius
smaller than 10 mm will increase the loss and the fiber would be easily broken [9].
Microfiber is therefore an interesting research topic to solve the problem that
conventional optical fiber cannot achieve. Its diameter ranges from tens of nanometers
to several micrometers. Most of the optical fiber components can be miniaturized by
replacing optical fibers to microfibers. The dimension of microfiber makes it much
suitable to be a sensor due to its large evanescent field, which improves sensitivity. A
large evanescent field will propagate in the surface of microfiber which strongly
interacts with the environment.
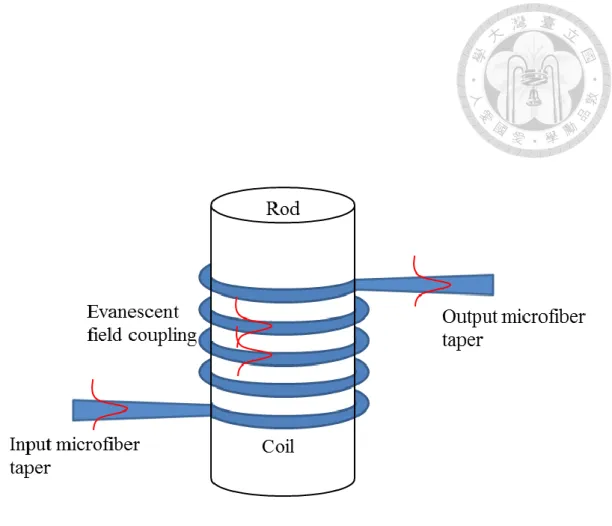
Recently, microfiber coil resonators (MCR) have attracted much attention in
nonlinear optics [10] and optical sensing [11-13]. An MCR is usually fabricated by
coiling a microfiber on a rod, and its resonance is caused by optical coupling of the
evanescent field of adjacent microfibers. A schematic diagram of MCR is shown in Fig.
1-1. Compared with the semiconductor based micro resonators, MCRs have attractive
properties such as low propagation loss and easy connection with conventional optical
fiber devices through their tapered sections. Moreover, by increasing coil turns [14] or
3
an unpackaged MCR is easily affected by surrounding disturbance, which limits its
applications. Therefore it is very important to find methods to protect MCRs. Some low
refractive index materials, such as Teflon AF (amorphous fluoroplastics) [16] and UV
glues [17], have been used to package MCRs. Depending on the type of Teflon AF, the
typical molding temperature is 240℃ or higher. For fully curing, UV glues need high
power UV light source.
In this thesis, we will introduce a low cost and easy alternative which use
polydimethylsiloxane (PDMS) to package MCR. The optical characteristics and
refractive index sensitivity of PDMS-packaged MCR were measured. To further
improve the stability of whole structure, the rest of microfiber was covered with UV
glue.
Fig. 1-1 A schematic diagram of single layer MCR.
5
1.2 Literature Review
Microfibers have been studied for a decade [18-21] and it can still be regarded as
an important topic. The research of microfibers mainly focused on the fabrication
methods, microfiber-based devices, sensor applications, nonlinearity, etc. Several
groups started the research and more and more researchers have been involved in recent
years. Here are the significant results of these research groups listed thereinafter.
1.2.1 Microfiber Resonator-based Sensors
There are three types of microfiber resonators, namely loop, knot and coil
resonators. For sensing applications, microfiber resonators can provide high sensitivity,
low detection limits due to high quality factors, and good wavelength selectivity due to
small resonant bandwidths.
Sensors based on microfiber resonators have been investigated for different
applications, for example, they could serve as refractive index sensors [22-26],
temperature sensors [24, 27], current sensors [28-31], humidity sensors [32-34],
chemical sensors [35], gas sensors [36], and magnetic field sensors [37, 38]. Most of
them are based on refractive index detection because of large evanescent field outside
the microfiber which makes it easy to detect the variation of surrounding refractive
index. The refractive index change will change the loss or resonant dip of light spectrum
in microfiber resonators. The thermal expansion coefficient and thermal optic
coefficient of silica are lower. To be a temperature sensor, microfiber resonator should
be embedded in polymer with high thermo-optic coefficient. The working principle of
current sensor is similar to temperature sensor. Heat generated from electrical current
results in thermo-optic effect and thermal expansion effect, which make resonant dip
shift. As a humidity sensor, the microfiber resonators should be coated with polymer
materials with high humid sensitivity [32, 34] or alternatively using polymer microfiber
[33]. As the same concept, microfiber resonator could be a gas sensor if coated with
materials sensitive to specific gas. For instance, microfiber knot resonator coated with
Pd layer would be sensitive to hydrogen concentration [36]. The magnetic field sensor
is based on refractive index change. Microfiber knot resonator is immersed in a
magnetic fluid, and under applied magnetic field, the refractive index of magnetic fluid
will be changed, which induces resonant dip shift.
1.2.2 Package Materials of Microfiber Device
The environment will severely affect the loss of microfiber. Particle would adhere
to microfiber, which increases the scattering loss. The hydroxyl bonds would generate
to increase the loss of microfibers under humid condition. Besides, the microfiber
7
structure is vulnerable to surrounding disturbance. Therefore, it is necessary to package
microfiber devices to maintain their performance. Basically, the materials used to
package microfiber devices should have low refractive index. Some low refractive
index materials have been used, such as Teflon AF [16], UV glue [17], and aerogel [39].
Some materials could not only protect microfiber devices but also improve the
performance of devices. Hernández-Romano et. al. packaged their microfiber-based
temperature sensor by covering PDMS because of its high thermo-optic coefficient [40].
Cham et. al. used microfiber knot resonator coated with polyaniline as an alcohol
concentration sensor since polyaniline could generate chemical bond with alcohol [35].
1.3 Theory of MCRs
Microfiber coil resonator is the most complex and also the only 3-dimentional
microfiber-based resonator among other types of microfiber resonators. Its unique 3-
dimensional structure provides several special applications [41]. In this section, we will
study the theory of the MCR.
The transmission properties of MCR can be expressed by using coupled mode
equations [42]. An MCR consisting of M turns of microfiber is shown in Fig. 1-2.
Assume the coupling between non-adjacent turns can be ignored. The corresponding
light field amplitude of the m-th turn is Am(s) which satisfies the set of following
equations [43].
9
1 12
21 23
2
32
1
2, 1
1, 2 1, ( )
, 1
0 ( ) 0 ...
( )
( ) 0 ( ) ...
( )
0 ( ) 0 ...
( ) ...
0 0 0 ...
( ) 0 0 0 ...
0 0 0 ...
( )
0 0 0
0 0 0
0 0 0
0 ( ) 0
( ) 0
0 ( )
m
M M
M M
M M M M s
M M
A s s
s s
A s d s
A s i
ds
A s
A s
s s
s
1 2
1
( ) ( )
( )
( ) 0 ( )
m
M M
A s A s
A s
A s
A s
(1-1)
where (s) is the coefficient of coupling between the adjacent turns of MCR and is
defined as
)) ) ( , )) (
( , ( (
) ) , ( )
, ( 2 (
1
)]
) ( , ( ) , (
)) ( , ( ) , ( 2 [
) ) (
(
0 0 0
2 0
0 0
0 2 0
2 2 2
2 2 2
2 2 2
y s p y x F x
s p y x y F
x yF y x r xF
d n
s p y x F y x F
s p y x F y x F n dxdy
s n
x y r
y x
y x
eff
y y
r y x
x x
e eff
(1-2)
where the transversal mode F0(x, y) is normalized as
( , ) ( , ) ( , ) ( , )
12 2
0 0
0
0
y x
y y
x
x x y F x y F x y F x y
F
dxdy
(1-3)
In E q. (1-3), neff and ne are the effective refractive index of the microfiber and the
external refractive index, respectively, and the second integral is taken along the circle
at the surface of the microfiber. F0x(x, y) and F0y(x, y) are the x-direction and y-direction
components of the transversal modes and
p (s )
is the local pitch of the coil. Note that,for the microfiber coil resonators, the output of the i th coil is always equal to the input
of the (i+1) th coil, there exists the following continuity conditions [43]
0 0 0 0 0 0
) 0 (
) (
) (
) ( ) (
) (
) (
) (
0 0
0 0 0 0
0 0 0
0 0 0
0 0 0 0
0 0 0
0 0 0 0
0 0
0 0 0 0
0 0
0 0 0 0
0 0
0 0 0 0
0 0 0
) 0 (
) 0 (
) 0 ( ) 0 (
) 0 (
) 0 (
) 0
( 1
1 2 4 3 2 1
1 2 4 3 2 1
A
A A A A A A A
e e e
e e
A A A A A A A
M M M
i i i
i i
M M M
(1-4)
where β is the propagation constant of the fundamental mode and is the perimeter
of each turn. The input electric field amplitude is given by A1(0). By solving the
equations above, the MCR transmissivity T is given by
1
( ) (0)
A
me
iT A
(1-5)
By using the equations and boundary conditions stated above, we can derive the
transmission properties of an MCR.
For an optical resonance cavity, the resonance condition is satisfied when the
round-trip length of the cavity is equal to an integer multiple of the optical wavelength
inside the medium. Once the resonance condition is satisfied, a series of Lorentzian-
11
shaped transmission curves evenly spaced by the free spectral range (FSR) in the
frequency domain. The free spectral range is defined as follows
2
e f f
F S R
n L
(1-6)
where is the optical wavelength; L is the round trip length of the resonator cavity;
neff is the effective refractive index of the mode propagating in the cavity.
The bandwidths (FWHM) of resonance dips characterize the storage time as the
photons propagate inside the cavity and the quality factor is defined as the optical
wavelength over the FWHM of the resonance dip of the cavity. The larger quality factor,
the longer time of the photons propagating inside the cavity and the more energy is
stored. The maximum achievable quality factor of an optical resonator is named as the
intrinsic quality factor Qint, which is defined as [44]
int
Stored energy
Q Power loss
(1-7)
where ω is the radian frequency; α is the power loss per unit length and is the
propagation constant.
When a resonator is coupled to an external field, the quality factor further
decreases due to the loss imported by the coupler. Thus the quality factor is called the
external quality factor Qext, which can be defined as
2,
( )
ext
m
Q L K L
K K
(1-8)
where K is the average coupling parameter; Km is the optimal average coupling
parameter;
is the coupling coefficient. As a result, the final measured quality factorQload is made up of these two components
𝑄
𝑙𝑜𝑎𝑑−1= 𝑄
𝑖𝑛𝑡−1+ 𝑄
𝑒𝑥𝑡−1(1-9)
When Qload is equal to Qint, the quality factor is maximized and it only depends on
the power loss and operating wavelength. Thus, to achieve the maximum quality factor
of an optical resonator, the first priority is to minimize the loss and to make the average
coupling parameter approaching to the optimal value.
13
Fig. 1-2 A schematic diagram of MCR.
1.4 Organization of the Thesis
In this thesis, the fabrication of PDMS-packaged microfiber coil resonator with
high quality factor is described in details. The refractive index sensitivity of PDMS-
packaged MCR is measured and the long-term stability is further improved. Chapter 1
describes the motivation of this thesis and includes literature reviews on up-to-date
results reported by other groups worldwide. The theory of MCR is also introduced in
Chapter 1. In Chapter 2, the fabrication process of PDMS-packaged MCR is described
and the optical characteristics are shown. Chapter 3 shows experiment setup of
refractive index sensing and measurement results. The package setup for the rest of
microfiber was developed to improve the long-term stability. Chapter 4 is the
conclusion of this thesis and future works.
15
Chapter 2 Fabrication and Optical Characteristics of
PDMS-packaged MCRs
2.1 Fabrication of PDMS-packaged MCRs
The fabrication process of PDMS-packaged MCR contains two parts, fabrication
of microfiber and coiling process of PDMS-packaged MCR. The microfibers were
produced by flame drawing technique with a modified miniature fiber drawing tower
since such microfiber could have better surface smoothness and lower propagation loss.
Fig. 2-1 shows the experiment setup of a modified miniature fiber drawing tower. The
preform used in the experiment was a single-mode optical fiber with core/cladding diameter of 8.2 μm / 125 μm. The hydrogen oxygen flame was applied as heat source.
The process of fiber drawing and properties of the microfibers were described in detail
in our previous work [45]. By carefully controlling each parameters of drawing tower,
a biconical microfiber was fabricated with diameter smoothly varied from the original
125 μm to ~3 μm at the waist section. The waist section could extend over ~150 mm
long. The relatively longer waist length could coil more turns on a millimeter-sized
silica rod. Before coiled on a silica rod, the microfiber should be cleaned because some
particles might be adhered on the surface of microfiber. When the light propagates in
the microfiber, these particles become scattering points and increase propagation loss.
Ethanol was used to clean these particles on the surface of microfiber.
Fig. 2–1 Photograph of modified miniature fiber drawing tower.
17
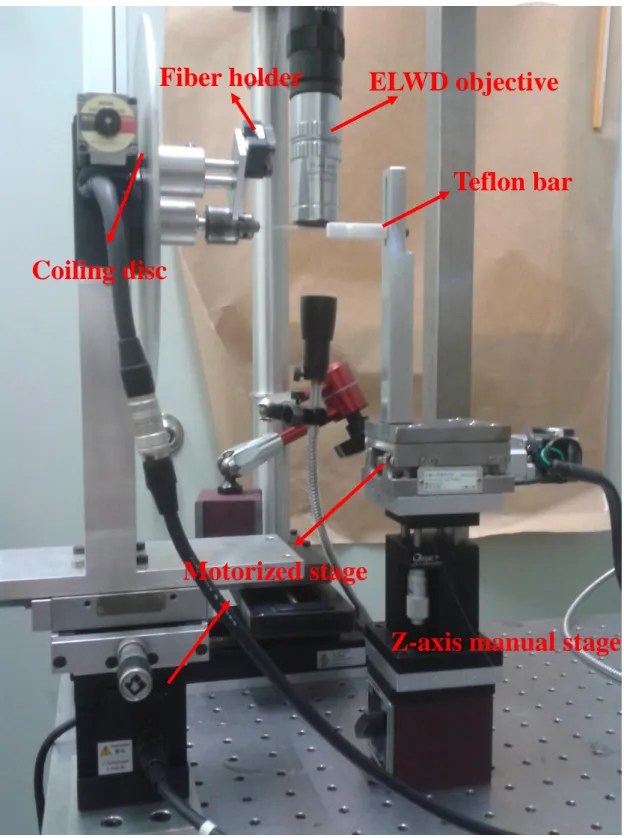
Fig. 2-2 (a) and (b) show the schematic diagram for the fabrication of MCR and
the photograph of the fabrication system respectively. A fiber holder, a coiling disc, and
a socket set to clamp the rod were connected with a rotation stage. The whole structures
mentioned above were designed to achieve good concentricity and stability. The
assembly steps of each components and calibration method were described in detail in
our prior work [45].
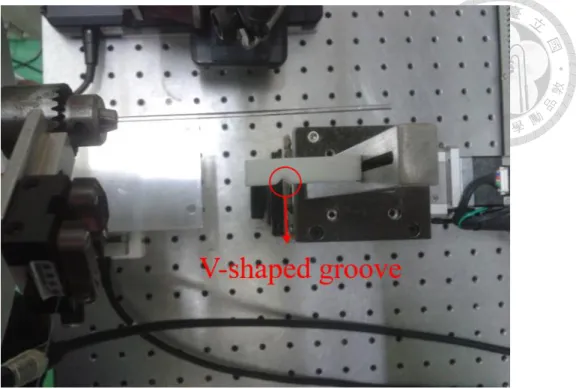
A Teflon bar (n ~1.3) fixed on a motorized stage was used to control the gaps
between microfibers. A V-shaped groove was carved on the Teflon bar. The microfiber
was caught in the V-shaped groove by tension. Fig. 2-3 shows the top view photograph
of the V-shaped groove. A manual z-axis stage was mounted beneath the motorized
stage to make the Teflon bar and silica rod at the same height. As shown in Fig. 2-4, a
bevel was placed at each corner of the Teflon bar to prevent microfiber from damage.
During the coiling process, the gap between microfibers was observed by a
monocular microscope and a CCD. To have enough space to coil microfiber and enough
resolution to identify gap, an extra long working distance objective was chosen. With
the help of these devices, the coiling process could be observed in situ.
For a bare MCR, the structural stability is maintained by the Van der Waals force
between microfibers and PDMS-coated silica rod. The weak stability makes it hard to
take MCR from coiling disk without changing structure. Fig. 2-5 shows the result after
a 0.1 μL ethanol dropped on a bare MCR. The MCR turns were misplaced, which would
severely affect the performance of MCR. Therefore, proper packaging MCR is essential
before MCR applications.
A silica rod with diameter 1.8 mm was used as a cylindrical brace and coated with
PDMS to avoid mode leakage between microfiber coil and silica rod. The lower part of
microfiber was placed in the V-shape groove on the Teflon bar, and then the upper part
was fixed on the fiber holder. Before coiling process started, the PDMS-coated silica rod was spread with 0.1 μL hexane-diluted PDMS by pipette. The uncured hexane-
diluted PDMS was used as package material. A PDMS pre-polymer to curing agent
ratio of 10:1 was used. The dilution ratio of PDMS to hexane by weight was 2:1. The
purpose of diluting PDMS with hexane is to reduce the viscosity of PDMS [46]. During
coiling process, the microfiber coil should be turned back when the faults were detected.
If PDMS was spread without dilution, the microfiber would stick on rod and the coil
could not be turned around. Hexane-diluted PDMS has lower viscosity so the
microfiber coil could be turned around easily.
During the coiling process, the microfiber coil immersed in the uncured hexane-
diluted PDMS. Then MCR in hexane-diluted PDMS was cured by infrared heat lamp
for 2 hours. Fig. 2-6 shows the photograph of a PDMS-packaged MCR by coiling 3 μm
19
Fig. 2-2 (a) Schematic setup for fabrication of MCRs.
Fig. 2-2 (b) Photograph of the fabrication system.
ELWD objective
Teflon bar Fiber holder
Coiling disc
Z-axis manual stage
stage
Motorized stage
21
Fig. 2-3 Top view of V-shaped groove carved on the Teflon bar.
Fig. 2-4 Photograph of bevel of Teflon bar.
Fig. 2-5 Photograph of a bare MCR after ethanol was dropped on it.
Fig. 2-6 Photograph of PDMS-packaged MCR with 3 turns.
23
2.2 Optical Characteristics of PDMS-packaged MCRs
To measure the transmission spectrum of a PDMS-packaged MCR, a tunable
continuous wave laser source (Phoenix 1400, LUNA) controlled by a desktop computer
was used as light source. An isolator was used to prevent the laser source from damage
because of back-reflection. The transmission spectrum was detected by the built-in
photodetector in the tunable laser source. Fig. 2-7 shows the transmission spectra of the
MCR before and after curing the hexane-diluted PDMS. The difference between two
spectra might result from the hexane-diluted PDMS. During the curing process, hexane-
diluted PDMS slowly flowed due to gravity, which might change the resonant condition.
The measured transmission spectrum of PDMS-packaged MCR is shown in Fig.
2-8 (a). The free spectral range was 0.295 nm, and the extinction ratio was ~10 dB.
Lorentzian curve fitting was applied to determine the bandwidth of dip. As seen in Fig.
2-8 (b), the bandwidth of the resonant dip at 1551.186 nm was 3.1 pm and the quality
factor (λ/Δλ) was ~510,000. To verify the stability of PDMS-packaged MCRs, the
power evolution of bare and PDMS-packaged MCRs were recorded over 5 days at 1550
nm. As shown in Fig 2-9, the transmission power of a bare MCR decreased at the rate
of ~0.25 dB/hr, while a PDMS-packaged MCR almost remained at the same level. The
result showed that packaging MCR with PDMS could prevent MCR from degradation.
Fig. 2-10 shows both the simulated and the experimental results. The simulation
was computed by Matlab. The parameters used in the simulation were the same as those
in the experiment, namely rod diameter 1.8 mm, microfiber diameter 3 m and PDMS
refractive index 1.402. Compared with the simulated result, some resonance dips of
experimental spectrum are suppressed and have blue shift. This might be attributed to
the flow of hexane-diluted PDMS during curing process.
Fig. 2-7 Transmission spectra of MCR before (blue line) and after (red line)curing.
1550 1550.21550.41550.61550.8 1551 1551.21551.41551.61551.8 1552 1
2 3 4 5 6
Wavelength (nm)
Power (mW)
20150529-mcr-bf1
before after
25
Fig. 2-8 (a) Transmission spectrum of PDMS-packaged MCR and (b) one resonant dip and its Lorentz curve fitting.
Fig. 2-9 Power evolutions of a bare (green) and a PDMS-packaged (blue) MCRs over 5 daysmeasured in 1550 nm wavelength.
Fig. 2-10 Transmission spectra of simulated (red line) and measured (blue line) PDMS- packaged MCR.
27
Chapter 3 Refractive Index Sensing and Long-term
Stability Improvement
3.1 Experimental Setup of Refractive Index Sensing
MCRs with high quality factor have sharp dips at resonant wavelengths. Such
sharp dips implies the small amount of resonant wavelength shifts could be
distinguished. So high-Q MCRs could serve as refractive index sensors with low
detection limit.
To measure the sensitivity of PDMS-packaged MCR to refractive index (RI)
variation, a PDMS-packaged MCR was taken from coiling system gently and then fixed
on a clip shown in Fig. 3-1. To make the sensing structure more stable, a four-layer
polymethylmethacrylate (PMMA) structure was used to support the PDMS-packaged
MCR for analyte detection. The dimensions of four PMMA plates are shown in Fig. 3-
2. The PMMA structure was fabricated by bonding four 2 mm thickness PMMA plates
in sequence. Fig. 3-3 (a) and (b) show the photographs of PDMS-packaged MCR in the
PMMA structure. The red part of PMMA structure in Fig. 3-3 (b) was coated with
PDMS to avoid light leakage when microfibers touched this region.
For the experiment of RI sensing, the glucose solutions with different
concentrations were used as the surroundings in order to have RI ranged from 1.33 to
1.34. Table 3-1 shows the concentrations expressed in mass fraction and the
corresponding RIs, which were measured by using a portable refractometer (RA-130,
Kyoto Electronics) and data were taken five times for each concentration and then
averaged. The averaged results show small standard deviations.
Next, the glucose solutions were slowly dropped into RI sensing region as shown
in Fig. 3-3 (b) by using pipet until solutions were filled in the sensing region. Then the
packaged MCR was directly immersed in the glucose solutions. Fig. 3-4 shows the
photograph of a PDMS-packaged MCR during RI sensing. The transmission spectra of
PDMS-packaged MCR in each glucose solutions were measured three times. These
transmission spectra were measured by using the same PDMS-packaged MCR. After
each measurement of the solution of a given RI, the solution was pumped out and the
PDMS-packaged MCR was flushed gently with deionized water.
29
Fig. 3-1 Photograph of 4-layer PMMA structure and MCR clip.
Fig. 3-2 Dimensions of four PMMA plates for PMMA structure.
31
Fig. 3-3 (a) Photograph of PDMS-packaged MCR in PMMA structure. (b) Close-up photo of PDMS coating zone and RI sensing region.
Concentration (w/w %) Refractive Index (avg.) Standard Deviation
0 1.3332 0.000109
2 1.3355 0.000040
4 1.3382 0.000074
6 1.3412 0.000048
8 1.3437 0.000040
10 1.3468 0.000080
Table 3-1 Refractive indices for the glucose solutions with different concentrations.
Fig. 3-4 Photograph of a PDMS-packaged MCR during RI sensing.
33
3.2 Measurement Results and Discussion
The transmission spectrum of PDMS-packaged MCR before RI sensing is shown
in Fig. 3-5. The averages and standard deviations of wavelength shifts for different
glucose solutions are listed in Table 3-2. Fig. 3-6, 3-7 and 3-8 show the measured
transmission spectra of the PDMS-packaged MCR in each glucose solutions and the
shifts of the resonant dips in the transmission spectra which were measured three times
for each. These spectra correspond to the wavelength shift in Table 3-2. The resonant
dips shifted to longer wavelengths as the glucose concentration increased. The spectrum
of PDMS-package MCR exposed in air is not shown in the figure for the clear display
of the dips in the range of 1546.92-1547.01 nm. To estimate the sensitivity of the
PDMS-packaged MCR, the average wavelength shift and standard deviations of each
RI in Table 3-2 were fit and plotted and the result is shown in Fig. 3-9. The slope of the
linear fit is 5.592 nm/RIU and it corresponds to the sensitivity of PDMS-packaged
MCR. In a previous study by Fei Xu et. al., a Teflon-coated MCR has been applied as
a refractometric sensor with quality factor ~ 104. The measured refractive index ranged
from 1.345 to 1.349 and sensitivity was about 40nm/RIU [22]. The main reason of low
sensitivity is due to the high quality factor of packaged MCR. A resonator with high
quality factor has better optical confinement; however, high sensitivity requires more
evanescent field to interact with the analytes [47], which implies less optical
confinement. Therefore, there is a trade-off between quality factor and sensitivity. The
other reason is that the PDMS packaging limits the interaction between evanescent field
and analytes. The PDMS packaging layer reduces the overlap between evanescent field
outside microfiber and analytes, which equivalently decreases the effective index
change of the propagating modes in MCR. The microfiber-based resonator with high
quality factor is thus better used for the application which need detection limit due to
its narrower bandwidth. The detection limit 1/P is defined as [47]:
1/𝑃 ≡ FWHM/𝑆
where FWHM is the bandwidth of MCR and S is the sensitivity. The larger P is, the
lower the detection limit is. For our PDMS-packaged MCR with quality factor
~500,000, the detection limit is about 7×10⁻⁴ RIU. Detection limit reported in Ref. 22
was about 4x10⁻³ RIU. Compared with Ref. 22, our PDMS-packaged MCR has a lower
detection limit due to higher quality factor.
The recycle ability of PDMS-packaged MCR in RI sensing is remained to be
solved. During RI sensing, microfibers extended from PDMS-packaged MCR were also
immersed in glucose solutions and some particles might attach on microfibers. As
shown in Fig. 3-10, these particles were difficult to be totally removed even with
35
photograph of two microfibers after they were immersed in 30% glucose solution and
deionized water separately. It is obvious that more particles were adhered to microfiber
after immersed in glucose solution. Also, microfiber drawing process might alter the
silica surface by formation of hydroxyl group. Hydroxyl group would enhance the
interaction between analyte and silica because of attractive forces, which makes
particles adhere to microfiber more likely [48]. The additional scattering loss due to
these particles had negative impact on the performance of PDMS-packaged MCR. As
shown in Fig. 3-12, the power level decayed after RI sensing. Fig. 3-13 (a) and (b) show
that the bandwidth of resonant dip became wide after RI sensing. To achieve the recycle
ability, microfibers should also have low refractive index coating. PDMS cured by CO2
laser has been put into the test of microfiber coating. However, there were some
problems in PDMS coating process. The PDMS coating should be cured rapidly.
Otherwise, the coating would shrink into ball shape owing to the surface tension of
PDMS. Besides, it is difficult to stretch the microfiber of a MCR to be straight. The
PDMS coating would not be uniform on loose microfibers.
Fig. 3-5 Transmission spectrum of PDMS-packaged MCR before RI sensing.
Concentration (w/w %)
Wavelength shift (nm)
1 2 3 Average Standard
deviation
2 0.0034 0.0029 0.0024 0.0029 0.00050 4 0.0243 0.0221 0.0211 0.0225 0.00163 6 0.0375 0.0303 0.0341 0.0340 0.00360 8 0.0467 0.0375 0.0436 0.0426 0.00468 10 0.0689 0.0551 0.0534 0.0591 0.00850
Table 3-2 Values, averages and standard deviations of wavelength shift at different
glucose solutions.
1546.5 1546.6 1546.7 1546.8 1546.9 1547 1547.1 1547.2 1547.3 1547.4 1547.5-7 -6
-5 -4 -3 -2 -1 0
20160101-mcr-af
Wavelength (nm)
T ra n sm issi o n ( d B )
37
Fig. 3-6 (a)-(e) Measured transmission spectra of PDMS-packaged MCR in each glucose solutions of first measurement. (f) The shifts of the resonant dip in the transmission spectra.
Fig. 3-7 (a)-(e) Measured transmission spectra of PDMS-packaged MCR in each glucose solutions of second measurement. (f) The shifts of the resonant dip in the transmission spectra.
39
Fig. 3-8 (a)-(e) Measured transmission spectra of PDMS-packaged MCR in each glucose solutions of third measurement. (f) The shifts of the resonant dip in the transmission spectra.
Fig. 3-9 Dependence of the measured wavelength shifts on the refractive index of glucose solutions and its linear fit to the data.
Fig. 3-10 Microscopic image of microfiber in the RI sensing region after RI sensing.
Equation y = a + b*x Weight Instrumental Residual Sum of Squares
7.90522
Pearson's r 0.98673 Adj. R-Square 0.96485
Value Standard Error
B Intercept -7.46573 0.70976
Slope 5.59256 0.53128
1.334 1.336 1.338 1.340 1.342 1.344 1.346 1.348 0.00
0.01 0.02 0.03 0.04 0.05 0.06 0.07
Data R^2=0.9648 Slope=5.592 nm/RIU
Wavelength shift(nm)
Refractive index unit(RIU)
41
Fig. 3-11 Photograph of microfibers after they were immersed in (a) 30% glucose
solution and (b) deionized water.
Fig. 3-12 Transmission spectra of PDMS-packaged MCR before and after RI sensing.
Fig. 3-13 Lorentz curve fittings of (a) dip A and (b) dip B.
1550.176 1550.178 1550.18 1550.182 1550.184 1550.186 1550.188 1550.19 0.75
0.8 0.85 0.9 0.95 1
Wavelength (nm)
No ra m lize d T ra n sm issi o n
3pm
Dip A
R-square:0.9893
1550.17 1550.175 1550.18 1550.185
0.65 0.7 0.75 0.8 0.85 0.9 0.95 1
Wavelength (nm)
No rm a lize d T ra n sm issi o n
3.6 pm
R-square:0.9847
Dip B
(b)
(a)
43
3.3 Long-term Stability Improvement
Microfiber coil resonator have been studied for many applications in nonlinear
optics, optical sensing and communication. For practical applications, stable
performance is needed. The MCR part has been packaged by PDMS, while some
microfibers are without protection. As mentioned before, microfiber is easily affected
by surrounding disturbance. Therefore, protection method for microfiber is essential to
ensure stable performance.
After the fabrication process described in Chapter 2, the PDMS-packaged MCR
was taken from coiling system carefully and fixed on a clip. Then the MCR was moved
to a U-shape Aluminum holder with two clips, as shown in Fig. 3-14. The U-shaped
holder was designed to support the whole MCR structure in the following process. If
the microfibers were adhered to one another during this step, a segment of glass fiber
was used to separate them. The microfibers should be as straight as possible so that they
would not adhere again. The single mode fiber region was taped on U-shaped holder.
After the whole structure was fixed, the U-shaped holder was screwed to the package
system. Fig. 3-15 shows the package system. The package system includes two manual
z-axis stages, a manual xy-axis stage and a tilt stage.
A PMMA board coated with UV glue (PC373L AP, Luvantix SSCP, n~1.373) was
used as low refractive index substrate for PDMS-packaged MCR. It was noticed that
the surface of UV glue coating would be sticky due to oxygen inhibition. Oxygen
inhibition is resulted from the oxygen in air. During the UV curing process, oxygen
interacts with photoninitiator by quenching effect. Besides, oxygen can react with
radicals produced from photoninitiator. Both would slow reaction rate and lead to low
degree of curing [49]. The sticky surface might adhere microfibers and break
microfibers in the following process. To solve this problem, a polyethylene (PE) thin
film was covered on the UV glue coating during the curing process. The PE thin film
could isolate the UV glue from oxygen so that the coating could be fully cured.
Now we describe the package process. The PMMA board with UV glue coating
was set on a manual z-axis stage. The U-shaped holder with PDMS-packaged MCR
was screwed to the tilt stage. The position of PDSM-packaged MCR was moved right
above the PMMA board by adjusting manual xy-axis stage. Then the PMMA board was
raised to support the PDMS-packaged MCR. Tilt stage was used to make microfibers
parallel with PMMA board so that the microfibers could touch PMMA board without
bending. Finally, the microfibers was covered with enough UV glue and exposed by
UV LED for 10 minutes. As mentioned before, a PE thin film was covered on UV glue
to prevent oxygen inhibition. Here PDMS was not appropriate to package microfibers.
45
a little loose. Since the thermal expansion coefficient of PDMS is larger than silica [50,
51], PDMS would compress microfibers during thermal curing process. As shown in
Fig. 3-16, these micro-bending would increase propagation loss to microfibers. In our
previous test, the transmission power of microfiber would be down to zero when micro-
bending happened.
Fig. 3-17 shows the photograph of the whole structure. The measured transmission
spectrum is shown in Fig. 3-18 (a). The free spectral range was 0.283 nm, and the
extinction ratio was ~4.5 dB. Lorentzian curve fitting was applied to determine the
bandwidth of dip. As seen in Fig. 3-18 (b), the bandwidth of the resonant dip at 1549.941 nm was 16 pm and the quality factor (λ/Δλ) was ~100,000. Fig. 3-19 shows
the original transmission spectrum and the spectrum after a month. The transmission
power level and shape of resonant dip almost remained unchanged. This result showed
that packaging microfibers with UV glue could improve the long-term stability of
PDMS-packaged MCR.
Fig. 3-14 Photograph of U-shaped Aluminum and MCR clip.
Fig. 3-15 Photograph of package system.
47
Fig. 3-16 Photograph of microfiber in PDMS with micro-bending.
Fig. 3-17 Photograph of PDMS-packaged MCR on UV glue coating substrate.
Fig. 3-18 (a) Transmission spectrum of PDMS-packaged MCR and (b) one resonant dip and its Lorentz curve fitting
49
Fig. 3-19 Transmission spectra of the original PDMS-packaged MCR with protection and the same one after a month.
1549 1549.21549.41549.61549.8 1550 1550.21550.41550.61550.8 0.5
1 1.5 2 2.5
20161220-20170111
Wavelength (nm)
P o we r (m W )
original after a month
Chapter 4 Conclusions and Future Work
In this work, a PDMS-packaged MCR with high quality factor has been
demonstrated. PDMS for packaging MCR was diluted with hexane so the MCR coil
could turn around easily. The quality factor was 5 x 10⁵ and the performance could
maintain for 5 days. With high quality factor and a stable MCR structure, PDMS-
packaged MCR could serve as RI sensor with low detection limit. A 4-layer PMMA
structure was designed to support PDMS-packaged MCR and glucose solutions were
used for different RI. The experiment results showed the resonance dips shifted linearly
and the detection limit was 7 x 10⁻⁴. To increase the potential of practical applications,
long-term stability of MCR was further improved by protecting microfibers with UV
glue. In UV curing process, UV glue was covered with PE thin film to prevent oxygen
inhibition. The performance of MCR could maintain over a month without degradation.
Such MCRs with high quality factor and long-term stability might be useful in nonlinear
optics.
When an optical fiber is drawn into a microfiber, the nonlinear interaction occurs
in the narrow microfiber waist. Microfiber allows light to be funneled into a small area,
increasing its intensity and promoting nonlinear effect. Besides, a resonator with high
51
In 2015, Y. Wang et. al., presented an all optical control based on microfiber knot
resonator and graphene. The light-graphene interaction can be strongly enhanced via
the resonantly circulating light [52]. Therefore, PDMS-packaged MCRs have strong
nonlinearity and can provide a stable structure for nonlinear optics. Recently, the
combination of semiconductor materials with fiber optics has become one of the
emerging research topics. We have the ability to produce silicon-cored fibers with high
quality by vertical-drawing [53]. The nonlinear effect of silicon is stronger than silica.
We can fabricate PDMS-packaged MCR with microfiber drawn from silicon-cored
fiber. PDMS-packaged MCR combined with silicon-cored fiber would have strong
nonlinear effect and potential for nonlinear applications.
In addition to the nonlinear application, MCRs with high quality factor have the
potential to be good lasing element. In 2006, X. Jiang et. al., demonstrated a microfiber
laser formed by tightening a doped microfiber into a microfiber knot resonator [54].
With high quality factor and long-term stability, PDMS-packaged MCR could supply
good condition for lasing. We could draw the fiber with high gain doping into
microfiber and use the microfiber to fabricate PDMS-packaged MCR. The MCR based
laser is likely to be realized.
References
[1] K. C. Kao and G. A. Hockham, "Dielectric-fibre surface waveguides for
optical frequencies," IEE Proc. J., vol. 113, pp. 1151–1158, 1966.
[2] Senior, John M., and M. Yousif Jamro. Optical Fiber Communications:
Principles and Practice. Pearson Education, 2009.
[3] P. Urquhart, "Review of rare earth doped fibre lasers and amplifiers," IEE
Proceedings J. Optoelectronics, vol. 135, pp. 385-407, 1988.
[4] R. Kashyap, Fiber Bragg Gratings. Academic Press, 2009.
[5] Rajan Ginu, ed. Optical Fiber Sensors: Advanced Techniques and
Applications. CRC press, 2015.
[6] R. H. Stolen and R. P. De Paula, "Single-mode fiber components," Proc. IEEE,
vol. 75, pp. 1498–1511, 1987.
[7] J.-P. Goure, I. Verrier, and J.-P. Meunier, "Linear and nonlinear optical fibre
devices," J. Phys. D-Appl. Phys., vol. 22, pp. 1791–1805, 1989.
[8] P. Matthijsse and W. Griffioen, "Matching optical fiber lifetime and bend-loss
limits for optimized local loop fiber storage," Opt. Fiber Technol., vol. 11, pp.
92–99, 2005.
53
of macrobending losses of standard single mode fiber with small bend radii,"
Microw. Opt. Technol. Lett., vol. 49, pp. 2133–2138, 2007.
[10] N. G. R. Broderick, "Optical Snakes and Ladders: Dispersion and nonlinearity
in microcoil resonators," Opt Express, vol. 16, pp. 16247-16254, 2008.
[11] G. Brambilla, "Optical fibre nanotaper sensors," Opt. Fiber Technol, vol. 16,
pp. 331-342, 2010.
[12] J. Scheuer, "Fiber microcoil optical gyroscope," Opt. Lett., vol. 34, pp. 1630-
1632, 2009.
[13] F. Xu, P. Horak, and G. Brambilla, "Optical microfiber coil resonator
refractometric sensor," Opt. Express, vol. 15, pp. 7888-7893, 2007.
[14] Y. C. Hsieh, T. S. Peng, and L. A. Wang, “Millimeter-Sized Microfiber Coil
Resonators with Enhanced Quality Factors by Increasing Coil Numbers,”
IEEE Photon. Technol. Lett., 24, pp. 569-571, 2012
[15] T. H. Shen and L. A. Wang, “A Two-Layer Microcoil Resonator with Very High Quality Factor,” IEEE Photon. Technol. Lett., 26, pp. 535-537, 2014.
[16] F. Xu and G. Brambilla, “Embedding optical microfiber coil resonators in Teflon,” Opt. Lett. 32, pp. 2164-2166, 2007.
[17] Y. Jung, G. S. Murugan, G. Brambilla, and D. J. Richardson, “Embedded
optical microfiber coil resonator with enhanced high-Q,” IEEE Photon.
Technol. Lett., 22, pp. 1638–1640, 2010.
[18] L. Tong and M. Sumetsky, Subwavelength and Nanometer Diameter Optical
Fibers. Springer, 2010.
[19] G. Brambilla, F. Xu, P. Horak, Y. Jung, F. Koizumi, N. P. Sessions, E.
Koukharenko, X. Feng, G. S. Murugan, J. S. Wilkinson, and D. J. Richardson,
"Optical fiber nanowires and microwires: Fabrication and applications," Adv.
Opt. Photon., vol. 1, pp. 107–161, 2009.
[20] G. Brambilla, "Optical fibre nanowires and microwires: A review," J. Optics.,
vol. 12, pp. 043001, 2010.
[21] J. Scheuer and M. Sumetsky, "Optical ‐ fiber microcoil waveguides and
resonators and their applications for interferometry and sensing," Laser Photon.
Rev., vol. 5, pp. 465–478, 2011.
[22] F. Xu and G. Brambilla. "Demonstration of a refractometric sensor based on
optical microfiber coil resonator," Appl. Phys. Lett., vol. 92, pp. 101126, 2008.
[23] G. Xin and L. Tong. "Supported microfiber loops for optical sensing." Opt.
Express, vol. 16, pp. 14429-14434, 2008.
[24] K.S. Lim, I. Aryanfar, W.Y. Chong, Y.K. Cheong, S.W. Harun, and H. Ahmad,
"Integrated microfibre device for refractive index and temperature sensing,"
55
[25] H. Yu, L. Xiong, Z. Chen, Q. Li, X. Yi, Y. Ding, F. Wang, H. Lv, and Y. Ding,
"Solution concentration and refractive index sensing based on polymer
microfiber knot resonator," Appl. Phys. Express, vol.7, pp. 022501, 2014.
[26] X. Li and H. Ding, "A stable evanescent field-based microfiber knot resonator
refractive index sensor." IEEE Photon. Technol. Lett, vol. 26, pp. 1625-1628,
2014.
[27] X. Zeng, Y. Wu, C. Hou, J. Bai and G. Yang, "A temperature sensor based on
optical microfiber knot resonator," Optics Communications, vol. 282, pp.
3817-3819, 2009.
[28] K.S. Lim, S.W. Harun, S.S.A. Damanhuri, A.A. Jasim, C.K. Tio and H. Ahmad,
"Current sensor based on microfiber knot resonator," Sensors and Actuators A:
Physical, vol. 167, pp. 60-62, 2011.
[29] X. Xie, J. Li, L.P. Sun, X. Shen, L. Jin and B.O. Guan, "A high-sensitivity
current sensor utilizing CrNi wire and microfiber coils," Sensors, vol. 14, pp.
8423-8429, 2014.
[30] S.C. Yan, B.C. Zheng, J.H. Chen, F. Xu and Y.Q. Lu, (2015). "Optical
electrical current sensor utilizing a graphene-microfiber-integrated coil
resonator," Appl. Phys. Lett., vol. 107, pp. 053502, 2015.
[31] M.S. Yoon, S.K. Kim and Y.G. Han, "Highly sensitive current sensor based on