i
國立臺灣大學電機資訊學院生醫電子與資訊學研究所 碩士論文
Graduate Institute of Biomedical Electronics and Bioinformatics College of Electrical Engineering and Computer Science
National Taiwan University Master Thesis
具雙重力學刺激之細胞移動研究微流道裝置
Microfluidic Device with Dual Mechanical Cues for Cell Migration Investigation
蔡錦雄
Chin-Hsiung Tsai
指導教授:郭柏齡 博士 林致廷 博士 Advisor: Po-Ling Kuo, Ph.D.
Chih-Ting Lin, Ph.D.
中華民國 101 年 7 月
July, 2012
i
致謝
非常感謝郭柏齡老師和林致廷老師,在這兩年的共同指導,提供 許多寶貴的建議,奠基我在學術研究上的基礎。特別感謝郭老師給予 我參加學術會議的機會,得以與其他研究團隊交流互動,拓展視野。
雖然同時參加兩位老師的會議、報告以及實驗會較為忙碌,但學 術上的收穫卻遠大於付出;而與兩邊實驗室成員日常生活的互動、研 究上的討論砥礪,更是令人難忘。特別感謝智傑、毛毛、小田田、Pinky、
翊倫提供的協助與歡樂。
謝謝我的父母與姊姊,給予我各種協助,使我得以無後顧之憂,
盡力學習。最後要感謝的是與我交往八年的女友高秀華,接受我的優 點與缺點,陪伴我走過人生的痛苦與歡笑。
ii
摘要
細胞移動在許多生理現象及疾病扮演非常重要的角色,例如血管 新生、傷口癒合以及癌症轉移。因此研究細胞移動的基本機制,將對 疾病治療與再生醫學的發展至為關鍵。部分生物力學刺激對細胞移動 的影響,已被廣泛研究並深入探討;然而,在多重訊號同時刺激下,
細胞將如何受到調控,仍是目前了解甚少的領域。在本篇研究中,我 們將具有硬度梯度的水膠整合進入微流道系統中,此一整合型裝置將 能同時提供雙重力學刺激去調控細胞移動。藉由此一裝置,我們將能 在一個更接近人體生理狀況的環境中,深入探討硬度梯度與滲透壓梯 度對細胞移動的影響,此一裝置同時也具有應用在其它研究目的的潛 力。
關鍵字:細胞移動、微流道、水膠、硬度梯度、滲透壓梯度
iii
Abstract
Cell migration plays an important role in both physiology and disease, such as
angiogenesis, wound healing and cancer metastasis. Therefore, understanding the
fundamental mechanisms of cell migration is crucial to create strategies for disease
treatment and regenerative medicine. Some biomechanical cues have been well
studied about their effects on guiding cell migration, however, few discuss about
simultaneously generating dual or multiple cues to affect cell migration. Here, we
integrated a gradient-compliant polyacrylamide (PA) gel into the microfluidic system,
thus enabling the device to provide dual mechanical cues at the same time. By
adopting this advanced device, we can investigate the effects of stiffness and osmotic
gradients on guiding cell migration in a more in vivo-like environment, and this dual
cues system might also be useful for other applications.
Key words: cell migration, microfluidics, hydrogel, stiffness gradient, osmotic
gradient
iv
Content
致謝 ... i
摘要 ... ii
Abstract ... iii
Content ... iv
List of Figures ... v
List of Tables ... vi
Chapter 1. Introduction ... 1
Chapter 2. Materials and Methods ... 6
2.1 Device design and operation principle ... 6
2.2 Fabrication of microfluidic system ... 10
2.2.1 Photolithography ... 10
2.2.2 Soft lithography ... 12
2.3 Gradient-compliant polyacrylamide gel ... 13
2.3.1 Polymerization of the polyacrylamide gel ... 13
2.3.2 Functionalization of the polyacrylamide gel ... 14
2.3.3 Characterization of the polyacrylamide gel ... 15
2.4 Fabrication and characterization of the dual mechanical cues device ... 16
2.4.1 Fabrication of PDMS substrate... 16
2.4.2 Integration of the PA gel and the microfluidic channels ... 17
2.4.3 Quantification of the concentration gradient ... 20
2.5 Osmotic gradients simulation ... 20
2.6 Cell culture and cell migration analysis ... 22
Chapter 3. Results and Discussion ... 24
3.1 The integrated PA gel-microfluidic device ... 24
3.2 Concentration gradients generation and analysis ... 27
v
3.2.1 Simulation of the sucrose concentration gradient ... 27
3.2.2 Trypan blue concentration gradient ... 30
3.3 Characterization of the gradient-compliant PA gel ... 31
3.3.1 Stiffness gradient ... 31
3.4 C2C12 cell culture and analysis ... 34
3.4.1 Cell culture in the integrated PA gel-microfluidic device ... 34
3.4.2 Cell culture in the high osmolarity cell culture medium ... 36
3.4.3 Cell migration on a gradient-compliant PA gel ... 39
3.5 Evaluation of 2D and 3D hydrogel-microfluidic integration systems ... 42
Chapter 4. Conclusion and Future works ... 44
Reference ... 46
List of Figures
Fig. 2.1: Schematic of the dual mechanical cues device ... 7Fig. 2.2: Schematic of device operation, dual gradients and signals sensed by the cell ... 9
Fig. 2.3: Fabrication process of master mold ... 11
Fig. 2.4: Fabrication process of PDMS replica ... 12
Fig. 2.5: Polymerization of PA gel ... 14
Fig. 2.6: Protein conjugation with PA gel ... 15
Fig. 2.7: Planarization of PDMS substrate ... 17
Fig. 2.8: Fabrication process for integrating microfluidic system with PA gel ... 19
Fig. 3.1: A photograph of the assembled device and the mask design of the microfluidic channels ... 25
Fig. 3.2: Top-view phase contrast images of the cell culture chamber in the device ... 26
Fig. 3.3: Simulation of concentration gradient and data plots ... 29
Fig. 3.4: A photograph of the trypan blue concentration gradient generated by the device ... 31
Fig. 3.5: Stiffness measurement of the gradient-compliant PA gels ... 33
Fig. 3.6: Fibronectin densities of the PA gels ... 34
vi
Fig. 3.7: Cell culture after seeding for 24 hours in the devices ... 36 Fig. 3.8: Cell culture with or without high concentration sucrose ... 37 Fig. 3.9: Quantitative analysis of C2C12 cell morphology changes under
hypertonic stress... 38 Fig. 3.10: Windrose plot of cell migration path and positions of cell tracking
on a gradient-compliant PA gel. ... 40 Fig. 3.11: Quantitative analysis of C2C12 cell migration speed and TI. ... 40 Fig. 3.12: Distribution of cell numbers along a gradient-compliant PA gel.
... 41
List of Tables
Table 1: Quantitative description of C2C12 cell morphology under different hypertonic stress ... 38 Table 2: Quantitative description of C2C12 cell migration speed and TI ... 40 Table 3: A comparison table of 2D and 3D hydrogel-microfluidic integrated systems ... 43
1
Chapter 1. Introduction
Cell migration plays an important role in physiology and disease (Gardel,
Schneider et al. 2010). Cells fail to migrate to the right position during embryogenesis
may cause severe development disorders. Cancer cells might change the extra cellular
matrix (ECM) and induce a series of events to help them migrate to other organs, the
metastasis. For tissue engineering, constructing an appropriate microenvironment and
guiding the cells to the right place are critical for cells to function as they did in the
original organs. Therefore, understanding the fundamental mechanisms of cell
migration is crucial to create strategies for disease treatment and regenerative
medicine.
Biochemical and biomechanical cues are two major stimulation types to guide
cell migration, and clarifying how these signals affect cell migration is an important
research field. Microfluidic systems are capable to generate stable linear or
logarithmic chemical gradients and therefore are widely used to study chemotaxis,
which describe how chemical factors attract or repel cell migrate along the direction
of chemical gradient. Human neutrophils migrate to the place with the highest
concentration of interleukin-8 (IL-8) and demonstrate different behaviors to different
gradient patterns (Li Jeon, Baskaran et al. 2002). Venular and arterial endothelial cells
2
show different reactions to the gradient of fibroblast growth factor 2 (FGF2) and
different gradient strengths of vascular endothelial growth factor A 165 (VEGFA165)
could induce human umbilical vein endothelial cells (HUVECs) to generate different
chemotaxis responses (Barkefors, Le Jan et al. 2008).
Astrocyte has been observed to migrate toward hypotonic region under an
osmotic gradient (Saadoun, Papadopoulos et al. 2005), and that observation might be
involved with the water flow through aquaporins (AQPs) on the cell membrane
(Papadopoulos, Saadoun et al. 2008) Some other experiments also show that the
osmolarity play a role in controlling cell motility (Loitto, Karlsson et al. 2009). A
theoretical study proposes that the osmotic gradient can induce water flux to facilitate
the cell motility (Jaeger, Carin et al. 1999). Although the mechanism is still not clear,
the osmotic gradient might be a fundamental mechanical stimulation to guide cell
migration.
Substrate stiffness is another important mechanical stimulation that has been
shown to control the differentiation of mesenchymal stem cells (Engler, Sen et al.
2006) and cell migration. 3T3 fibroblast (Lo, Wang et al. 2000), vascular smooth
muscle cells (Wong, Velasco et al. 2003; Isenberg, DiMilla et al. 2009) and
macrophages (Nemir, Hayenga et al. 2010) have been demonstrated that they would
migrate to stiffer region from softer region of the substrata. This phenomenon is
3
durotaxis, and the most common material to study how cell response to substrata
biophysical signals is polyacrylamide (PA) gel (Gribova, Crouzier et al. 2011). The
preparation and characteristics of polyacrylamide gel are well established and studied
(Tse and Engler 2010).
Although these studies have shown deep insights to explain the relation between
one specific signal and cell migration, there are still few have built an environment
providing dual or multiple gradient cues simultaneously. Understanding the cell
behaviors under a more in vivo-like situation will further extend our knowledge to cell
migration and have more reliable information for medical application. However, this
idea is mainly limited by the nature that one method can usually generate only one
well-controlled signal. One of the approaches to overcome this challenge with
microfluidics is designing a functional channel-geometry to generate shear stress
gradients in one cell culture chamber, thus it can cooperate with chemical gradient to
guide cell migration at the same time (Park, Yoo et al. 2009). Despite their many
benefits, there are a number of small, but important, problems. For example, the two
stimulations could not be controlled independently since the chemical gradient is also
influenced by the flow profile. Another weakness is that the real flow velocity is very
difficult to be measured for the flow direction is not simply straight. Moreover, the
properties of substrata still could not be changed while these signals are also critical to
4
guide cell migration.
In this study, we propose a new approach that integrates two different systems
into a dual cues device which can generate substrate stiffness and osmotic gradients
simultaneously. The two systems in this device are: (1) a gradient-compliant PA gel
which is responsible for the first mechanical cue, the substrate stiffness gradient, and
(2) a microfluidic system which can generate the second mechanical cue, the osmotic
gradient. Sucrose is selected here to adjust the osmolarity of the cell culture media,
and it has been used before to study the effect of hypertonic stress on C2C12 cells
(Alfieri, Bonelli et al. 2006). The design of the microfluidic system can be divided
into two sides: (1) the source side which continues to provide cell culture media with
highest sucrose concentration to the cell culture chamber in the microfluidics, and (2)
the free side which allows the cell culture chamber to access the bulk solution without
sucrose. The gradient is built through the diffusion of sucrose from source side to free
side and can be maintained for long term cell culture studies. To develop our dual
cues device, we have created two new steps to embed the PA gel in the microfluidic
system and protect the gel from damages during the conventional
poly(dimethylsiloxane) (PDMS) microfluidics fabrication process.
The C2C12 mouse myoblast is an appropriate candidate to be investigated with
osmotic and stiffness gradients. This cell line has been shown that the expression of
5
AOP5 is regulated by differentiation and hypertonic stress (Hwang, Lee et al. 2002).
The morphology of C2C12 cells is found to depend on substrate stiffness (Engler,
Griffin et al. 2004). However, the effects of these mechanical cues on C2C12 cell
migration are still not clear.
We hypothesize that C2C12 cell migration can be influenced by both stiffness
and osmotic gradients and the two signals can facilitate with each other to guide cell
migration. So far, we have successfully performed C2C12 cell culture in our device.
We also cultured C2C12 cells with a high osmolarity cell culture medium in the
culture dish, and analyzed cell migration on a gradient-compliant PA gel. These
results provide important information for further experiments to test our hypotheses.
The device presented in this study might be the first one to embed a
gradient-compliant PA gel in a microfluidic system, and this device has the potential
to be used to study cell migration under two different stimulations which is more
close to the in vivo system. The first stimulation is stiffness gradient, and the second
one can be osmotic gradients or theoretically, chemical gradients if the solute is
replaced with chemoacttractants, thus making the device more flexible to be adopted
for other studies.
6
Chapter 2. Materials and Methods
2.1 Device design and operation principle
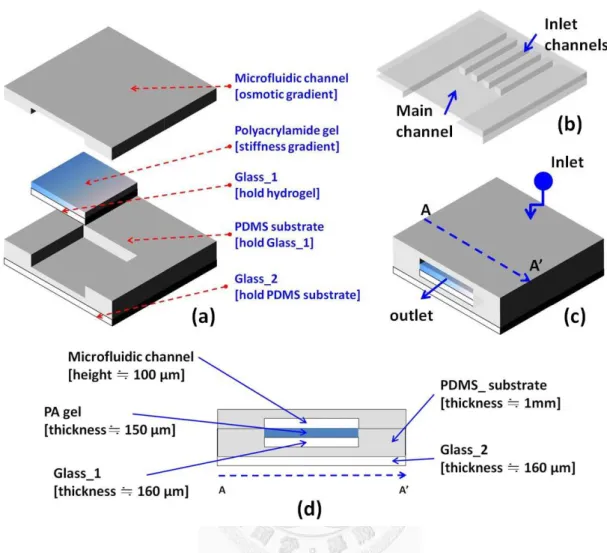
The main components of the device are shown in Fig 2.1, a. The microfluidic
channel includes the main channels and inlet channels (Fig 2.1, b), and their main
function is to provide fresh cell culture medium, remove the waste produced by the
cells and generate osmotic gradients. Polyacrylamide (PA) gel is used to provide
stiffness gradient. The Glas_1 is used to hold PA gel and overcome the challenge that
PA prepolymer solution is difficult to polymerize on PDMS. The square groove on
PDMS substrate is for Glass_1 and PA gel to be embedded in. The main function of
Glass_2 is holding PDMS substrate to ensure the surface of groove on PDMS
substrate is smooth, it’s more important for thin PDMS substrate (i.e. less than 600
μm). The inlet is connected with a syringe pump, and the outlet is a one side of the
main channel (Fig 2.1, c). The important dimension of each component is shown in
Fig 2.1, d.
7
Fig. 2.1: Schematic of the dual mechanical cues device (not to scale). (a) Main
components and their functions (in square bracket) of the device. (b) Perspective view
of the top layer, the inlet channels and the main channel. (c) Positions of inlet and
outlet, the blue circle represents the syringe pump. (d) Cross section view of the A to
A’ line in (c).
8
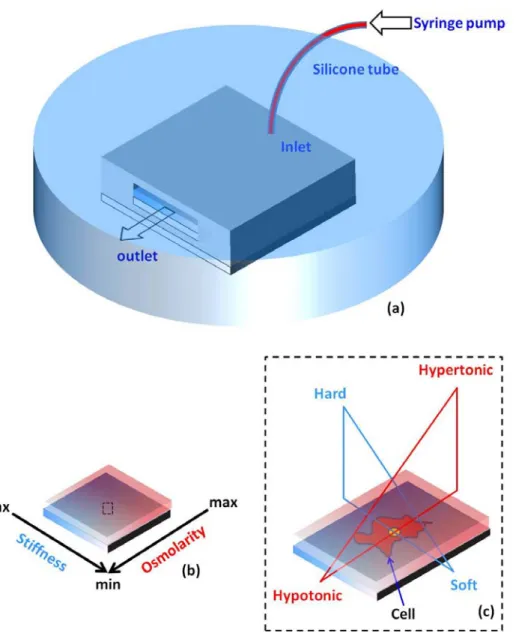
The operation principle of the dual mechanical cues device is illustrated in Fig
2.2. The region where inlet channels connected to the main channel is the source side
for high osmolarity cell culture media (high concentration of sucrose), and the outlet
of the main channel is connected to the bulk solution where is sucrose-free cell culture
media (Fig 2.1, a and Fig 2.2, a). Because the flow velocity driven by the syringe
pump is small (≒1×10⁻⁹ m/sec) in the main channel , the distribution of sucrose
would be similar with the result from diffusion, thus creating a concentration gradient
in the direction from inlet to outlet. The cell migration experiment is performed in the
cell culture chamber composed of the main channel and a compliant-gradient PA gel.
The direction of the two stimulations, stiffness and osmotic gradients, in the cell
culture chamber is shown in Fig 2.2, b, and they are perpendicular with each other.
However, it is flexible to change the relative direction between them dependent on the
requirement of different experiments. Fig 2.2, c shows the concept about how the two
signals simultaneously stimulate a cell in the cell culture chamber. The cell can not
only sense the osmolarity difference between the front and the back, but also stiffness
difference between the left side and the right side of the cell.
9
Fig. 2.2: Schematic of device operation, dual gradients and signals sensed by the cell
(not to scale). (a) The whole device, except the inlet tube, is immersed in the standard
cell culture media. (b) The color changes indicate the intensity distribution from
maximum to minimum of the two stimulations in the cell culture chamber. (c)
Enlarged dashed-line box in the middle of (b) shows the two different gradient signals
sensed by the cell attached on the PA gel.
10
2.2 Fabrication of microfluidic system
2.2.1 Photolithography
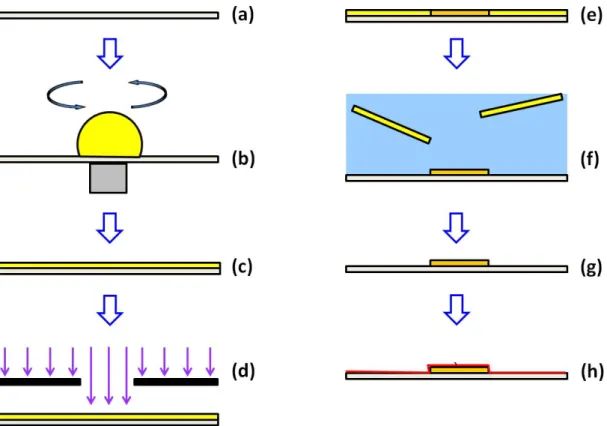
The microfluidic channels (Fig 2.1, a) was fabricated by soft lithography. The
first step was to build the master mold by photolithography (Fig 2.3). We used silicon
wafer as the substrate for photoresist (PR), SU8-2050. The wafer was cleaned with
buffered oxide etch (BOE) to remove the native oxide to promote the adhesion of PR
on the substrate (Fig 2.3, a). The PR (shown in yellow in Fig 2.3) was poured on the
wafer and spin at 1600 rpm to have a thin-film with thickness of 100 μm (Fig 2.3, b).
After the spin coating process, bake PR at 65℃ for 5 minutes then 95℃ for 20
minutes on a hotplate and finally leave PR to cool to room temperature (Fig 2.3, c).
Right after soft bake, use UV light to expose the PR under a photomask to transfer the
pattern from the mask to PR (Fig 2.3, d). The energy used in the exposure process is 7
mJ/cm2 and the exposure time is 35 sec. Then replace the wafer to the hotplate for
post exposure bake process, bake the PR at 65℃ for 5 minutes then 95℃ for 10
minutes and finally leave PR to cool to room temperature. The shape of patterns
should appear after the baking process (Fig 2.3, e). After post exposure bake, immerse
PR in the Microchem’s SU-8 developer, and develop PR for 7 minutes (or until the
non-pattern PR is removed) with an ultrasonic bath (Fig 2.3, f). Then rinse the PR
11
with fresh developer solution, isopropyl alcohol (IPA) and deionized water
sequentially. Air dry with nitrogen, then bake the PR at 150℃ for 2 minutes (Fig 2.3,
g). Silanize the product with dichlorodimethylsilane (DCDMS) in a desiccator
overnight to form a thin film on PR and wafer (red film in Fig 2.3, h). That film could
prevent PR from damage during fabricating PDMS replica. After these processes, we
had a silanized master mold of the microfluidic channels.
Fig. 2.3: Fabrication process of master mold. (a) Clean the surface of the silicon wafer.
(b) Spin coat the SU8-2050 PR (yellow drop) on the silicon wafer. (c) Soft bake. (d)
Exposure PR. (e) Post exposure bake. (f) Develop. (g) Hard bake. (h) Silanize the
SU-8 precursor.
12
2.2.2 Soft lithography
The second step of soft lithography is shown in Fig 2.4. Pour Sylgard 184
(PDMS prepolymer: curing agent in 10:1 by weight) on the master mold and cure it at
60℃ for at least two hours (Fig 2.4, a). Remove the PDMS replica from master mold
(Fig 2.4, b) and punch a hole on the replica for inlet, then autoclave it at 120℃ for 30
minutes (Fig2.4, c) to promote the polymerization of PDMS and decrease
uncrosslinked oligomers, which might be toxic to cells (Hanson, Cui et al. 2011). The
PDMS replica or microfluidic channels were ready to be used in the integration
process (Fig 2.8, c).
Fig. 2.4: Fabrication process of PDMS replica. (a) Pour the mixture of PDMS
prepolymer and curing agent (10:1 by weight) on the silanized master mold, then cure
it at 60℃. (b) Replace the PDMS replica from the master mold. (c) Punch a hole for
inlet, then autoclave the PDMS replica for 15 min.
13
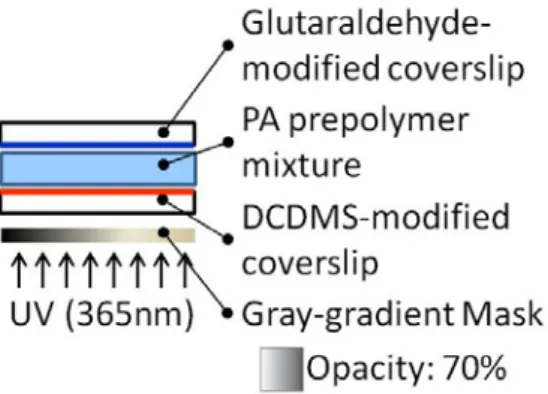
2.3 Gradient-compliant polyacrylamide gel
2.3.1 Polymerization of the polyacrylamide gel
The preparation of gradient-compliant PA gel is slightly modified from Engler’s
protocol (Tse and Engler 2010). Briefly, the PA prepolymer solution was polymerized
between two coverslips (Fig 2.5). One of the coverslip was modified with
glutaraldehyde to enhance PA gel to attach on coverslip, and this modification is
especially important for gradient-polymerized PA gel. The other coverslip was
modified with dichlorodimethylsilane (DCDMS) to make the surface hydrophobic to
smooth the surface of the PA gel. The PA prepolymer solution was composed of 10%
acrylamide (w/v ratio), 0.3% bis-acrylamide, 0.4% acrylic acid, 0.5% Irgacure 2959
(photoinitiator) and deionized water. The intensity of the stiffness gradient can be
controlled through exposure time, mask opacity, the concentration of Irgacure 2959
and UV power.
14
Fig. 2.5: Polymerization of PA gel. The PA prepolymer solution sits in between GA
activated coverslip and DCDMS activated coverslip, then polymerize the prepolymer
solution with UV light (wavelength = 365nm) filtered with a photomask, thus
generating a non-uniform polymerization in the PA prepolymer solution.
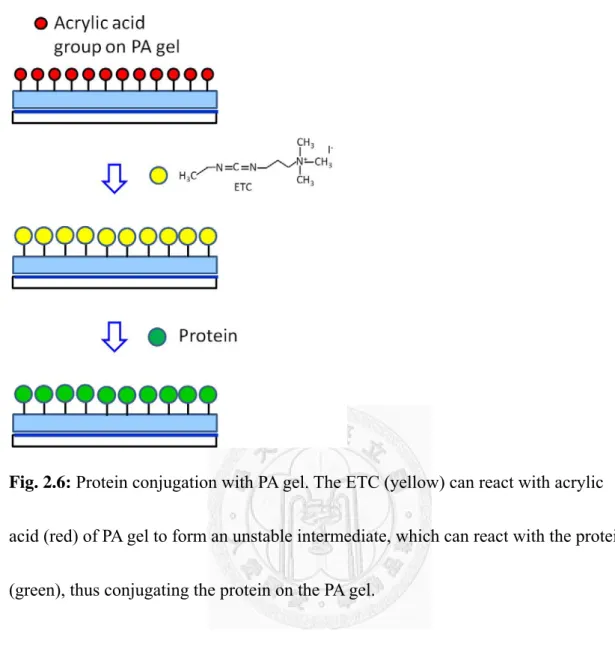
2.3.2 Functionalization of the polyacrylamide gel
The PA gel could be further modified to functionalize the surface with extra
cellular matrix proteins, for example, fibronectin (Fig 2.6). The method of protein
conjugation was through carbodiimide-mediated cross-linking (Kandow, Georges et al.
2007). However, we used 1-(3-(dimethylamino) propyl)-3-ethyl-carbodimide
methiodide (ETC) instead of 1-ethyl-3-(3-dimethyllaminopropyl) carbodiimide
hydrochloride (EDC). Because the molecular weight between ETC and EDC is
different, from our experience, the appropriate concentration of ETC is 40.3 mg/ml.
The concentration of fibronectin is 100μg/ml.
15
Fig. 2.6: Protein conjugation with PA gel. The ETC (yellow) can react with acrylic
acid (red) of PA gel to form an unstable intermediate, which can react with the protein
(green), thus conjugating the protein on the PA gel.
2.3.3 Characterization of the polyacrylamide gel
We used immunofluorescence to verify a uniform density of fibronectin
conjugation among the gradient-compliant PA gel. The primary antibody
(anti-fibronectin) was diluted with PBS (4% BSA) in 1:400, and the secondary
antibody (anti-rabbit) was diluted with PBS (4% BSA) in 1:600. The fluorescent
images were analyzed by Image J.
The measurement of PA gel stiffness was kindly assisted by Bioceramics and
16
Composites Lab in institute of biomedical engineering, national Taiwan university.
We used TR800PB probe with spring constant about 0.615 N/m to 0.731 N/m, and the
Possion ratio of PA gel was defined as 0.42 (Engler, Rehfeldt et al. 2007).
2.4 Fabrication and characterization of the dual mechanical cues device
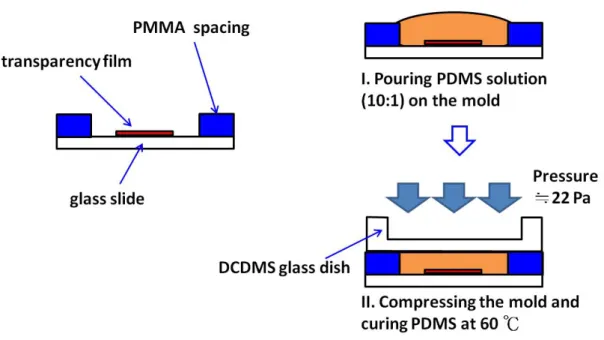
2.4.1 Fabrication of PDMS substrate
Besides the microfluidic channels, we also used soft lithography to make another
PDMS replica, the PDMS substrate for holding Glass_1 (Fig 2.1, a). The process is
shown in Fig 2.7. We used laser ablation to trim a transparency film to a square (5.1
mm x 5.1 mm), then attached it on the glass with 3M double tape. It is the master
mold for the groove in the PDMS substrate. Poly (methyl methacrylate) (PMMA) was
used here as a spacing to define the thickness of PDMS substrate. PDMS prepolymer
solution was poured on the master mold, then we placed a DCDMS modified glass
dish on the PMMA. The extra PDMS solution was squeezed out by applying a force
on the glass, then the whole setup was placed in an oven to cure the PDMS. This
smoothing process enables the surface of groove on the PDMS to be flat after bonding
to Glass_2, thus increasing the success rate of bonding between Glass_1 and PDMS
substrate.
17
Fig. 2.7: Planarization of PDMS substrate. The master mold of PDMS substrate is
fabricated by attaching customized PMMA spacing and transparency film with 3M
double tape to the glass slide. Then use standard PDMS replication process and
pressurized glass dish to smooth top surface of the PDMS replica.
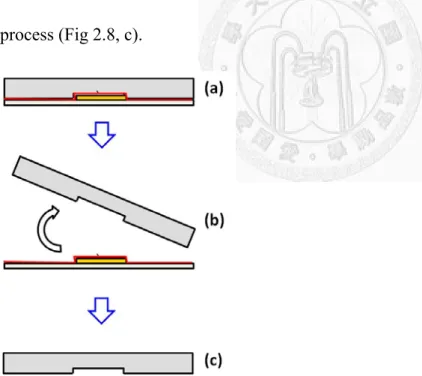
2.4.2 Integration of the PA gel and the microfluidic channels
The integration process of the PA gel and the microfluidic system (Fig 2.8)
started from assembling Glass_1, PDMS substrate and Glass_2. We used oxygen
plasma bonding method and it would render the PDMS surface to be hydrophilic.
Therefore, we had to cover the non-bonding area with 3M tape to retain their
hydrophobicity, which prevented chemical solutions spreading from the groove during
the surface modification process of Glass_1. The PA polymerization process was
18
similar with the description in section 2.3.1. During this process, the extra silane on
the DCDMS-modified coverslip had to be removed, or it would transfer to the PDMS
surface and make these areas unable to be activated by air plasma. The final bonding
process (Fig 2.8, c) was completed as fast as possible to decrease the possibility to
dehydrate the PA gel, and we also use a customized coverslip (5 mm x 5mm) to
protect the PA gel from reactive ion species. The fastest bonding condition (18W, 890
mtorr, 33 sec) we had was achieved through performing the air plasma activation
under higher process pressure. The device was filled with deionized water to prevent
the PA gel from dehydration, some bubbles might appear during this process. After
sterilizing the device with UV light, we immersed it in deionized water overnight to
remove bubbles, then injected the ETC solution through the inlet to perform the
protein-PA gel conjugation process (section 2.3.2). The functionalized device was
ready to be used in cell culture experiments or kept in PBS at 4℃.
19
Fig. 2.8: Fabrication process for integrating microfluidic system with PA gel.
(a) Use oxygen plasma to activate Glass_1, PDMS substrate and Glass_2 except
non-groove area of the PDMS substrate (protected by 3M tape). Bond PDMS
substrate and Glass_2 first, and then bond Glass_1 to the surface of the groove. After
completing the bonding process, re-activate Glass_1 with oxygen plasma again. (b)
Modify the Glass_1 surface and then polymerize the PA prepolymer solution on the
glass. (c) Treat the microfluidic channel and the product from step (c) with air plasma
except the PA gel area, and bond them together. (d) Leave the device at room
temperature for at least 30 minute to enhance the bonding effect.
20
2.4.3 Quantification of the concentration gradient
We used trypan blue (Mw=872.88 Da) as the solute to observe the color
gradient to simulate the sucrose (Mw=342.3 Da ) gradient in the cell culture
chamber . We captured the images continuously from A to A’ (Fig 3.4) with a phase
contrast microscope. The gray intensity of each image was analyzed by Image J. We
defined the average intensity of the final 100 point as the background (IB). The gray
intensity of each data point (except the final 100 points) subtracted from IB to IC. The
minimum of IC was defined as IM, and the normalized concentration of each point was
defined as:
Normalized concentration=IC IM
2.5 Osmotic gradients simulation
In our study, we used sucrose to control osmolarity, thus the osmolarity
difference sensed by a cell is proportional to the concentration gradient of sucrose. To
predict the concentration gradient and the flow velocity profile in the cell culture
chamber (Fig 2.2), we used COMSOL Multiphysics 4.2a to simulate these
distributions in a two-dimensional simulation. In the two simulations below, the fluid
was defined as incompressible flow and neglect inertial term. The diffusion
coefficient of sucrose was defined as 5 x 10⁻¹⁰ m2/s for free flow media. All the results
21
were presented in the equilibrium state except the concentration-time dependent
change (Fig 3.3, b).
For the top view to the cell culture chamber, we coupled two physical models,
laminar flow and transport of diluted species, to perform the sucrose concentration
and flow profile in the free flow area. The normal inflow velocity was 1 x 10⁻⁷ m/s,
the inflow concentration was 200 mM, and the outflow concentration was 0 mM since
we assumed that the solutes disappeared quickly as they accessed to the bulk area.
The mesh settings was physics-controlled mesh consisted of 2012 elements (normal).
The characteristics of water were generated from the default setting in COMSOL
Multiphysics.
For a more specific simulation to our device, we used the other two physical
models, Brinkman equations and species transport in porous media. This model
construction could give us a more realistic prediction since the substrate in the cell
culture media was PA gel, a porous medium. We built the whole model according to
COMSOL model gallery (model ID: 170). In Brinkman equations, the fluid properties
were generated from the default setting of water, while the porous matrix properties
were user defined. The porosity of porous medium gel was defined as 0.3 between
solid (0) and free flow (1), and permeability was defined as 1 x 10-14 m2 (Grattoni,
Al-Sharji et al. 2001). The porosity of free flow area was defined as 1, and
22
permeability was defined as 1 m2. For setting species transport in porous media, we
defined the porosity of PA gel as 0.3, and bulk density 1000 kg/m3 to represent water.
The diffusion coefficient of sucrose in porous media was defined as 1 x 10⁻¹⁰ m2/s,
which was smaller than that in free flow media. The other parameters were defined as
in the previous case, and the mesh settings was physics-controlled mesh consisted of
5125 elements (coarser).
2.6 Cell culture and cell migration analysis
The cell line used in our studies was C2C12 mouse myoblast cells. The cells
were kept in the conventional incubator (37℃, 5%CO2) and supplied with cell culture
media (10% FBS and 1% antibiotics in Dulbecco’s Modified Eagle’s Medium). For
cell culture test in the device, the cells were delivered to the cell culture camber by
pipeting the cell suspension (106 cells/ml) several times in front of the outlet. When
culturing cells in high osmolarity culture media, we added sucrose to increase the
osmolarity and had the cell density relatively low (2000 cells/cm2) to decrease the
possibility of cell-cell contact.
For cell migration experiments, the cell density on the PA gel was 1850 cells/cm2.
The cells were cultured at conventional incubator for 24 hours before cell migration
tracking. During the cell migration tracking, the cells were cultured at a customized
cell culture chamber on a motor stage of the microscopy. The environment was kept
23
as in a conventional incubator.
To analyze the cell migration on a gradient-compliant PA gel, we tracked the
cells by a phase contrast microscope. Six fields from the hard regions to the soft
regions were chose and captured at 20 min intervals over 8hrs through CCD digital
camera. Cells that came into contact with each other were excluded from tracking. We
used a Labview program to identify the centroids of the cells, and the data were
transferred to the excel format, which can be the imported to Image J
(chemotaxis_tool) for further analysis. The windrose plots were showed for
qualitative results of cell migration path. The tactic index (TI) was used to
quantitatively describe how strongly the cell migration was influenced by the
stimulation (Isenberg, DiMilla et al. 2009; Sochol, Higa et al. 2011).
TI=X L
X: mean displacement along gradient direction; L: total path length
TI would be 0 if the cell migration was unbiased, and 1 if it was fully biased.
After being incubated for 48hrs, cells were fixed and stained with
4’,6-diamidine-2’-phenylindole dihydrochloride (DAPI) to count the number of cells
in different places on the PA gel. All the statistical analyses were performed with t-test
except one sample t test for tactic index.
24
Chapter 3. Results and Discussion
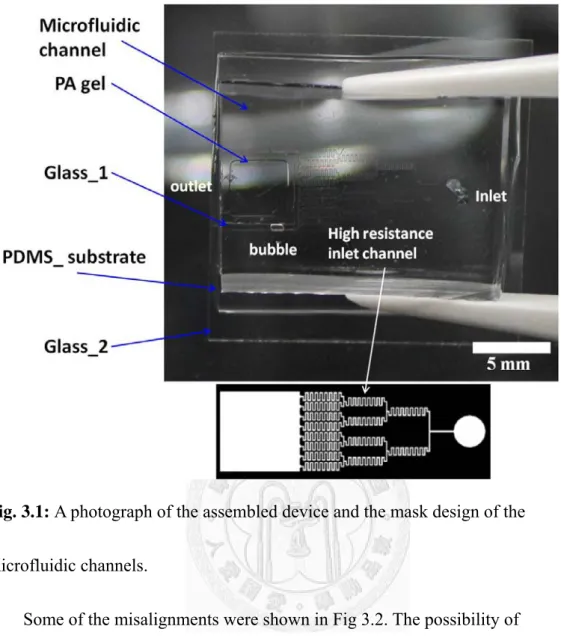
3.1 The integrated PA gel-microfluidic device
A photograph of our device is shown in Fig 3.1, and a picture of the photomask
is also shown below it to demonstrate the microfluidic channel design more clearly.
The long inlet channels are designed to increase the hydraulic resistance in these
channels, and that high resistance can increase the flow stability in the source side of
the cell culture chamber. This will be important to have uniform concentrations along
the direction perpendicular to the input flow. The whole device is transparent, which
is an advantage for cell-research users because this will be compatible to their daily
instrument, for example, the phase contrast microscope. However, the thickness (1
mm) of the PDMS substrate will be an issue if the user wants to study cell organelles
or cytoskeletons. The possible solution for the thickness issue will be further
discussed in chapter five. Air bubbles appear sometimes in the device during injecting
deionized water into the cell culture chamber by connecting the inlet to the syringe.
However, it does not affect the performance of the device since the bubbles will
disappear easily when we immerse it in the deionized water overnight. The device can
be kept in sterilized deionized-water for over one week before the functionalization
process of the PA gel.
25
Fig. 3.1: A photograph of the assembled device and the mask design of the
microfluidic channels.
Some of the misalignments were shown in Fig 3.2. The possibility of
misalignments during bonding process can be largely decreased though designing
lock and key structures to the microfluidic channels and the PDMS substrate,
respectively. Another misalignment is caused by that the PA gel were not fully cover
the Glass_1 (Fig 3.2, c). PDMS might lead to this consequence because it can
interfere with the polymerization of PA gel. To our knowledge, there is no appropriate
explanation to this phenomenon, thus making this issue much difficult to be solved.
Despite of this issue, the device is still capable to generate a stable concentration
26
gradient when the input flow is slow enough to make the solute can only move
through diffusion in the cell culture chamber.
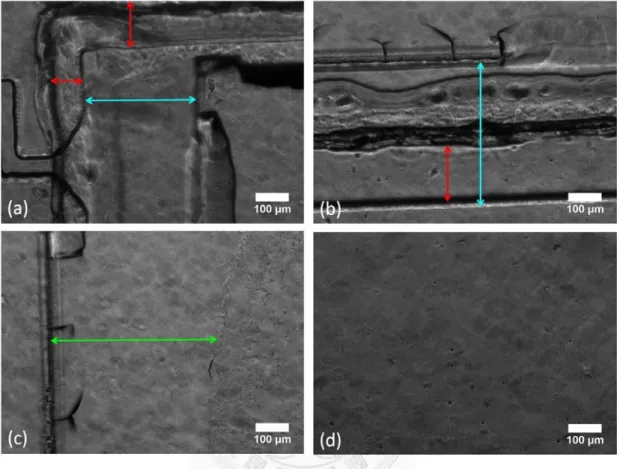
Fig. 3.2: Top-view phase contrast images of the cell culture chamber in the device. (a),
(b) and (c) indicate the misalignments of the device. Red arrows mean the distance
between the edge of microfluidic channels and the edge of the PDMS substrate. Blue
arrows: microfluidic channels and Glass_1. Green arrow: Glass_1 and PA gel. (d) The
surface of the PA gel in the device.
27
3.2 Concentration gradients generation and analysis
3.2.1 Simulation of the sucrose concentration gradient
The simulation results are shown in Fig 3.3. There are eight inlet ports to the cell
culture chamber, and these eight point sources form a line source to supply the solute
to diffuse into the cell culture chamber. The line source will be more appropriate to
generate uniform concentration gradient along different position of y-axis. The arrow
surface also shows the velocity field is uniform in the cell culture chamber. The data
suggests that the device needs six to ten hours to have a stable gradient (Fig 3.3, b) by
computing the gradients change along the white arrow (Fig 3.3, a) in a time dependent
study. From these simulations, we also noted that the highest concentration in the
source side of cell culture chamber is slightly lower (e.g. 190 mol/m3) than the inflow
setting (e.g. 200 mol/m3). In fact, when the position of the inlet was set much far from
the cell culture chamber, this concentration drop between the inlet and source side
would be more significant (e.g. 200 mol/m3 to 65 mol/m3, data not shown). That can
be an important reference to decide what the concentration would be in the inlet to
generate the gradients we need in the cell culture chamber.
Considerate the cell culture chamber is constructed from free flow area (the main
channel in Fig 2.1, b) and porous media (PA gel), we analyzed the concentration
28
distribution in the cross section area (Fig 3.3, c). There is no significant difference in
the concentration distribution between free flow area and porous media when we set
the thickness of the two layers are equal to 100 μm. However, the flow velocity
profiles in these two areas are quite different caused by the low permeability (10-14 m2)
of the PA gel. The highest flow velocity in the free flow area is about 0.15 μm/sec
(Fig 3.3, d), but it is almost zero in the porous media. It might explain that the
fluorophore still existed in the PA gel after wash the whole cell culture chamber with
deionized water several times. The velocity profile is similar with other simulation
work for free flow-porous media (COMSOL model gallery, Model ID: 170).
29
Fig. 3.3: Simulation of concentration gradient and data plots. (a) Top-view of the
concentration gradients in the cell culture chamber. (b) A time-dependent change of
the concentration gradient along the white arrow in (a). (c) A cross section view of the
concentration gradients in the cell culture chamber. (d) Perpendicular velocity profile
along the black arrow in (c).
30
3.2.2 Trypan blue concentration gradient
The concentration gradient of trypan blue generated by our device is shown in
Fig 3.4. This color gradient existed for over than 36 hours. The concentration gradient
upon the PA gel (AÆA’) is plotted on the right figure. Despite the experimental result
dose not fit much to the simulation result, they give the same trend. Besides the
structure defects described in section 3.1 (Fig 3.2, a, b and c), the non-well controlled
flow rate might also lead to this consequence. The syringe pump can generate flow
rate below than 0.1μL/hr, which is slow enough to have a concentration gradient in
the cell culture chamber from the simulation work. However, we often failed to
generate concentration gradients in the real operation. In some fluorescent
experiments, the whole bulk area (Fig 2.2, a) emitted fluorescence after operating the
device at a flow rate of 0.053μL/hr for 24 hours. The fluorescent intensity of the bulk
area was larger than the intensity of the PA gel area. That might be explained by the
flow was not slow enough to have a more diffusion-like solute distribution. In the
case shown in fig 3.4, we used a passive pump to generate the flow, but the protocol
to operate passive pump has not been established. A more sophisticated method to
control the flow velocity might be a priority.
31
Fig. 3.4: A photograph of the trypan blue concentration gradient generated by the
device. The data plot (right) describes the concentration gradient from A to A’ (left),
which is the width of the PA gel.
3.3 Characterization of the gradient-compliant PA gel
3.3.1 Stiffness gradient
The gels used here were polymerized on a coverslip (18 x 18 mm2), and the only
different parameter of these two gels is exposure time: 8 minutes (Fig 3.5, a) and 7.5
minutes (Fig 3.5, b). The data plots suggest that there might be a saturation zone in
the hardest region. The measurement of the soft region is difficult to get accurate data.
Therefore, the linear stiffness gradient only exists in the middle region (more than
one-fourth of the total area). The strength of the gradients (4.43 kPa/mm and 3.51
kPa/mm) should be enough to induce durotaxis for vascular smooth muscle cells
(Wong, Velasco et al. 2003). However, it should be careful to apply these data to have
a quantitative analysis with regard to the relationship between stiffness gradients and
32
cell migration. It is difficult to establish an effective protocol to measure the soft
material like PA gel with an atomic force microscope. Furthermore, PA gel may not be
a purely elastic substrate and some data processing will be necessary to provide more
accurate information (Isenberg, DiMilla et al. 2009). Even with this quantitative
analysis issue, the gradient polymerization method is still easy and robust to generate
gradient-compliant PA gel.
33
Fig. 3.5: Stiffness measurement of the gradient-compliant PA gels. The distance
between two measured points is 1 mm, and the measurement was conducted
continuously from the hard region to the soft region. The data is the average elasticity
of each point. (a) Exposure time: 8 minutes. (b) Exposure time: 7.5 minutes.
34
3.3.2 Fibronectin densities
There is no significant difference of the fluorescence among different positions
on the gradient-compliant PA gel. For comparison, the uniform-gradient PA gel is also
showed. These results suggest that the difference of stiffness or polymerization degree
would not affect the protein conjugation to the PA gel. The fluorescent intensity
profile is similar with other research (Isenberg, DiMilla et al. 2009).
Fig. 3.6: Fibronectin densities of the PA gels. Data are shown in Mean ± SD.
3.4 C2C12 cell culture and analysis
3.4.1 Cell culture in the integrated PA gel-microfluidic device
We have cultured C2C12 cells in four different devices (Fig 3.7). Three of four
are successful, and the one (device 4) failed to culture cells might have a
non-functionalized PA gel. This assumption is lead by two observations. First, there
are cells attached on Glass_1 in device 4, thus the ECM protein and other conditions
35
(pH, temparature..etc.) must function appropriately. Second, even the rough surface in
device 3 doesn’t affect cell culture much. The cause of failed ETC-fibronectin
reaction should come from inappropriate bonding between microfluidic channel and
PDMS substrate. As mentioned in section 2.4.2, the DCDMS might transfer to the
surface of PDMS substrate and make bonding failed in the containminated area.
When injecting the reactants into the failed-bonding device with a syringe, the flow
will leak out the device through these failed-bonding regions, which are lower
hydraulic resistance channels. This leakage can also be found when the failed-bonding
device was tested with fluorescent dye. If the DCDMS transfer issue is addressed
properly, the device is easy to perform cell culture with only slightly changes of
functionalization of PA gel and cell culture protocol.
36
Fig. 3.7: Cell culture after seeding for 24 hours in the devices. Only device 4 failed to
have a normal cell culture result.
3.4.2 Cell culture in the high osmolarity cell culture medium
After culturing the C2C12 cells in the conventional culture dish with high
osmolarity cell culture medium for 7 hours, most of the cells still did not spread out
(Fig 3.8, 200mM). The osmolarity of DEME we used is 332-352 mM/kg, thus the
osmolarity of the cell culture medium with high concentration sucrose would be about
532-552 mOsm. The osmolarity more than 500 mOsm may decrease the cell viability
(Alfieri, Bonelli et al. 2006). However, some of the cells can spread out after exposing
to hypertonic environment for 26 hours, though the average cell area is still smaller
37
than control group (Fig 3.9). The effect of high osmolarity on cell morphology,
projection area, perimeter and circularity ratio, would be much clear by comparing
with the results of control group (p<0.001). The findings are different from other
studies which show that hypertonic stress didn’t induce significant morphological
differences of C2C12 cells or even induced an opposite response (Hwang, Lee et al.
2002; Van Donkelaar, Daniels et al. 2003). Non-confluent cell culture or single cell
culture might be important for C2C12 to have a different response under hypertonic
stress. Moreover, this cell morphology changes between different time periods of
hypertonic stimulation may imply C2C12 cells can sense and adapt to the hypertonic
environment. Therefore, it is possible that C2C12 cells can respond to an osmotic
gradient. A quantitative description of cell morphology is shown in table 1.
Fig. 3.8: Cell culture with or without high concentration sucrose.
38
Fig. 3.9: Quantitative analysis of C2C12 cell morphology changes under hypertonic
stress.Treat C2C12 cells treated with hypertonic medium significantly induce
morphological changes. The morphological differences between experimental groups
(7hr and 26hr) imply a compensatory mechanism to the hypertonic stress
Table 1: Quantitative description of C2C12 cell morphology under different
hypertonic stress. Area (μm2), perimeter (μm), Ctrl=Control group.
39
3.4.3 Cell migration on a gradient-compliant PA gel
The windrose plots (Fig 3.10) qualitatively show C2C12 cells migration path on
a gradient-compliant PA gel. We divide the cell tracking points into two categories,
one is harder region (hard in Fig 3.10) where the elasticity of the substrate is large
than 12 kPa, and the other is softer region (mid and soft in Fig 3.10) where the
elasticity of the substrate is small than 12 kPa. The preferred migration directions of
C2C12 cells are opposite in the two regions. However, the quantitative analysis (Fig
3.11) shows only C2C12 cells from the hard region have a significant TI value
compared to zero (no biased). The mean of TI in hard region is 0.22 (table 2) which
represents a strong biased migration driven by stiffness gradient (Isenberg, DiMilla et
al. 2009; Sochol, Higa et al. 2011). The cell migration difference is similar with
previous studies, which demonstrated that cell migration speed is faster on a softer
substrate (Lo, Wang et al. 2000; Wong, Velasco et al. 2003).
40
Fig. 3.10: Windrose plot of cell migration path and positions of cell tracking on a
gradient-compliant PA gel.
Fig. 3.11: Quantitative analysis of C2C12 cell migration speed and TI.
Table 2: Quantitative description of C2C12 cell migration speed and TI.
41
The cell number distribution among different position is shown in fig 3.10. This
data showed a trend that the cell would accumulate at harder region. Consider the
average migration speed of C2C12 cells is about 30μm/hr (Table 1), the trend might
be more significant if we culture the cells for more days (e.g. one week). The
distribution is also important to evaluate whether the C2C12 cell can respond to
stiffness gradient.
Fig. 3.12: Distribution of cell numbers along a gradient-compliant PA gel.
The gel was equally separated into eight columns, and each column was further
separated into ten rows. Therefore, there are ten data points in each column. The
number in the x-axis represents each column sequentially from the hard region to the
soft region. The cell numbers were described in Mean ± SEM of the ten data points in
each column.
42
3.5 Evaluation of 2D and 3D hydrogel-microfluidic integration systems
Besides embedding a 2D gel in a microfluidic system, fabricating a 3D gel in the
microfluidic channels would be another design strategy, such as the device developed
by Kamm’s group (Chung, Sudo et al. 2009; Chung, Sudo et al. 2010). In brief, the
prepolymer solution can fill in specific channels and polymerize to form a 3D scaffold.
This would be easy and intuitive to embed a hydrogel in the microfluidic system.
However, the micro-pillar structure design (to confine gel in a specific region) or a
customized micro-injection tool would increase the fabrication complexity. The main
advantage of Kamm’s device would be a 3D cell culture environment and co-culture.
Despite the co-culture can not be operated in the single cell level, the interaction
between two groups of cell can still provide insightful information to cell behavior
research.
Two important issues to this device would be stiffness control and cell tracking
technique. For most materials used in 3D structure, such as collagen, the
biomechanical cues are coupled to some biochemical cues. If the polymerized degree
of collagen gel were changed, the porosity or pore size of the gel would also be
different. Therefore, the cell would also sense different density of the ECM protein
besides stiffness difference. For cell tracking, it can not be performed as easy as in 2D
surface. Sometimes the cell has to carry fluorescent protein for live image tracking.
43
The total distance of cell migration is also hard to measure, thus a projected length is
used in most cases. Although we only take two examples to compare (table 3), the
strengths and weaknesses listed should be appropriate to represent general cases.
Table 3: A comparison table of 2D and 3D hydrogel-microfluidic integrated systems.
44
Chapter 4. Conclusion and Future works
We have successfully developed a unique fabrication process to integrate a
gradient-compliant PA gel into a microfluidic system. Most of the characteristics of
the gradient-compliant PA gel have been evaluated. The ability to generate
concentration gradients through our device has also been demonstrated. In theory, this
integrated PA gel-microfluidics device could generate two well-controlled mechanical
cues simultaneously to guide cell migration. The C2C12 cell experiments also provide
important information for further experimental design to test our hypotheses.
To fully demonstrate the potential of our device, there are three important future
works. First of all, establish a protocol or a solid approach to well control the inlet
flow. It is especially important since we need the flow to be slow enough such that the
movement of solutes will be similar with random walk. Passive pump or osmotic
pump (Park, Hwang et al. 2007) are possible solutions and good references to control
very slow speed flow. The challenge would be learning about these two approaches.
Secondly, eliminate the structure defects. These defects will interfere with the
control to the concentration gradients, thus increasing the complexity of quantifying
the relationship between signals and cell migration. Besides the lock and key design
described before, fabricate the master mold of PDMS substrate through
45
photolithography will also be useful. The difficulty would be familiar with multi-layer
SU-8 photoresist processing to construct the spacing in fig 2.7. Another good
approach is to fabricate thin-film PDMS substrate (Jo, Van Lerberghe et al. 2000).
Besides eliminating structure defects, we can replace the groove with a hole, thus
removing the cost of customized Glass_1. It may also enable our device be capable to
be studied with high power objective lens. The difficulty would be establishing an
effective protocol to reproduce the thin-film PDMS substrate.
Finally, use other cell types to evaluate the performance of our device. For
example, VSMC cells, which has been shown that they would respond to stiffness
gradient. Another example, the astrocyte, which has been demonstrated that it prefers
to migrate to the hypotonic region. Although it may increase the cost of the reagents
for cell culture, we can benefit from shortening the time to confirm our device
function well. That will certainly accelerate the optimization of this dual cues device.
For C2C12 cell migration studies, we can evaluate TI value to verify the impacts
of stiffness and osmotic gradients on guiding cell migration. The migration speed
difference between single cue and dual cues (e.g. osmotic and stiffness gradients in
parallel) would be an appropriate approach to test the facilitation between the two
signals.
46
Reference
Alfieri, R. R., M. A. Bonelli, et al. (2006). "Creatine as a compatible osmolyte in muscle cells exposed to hypertonic stress." The Journal of physiology 576(2):
391-401.
Barkefors, I., S. Le Jan, et al. (2008). "Endothelial cell migration in stable gradients of vascular endothelial growth factor A and fibroblast growth factor 2." Journal of
Biological Chemistry 283(20): 13905-13912.
Chung, S., R. Sudo, et al. (2009). "Cell migration into scaffolds under co-culture conditions in a microfluidic platform." Lab Chip 9(2): 269-275.
Chung, S., R. Sudo, et al. (2010). "Microfluidic platforms for studies of angiogenesis, cell migration, and cell–cell interactions." Annals of biomedical engineering 38(3):
1164-1177.
Engler, A. J., M. A. Griffin, et al. (2004). "Myotubes differentiate optimally on substrates with tissue-like stiffness." The Journal of cell biology 166(6): 877-887.
Engler, A. J., F. Rehfeldt, et al. (2007). "Microtissue elasticity: measurements by atomic force microscopy and its influence on cell differentiation." Methods in cell biology 83: 521-545.
Engler, A. J., S. Sen, et al. (2006). "Matrix elasticity directs stem cell lineage specification." Cell 126(4): 677-689.
Gardel, M. L., I. C. Schneider, et al. (2010). "Mechanical integration of actin and adhesion dynamics in cell migration." Annual review of cell and developmental biology 26: 315-333.
Grattoni, C. A., H. H. Al-Sharji, et al. (2001). "Rheology and permeability of crosslinked polyacrylamide gel." Journal of colloid and interface science 240(2):
601-607.
Gribova, V., T. Crouzier, et al. (2011). "A material's point of view on recent developments of polymeric biomaterials: control of mechanical and biochemical
47
properties." J. Mater. Chem. 21(38): 14354-14366.
Hanson, L., L. Cui, et al. (2011). "A microfluidic positioning chamber for long‐term live‐cell imaging." Microscopy Research and Technique 74(6): 496-501.
Hwang, S. M., R. H. Lee, et al. (2002). "Expression of aquaporin-5 and its regulation in skeletal muscle cells." Experimental & molecular medicine 34(1): 69.
Isenberg, B. C., P. A. DiMilla, et al. (2009). "Vascular smooth muscle cell durotaxis depends on substrate stiffness gradient strength." Biophysical journal 97(5):
1313-1322.
Jaeger, M., M. Carin, et al. (1999). "The osmotic migration of cells in a solute gradient." Biophysical journal 77(3): 1257-1267.
Jo, B. H., L. M. Van Lerberghe, et al. (2000). "Three-dimensional micro-channel fabrication in polydimethylsiloxane (PDMS) elastomer." Microelectromechanical Systems, Journal of 9(1): 76-81.
Kandow, C. E., P. C. Georges, et al. (2007). "Polyacrylamide hydrogels for cell mechanics: steps toward optimization and alternative uses." Methods in cell biology 83: 29-46.
Li Jeon, N., H. Baskaran, et al. (2002). "Neutrophil chemotaxis in linear and complex gradients of interleukin-8 formed in a microfabricated device." Nature biotechnology 20(8): 826-830.
Lo, C. M., H. B. Wang, et al. (2000). "Cell movement is guided by the rigidity of the substrate." Biophysical journal 79(1): 144-152.
Loitto, V. M., T. Karlsson, et al. (2009). "Water flux in cell motility: expanding the mechanisms of membrane protrusion." Cell motility and the cytoskeleton 66(5):
237-247.
Nemir, S., H. N. Hayenga, et al. (2010). "PEGDA hydrogels with patterned elasticity:
Novel tools for the study of cell response to substrate rigidity." Biotechnology and bioengineering 105(3): 636-644.
48
Papadopoulos, M., S. Saadoun, et al. (2008). "Aquaporins and cell migration."
Pflügers Archiv European Journal of Physiology 456(4): 693-700.
Park, J. Y., C. M. Hwang, et al. (2007). "Gradient generation by an osmotic pump and the behavior of human mesenchymal stem cells under the fetal bovine serum
concentration gradient." Lab Chip 7(12): 1673-1680.
Park, J. Y., S. J. Yoo, et al. (2009). "Simultaneous generation of chemical
concentration and mechanical shear stress gradients using microfluidic osmotic flow comparable to interstitial flow." Lab Chip 9(15): 2194-2202.
Saadoun, S., M. C. Papadopoulos, et al. (2005). "Involvement of aquaporin-4 in astroglial cell migration and glial scar formation." Journal of cell science 118(24):
5691-5698.
Sochol, R. D., A. T. Higa, et al. (2011). "Unidirectional mechanical cellular stimuli via micropost array gradients." Soft Matter.
Tse, J. R. and A. J. Engler (2010). "Preparation of hydrogel substrates with tunable mechanical properties." Curr Prot Cell Bio Chpt 10: 1-16.
Van Donkelaar, C., M. Daniels, et al. (2003). "Cell deformation in response to long-term hyperosmotic loading." Acta of Bioengineering and Biomechanics 5(1):
3-10.
Wong, J. Y., A. Velasco, et al. (2003). "Directed movement of vascular smooth muscle cells on gradient-compliant hydrogels." Langmuir 19(5): 1908-1913.