i
國 立 交 通 大 學
資訊管理研究所
碩 士 論 文
影響使用者利用 YouTube 分享影片因素之研究
Predicting the determinants of users’ intention in using
YouTube to share video
研 究 生:張 錦 梅
指導教授:楊 千 教授
ii
影響使用者利用 YouTube 分享影片因素之研究
Predicting the determinants of users’ intention in using
YouTube to share video
研 究 生:張 錦 梅 Student: Suyanti Tan
指導教授:楊 千 Advisor: Chyan Yang
國立交通大學 資訊管理研究所
碩士論文
A Thesis
Submitted to Institute of Information Management College of Management
National Chiao Tung University in Partial Fulfillment of the Requirements
for the Degree of Master of Science
in
Information Management January 2009
Hsinchu, Taiwan, the Republic of China
iii
影響使用者利用 YouTube 分享影片因素之研究
學生: 張錦梅 指導教授: 楊千 博士
交通大學 資訊管理研究所 碩士班
中文摘要
近年來,影片分享網站已經迅速的發展,但是過去的研究很少探討影片分享 網站使用的動機,為了探索使用者參與影片分享網站的行為意願,本研究以科技 接受模型(TAM)為理論基礎,另加入「社會影響」觀點以建立本研究之理論架構, 並進一步以性別為調節變數來分析。 經由國內之 PTT BBS 站與相關討論區等方式散佈問卷所在的網址,進行為期 七週的調查,共回收 341 份有效問卷,其中包含男生 206 份與女生 135 份。研究 結果顯示「認知易用」對參與影片分享網站是很重要的影響因素。此外性別差異 在「社會影響」因素有顯著的不同;「網絡外部性」與「人際規範」對男性使用 者是很重要的影響因子,但對女性使用者而言,「社會規範」才是影響參與分享 影片重要的因素。依據統計分析結果,本研究提出在學術上與實務上的管理意 涵,供後續研究做參考。 關鍵字:影片分享,性別,科技接受模型,社會影響iv
Predicting the determinants of users’ intention in using YouTube to share
video
Student: Suyanti Tan Advisor: Dr. Chyan Yang
Institute of Information Management
National Chiao Tung University
Abstract
The use of video sharing websites has been booming since past few years; nevertheless, little is published about what motive people to use a particular video sharing website. In response, this paper proposed a model based on technology acceptance model and social influences theory with moderating effects of gender.
A survey of 206 male and 135 female video sharer of YouTube found support the model. The result indicated that perceived ease of use is important determinant of intention to use YouTube to share video. Nevertheless, factors from social influences differently affect intention to use YouTube to share video. Perceived network externalities and interpersonal norm are determinants among male users, whereas social norm is key driven of intention to use YouTube to share video among female users. Based on those findings, implications for theory and practice are discussed.
Keywords: video sharing, gender, technology acceptance model (TAM), social influence theory
v
Acknowledgment
First of all, I would like to express my deepest gratitude to my advisor, Professor Chyan Yang, for his constant support, encouragement, excellent advice throughout this study. Without his help, this work would never be possible.
I would like to express my gratitude to my Scholarship sponsor from National Chiao Tung University for financing my study.
I am thankful to Prof. 劉敦仁 and 劉顯仲 for their willingness to be the committee members for my oral defense.
My sincere thanks to my senior Yi-Chun, Hsu for his continuous guidance and advice while doing the whole research. A special thanks also goes to my senior, Andes Young, who greatly enriched my knowledge with his preeminent insights.
I am thankful to all my lab mates for the supports during the research.
I am thankful to Wan-Yu, Chiu who taught me how to use bulletin board systems to spread my questionnaire.
I am thankful to my roommate, Nguyen Thi Nga for her help on editing my thesis writing.
I also thank my colleagues of the IIM student 2007-2008 class in NCTU for sharing experiences and knowledge during the time of study.
Finally, I take this opportunity to express my profound gratitude to my beloved parent, sisters; Yu, Shuang and Jin for their moral support and patience during my study in NCTU.
vi
Table of Contents
Abstract ...iv
Acknowledgment ...v
Table of Contents ...vi
Table of Tables ...ix
Table of Figures ...x
CHAPTER 1 INTRODUCTION ...1
1.1 Research Background and Motivation...1
1.2 Research Purpose ...2
1.3 Research Process Flow Chart...3
1.4 Thesis Organization ...5
CHAPTER 2 LITERATURE REVIEW...6
2.1 Online Video Streaming Overview ...6
2.2 Introduction of YouTube ...7
2.3 Technology Acceptance Model...8
2.4 Social Influence ...10
2.4.1 Perceived Network Externalities...11
2.4.2 Interpersonal Norm ...13
2.4.3 Social Norm ...14
2.5 Moderating Effects of Gender ...14
CHAPTER 3 RESEARCH FRAMEWORK AND METHODOLOGY...16
3.1 Research Framework ...16
3.2 Variables Used in the Research and the Definition...17
vii
3.2.2 Definition of Constructs...17
3.3 Research Hypotheses ...19
3.4 Development of the Questionnaire ...22
3.5 Preliminary Test and Analysis...25
3.5.1 Pre-test and Pilot Test ...25
3.5.2 Reliability Analysis...26
3.5.3 Validity Analysis ...26
CHAPTER 4 RESULTS ...31
4.1. Data Collection ...31
4.2. Analytical Strategy for Assessing the Model...33
4.3. The Measurement Model ...33
4.3.1 Reliability Analysis...33
4.3.2 Convergent Validity and Discriminant Validity ...35
4.3.3 Model fit analysis...40
4.4. Tests of the Structural Model ...41
4.5. Result of Group Analysis: Gender Comparison...44
CHAPTER 5 CONCLUSION AND IMPLICATIONS ...50
5.1. Research Findings and Conclusion...50
5.2. Implications...55
5.3. Limitations ...56
5.4. Direction for Future Research...56
Reference ...58
Appendix 1 Global Top Websites (per November 2008)...64
Appendix 2 Questionnaire – English Version ...65
viii
Appendix 4 First Round Result of CFA reliability analysis ...74 Appendix 5 Structural Equation Model ...75
ix
Table of Tables
Table 1 Definition of the Constructs ...18
Table 2 Measurement Items of the Related Constructs ...23
Table 3 Summary of Questionnaire Sections...24
Table 4 Reliability Statistics ...26
Table 5 Rotated Component Matrix (factor analysis)...27
Table 6 Final List of Measurement Items of the Related Constructs...29
Table 7 Profile of respondents ...32
Table 9 Convergent Validity ...36
Table 10 Inter-correlation of constructs ...37
Table 11 Pairwise discriminant analysis of constructs...38
Table 12 Overall fits of model ...40
Table 13 Result of structural modeling analysis ...41
Table 14 Effects on intention to use YouTube to share videos ...43
Table 15 Result of hypotheses test...44
Table 16 Gender comparison fits of model...45
Table 17 Result of structural modeling analysis: grouping by gender...46
x
Table of Figures
Figure 1 Research Process Flow Chart ...4
Figure 2 YouTube’s webpage...7
Figure 3 Technology Acceptance Model ...9
Figure 4 Research Model ...16
Figure 5 Result of structural modeling analysis ...42
Figure 6 Result of structural modeling analysis for male group...47
1
CHAPTER 1 INTRODUCTION
This research aims to examine a theoretical model of user’s intention in using YouTube to share videos. We start this chapter by explaining the basic thinking, motivation and purpose of doing this research. Consisting four sub-chapters, this chapter is organized as follows: first is explaining the author’s background and motivation, second is about the research purpose, third is illustrating the research process and fourth is about how this thesis was organized.
1.1 Research Background and Motivation
Nowadays internet has been widely used all over the world. Its functions have also grown not only as the media for communicating data, but also for sharing knowledge, picture, audio, video, and other time-based data (Garrison, 2001). It means that website is no longer regarded as the text or written word, but it is used as a combination of all forms of media and can also function as the source of entertaining, informative media such as television or cinema by uploading the media and sharing it via the internet video sharing application. One of the most successful internet video sharing applications is YouTube. This free online video streaming website has services that allows anyone to view and share videos uploaded by its users.
Since its first launching in December 2005, YouTube has been the leading player in online video and become the destination of both watching and sharing original videos globally across internet using website, mobile devices, blogs, and e-mail (YouTube, 2008). In October 2006, YouTube was sold to Google for $1.65 million (Sorkin, 2006). Since then, YouTube has been set into a multi-billion dollar business, generating advertising revenues for Google and fears of displacement for traditional
2
producers of video. Everybody can upload and watch videos in YouTube. There are hundreds of thousands of videos uploaded daily and more than 100 million videos are watched daily on this popular video sharing website (YouTube, 2008). The traffic of YouTube is the third highest in all categories with 183 millions of monthly visitors globally and in some countries, such as USA, UK, Australia, Canada, Japan, Taiwan, and so on, YouTube ranks number one is video sharing website category (Alexa.com, 2008). List of global top website is provided in appendix.
Seeing this phenomenon, we might have of some questions in our mind, why do people choose YouTube? What are the factors actually contribute to user intention in choosing YouTube to share the videos? The fact that every minute, ten hours of video is uploaded to YouTube tells us how YouTube dominates this video streaming business. The author was motivated to do this research in order to find the answer of this question which may also be useful for the competitors to benchmark on YouTube’s way to success.
Note that in this paper, we only focus on sharing video to the public activities, no matter whether it is original or duplicate, and do not include watching activities. In order to be able to upload and broadcast either public or private video clips of any reasonable length, users have to create an account to upload their videos.
1.2 Research Purpose
We have three main purposes of this research. First is to examine factors in TAM influences user’s intention in choosing YouTube to share videos. Many researches have modified and widely applied TAM to measure the acceptance level of information technology usage (Agarwal & Karahanna, 2000; D. Gefen, Karahanna, & Straub, 2003; P. J. Hu, Chau, Sheng, & Tam, 1999; Moon & Kim, 2001; Teo, Lim, &
3
Lai, 1999; Wang, Hsu, & Fang, 2004; Zhang & Prybutok, 2003). Nevertheless, TAM itself may not enough to reflect the intention of choosing YouTube to share videos. Therefore we also considered factors from social influences in our proposed model. Our second purpose is to examine factors influencing user’s intention in choosing YouTube to share videos in the social influences perspective.
The third purpose is to analyze differences of user intention in choosing YouTube to share videos based on their gender. By making comparison, we want to see where the most significant difference between male user and female user is.
This study applies a structure equation model (SEM) to measure the empirical strength of the relationship in the proposed model. The model is being developed with a major objective in mind. It should improve our understanding of user intention in choosing YouTube to share videos, providing new theoretical insight into the YouTube’s success in video streaming business.
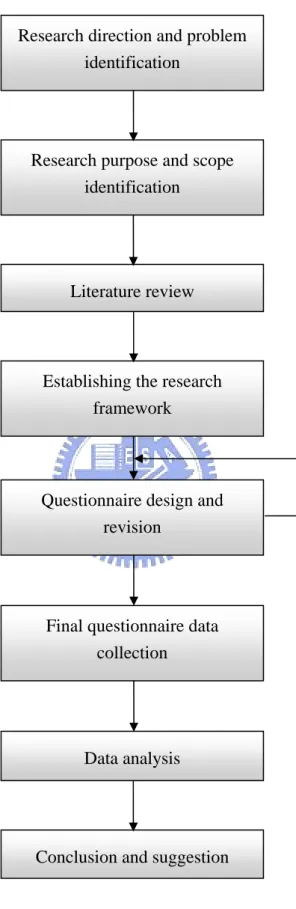
1.3 Research Process Flow Chart
The research is begun with identifying the direction and some problems related to this research as well as the purpose. After all the identification processes, we reviewed the literatures that were useful to this research. The next process is to establish the research framework. Afterwards, based on the research framework, we design the questionnaire for our measurement scale. The questionnaire was revised with the guidance of our advisor to avoid some ambiguities and finally the questionnaire was spread through the internet. We used structural equation modeling to analyze the measurement model and the structural model. The final step was to draw the conclusion and propose some suggestions for the future research. We can see the complete research process flow chart in Figure 1.
4
Figure 1 Research Process Flow Chart Research direction and problem
identification
Research purpose and scope identification
Literature review
Establishing the research framework
Questionnaire design and revision
Final questionnaire data collection
Data analysis
5
1.4 Thesis Organization
Chapter one of this thesis includes the research background, motivation, purpose, and process flow chart. Chapter two explains the literature review and prior knowledge. Chapter three describes the framework and methodology used in this research. Chapter four includes the measurement model result and structural model. Finally, the last chapter intends to present some implications, and to propose some suggestions for the future research.
6
CHAPTER 2 LITERATURE REVIEW
The purpose of this chapter is to arrange the literature or prior knowledge related to our research. This chapter consists of three sub-chapters. The first sub-chapter describes the overview of online video streaming. Second is about introduction of YouTube. In the third sub-chapter, we review popular theory of technology acceptance model. The last sub-chapter explains about the extended factors, that is theory of social influences.
2.1 Online Video Streaming Overview
Online videos existed long before YouTube entered the scene. Nevertheless, the early generation technology to upload videos, managing, sharing and watching them were lack of a user-friendly platform. The videos people shared by traditional media server or peer-to-peer were standalone units. For example, a show contained several episodes would be uploaded per episode for a single video and each single video would be not connected to other related video clips. Also, difficult to give ratings or comments of video clips are also the weaknesses of this kind of internet video sharing. But when YouTube and some other competitors as the new generation of internet video sharing entered this market, they brought their products or service with the better features and overcame those problems. They allow users to upload video effortlessly, automatically converting from many different formats, and to tag uploaded videos with keywords. Users can easily share videos by mailing the links to them, or embedding them on web pages or in personal blogs. Using the basis of web 2.0 (O’Reilly, 2005), YouTube and others video sharing website enable other users to participate in the webpage by rating and commenting on videos, bringing new social aspects to the viewing of videos. Consequently, popular videos can rise to the top in a
7
very organic fashion. The social network existing in YouTube further enables communities and groups. Videos are no longer independent from each other, and neither are users. This has substantially contributed to the success of YouTube and similar sites.
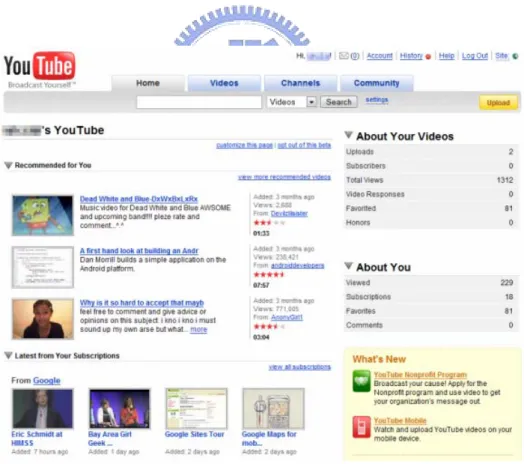
2.2 Introduction of YouTube
Founded in February 2005, YouTube is the leader in online video, and the premier destination to watch and share original videos worldwide through a Web experience. YouTube allows people to easily upload and share video clips on www.YouTube.com and across the Internet through websites, mobile devices, blogs, and email.
Figure 2 YouTube’s webpage Source: www.youtube.com
8
Everyone can watch videos on YouTube. People can see first-hand accounts of current events, find videos about their hobbies and interests, and discover the quirky and unusual. As more people capture special moments on video, YouTube is empowering them to become the broadcasters of tomorrow.
YouTube received funding from Sequoia Capital in November 2005 and was officially launched one month later in December. Chad Hurley and Steve Chen proceeded to become the first members of the YouTube management team and currently serve as Chief Executive Officer and Chief Technology Officer respectively. In November 2006, within a year of its launch, YouTube was purchased by Google Inc. in one of the most talked-about acquisitions to date.
YouTube has struck numerous partnership deals with content providers such as CBS, BBC, Universal Music Group, Sony Music Group, Warner Music Group, NBA, The Sundance Channel and many more.
2.3 Technology Acceptance Model
Technology Acceptance Model, introduced by Davis (1989), was intended to measure the user acceptance of technology use. It is an adaptation from Theory of Reasoned Action (Fishbein & Ajzen, 1975). According to TRA, a person’s behavior is determined by his or her behavioral intention, and behavioral intention is determined by both attitude of a person and subjective norm related to the behavior. Attitude is defined as the positive or negative feeling of a person about doing a behavior. Subjective norm is defined as what the most important people for him or her would think about doing that particular behavior.
9
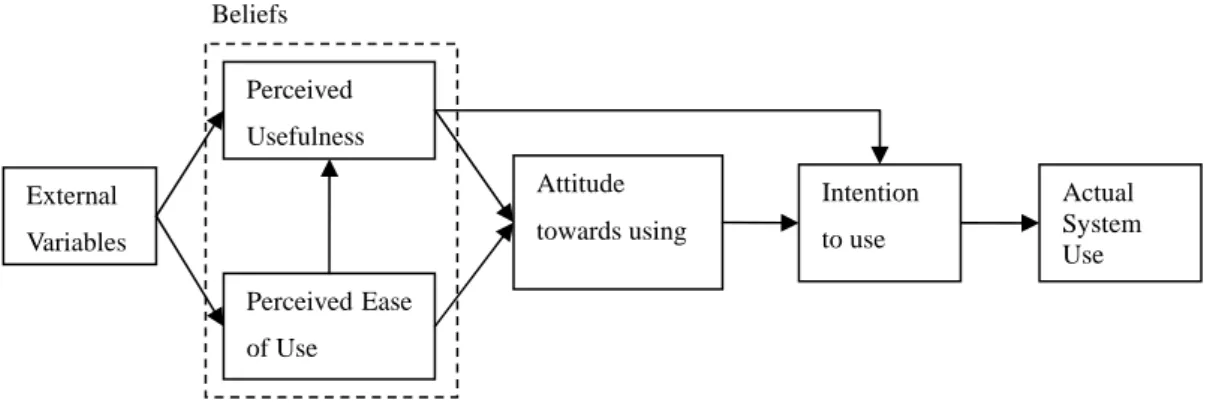
Figure 3 Technology Acceptance Model source: (Davis, 1989)
TAM originally consists of perceived usefulness (PU) and perceived ease of use (PEOU) as belief of a person as shown in Figure 3. These two utility factors are the primary determinants in TAM. Perceived usefulness is defined as the degree to which a person believes that using a specific application system would enhance his or her job and life performance. Perceived ease of use is defined as the degree to which a person believes that using a specific application system would be free of effort. Both beliefs will influence attitude of a person in using an application system. PEOU will affect PU; the easier to use the system, the more the person believes that the system is useful to him or her. Using PU and attitude, we can predict a person’s intention to use the application system.
Few years later, many researchers modified and widely applied TAM to measure the acceptance level of information technology usage (Agarwal & Karahanna, 2000; D. Gefen, et al., 2003; P. J. Hu, et al., 1999; Moon & Kim, 2001; Teo, et al., 1999; Wang, et al., 2004; Zhang & Prybutok, 2003). Agarwal and Karahanna (2000) supported two important beliefs about technology usage: perceived usefulness and perceive ease-of-use related to behavioral intention. Moon and Kim (2001) and Teo,
Beliefs Perceived Usefulness Perceived Ease of Use Attitude towards using Intention to use External Variables Actual System Use
10
et al. (1999) applied extended TAM to predict the determinants of internet or World
Wide Web usage. They found perceived usefulness and perceived ease-of-use, as well as other external variables had relationship to user behavioral intention in using internet and www. Gefen (2003) and Zhang and Prybutok (2005) adapted TAM to find the factors affecting behavioral intention in e-commerce and internet auctions. Their findings corroborated that customers’ intention to transact via internet depended on perceived usefulness and perceived ease-of-use. Wang, et al. (2004) conducted investigations based on TAM and its extension to analyze user acceptance on instant messaging service. Their result showed two beliefs of TAM were related to users’ intention to use instant messenger.
2.4 Social Influence
A social influence process involves behavior by one person that has the effect-or even just the intention-of changing the way another person behaves, feels or thinks about a stimulus (Zimbardo & Leippe, 1991). The stimulus might be political issue, a product, or an activity. Fishbein and Ajzen represented social influence in their theory of reasoned action as subjective norm (Fishbein & Ajzen, 1975). In 1991, Ajzen introduced social influence as subjective norm in theory of planned behavior (I Ajzen, 1991). They pointed out that the more favorable the attitude and subjective norm toward a behavior, the stronger will individual’s intention to perform or to do a behavior. In past several years, many prior studies have proven that social influence significantly effects user behavior (Bhattacherjee, 2000; Chang & Cheung, 2001; Grandon, Alshare, & Kwun, 2005; C. L. Hsu & Lu, 2004; M. H. Hsu & Chiu, 2004b; Liker & Sindi, 1997; Nysveen, Pedersen, & Thorbjornsen, 2005; J Song & Kim, 2006). Chang and Cheung (2001) found that influence from social social on intention
11
to use internet or World Wide Web at work is significant. Bhattacherjee (2000) pointed that subjective norm was an important factor in predicting intention to use electronic brokerage services. He viewed subjective norm as two forms of influence, namely interpersonal influence and external influence. Interpersonal influence refer to influence by family, friends, colleagues, superiors, while external influence referred to influence by mass media, expert opinion (Bhattacherjee, 2000). Hsu and Lu (2003) viewed social influences as two factors: social norm and critical mass. Social norm referred to influence from colleagues, classmates and friends, while critical mass referred to the value of technology to a user increases with the number of its adopters. In predicting the factors of users’ intention in playing online game, they found that social norm significantly related to intention, while critical mass significantly related to attitude (C. L. Hsu & Lu, 2004). If influence from other people can change our belief as long as behavior, it means we response to the social influence (Rawlings, Barry, Skouteris, & Rawlings, 2006). Therefore, in this study, we believe that social influence affecting users’ intention to use YouTube to share videos stems from three sources: perceived network externalities, interpersonal norm and social norm.
2.4.1 Perceived Network Externalities
In using or adopting particular system, people will consider the number of people using this system. In the literature, the term is also known as network externalities or critical mass (Katz & Shapiro, 1994; Kraut, Rice, Cool, & Robert, 1998; Markus, 1987). According to Metcalfe’s law, network externalities exist when the value of a product or service increases as the number of consumers of the product increases, not because of the quality of the product to the consumer (Katz & Shapiro, 1985). Many researches using this theory have been conducted to explain the growth of information technology
12
adoption (Lee, 2006; J. Song & Wladen, 2007).
There are three sources of network externalities (Katz & Shapiro, 1985). The first one is that network externalities may be generated from direct physical effect of the number of users on the quality of the product or service. The utility of phone or fax machine will increase as the number of people using phone of fax machine increases. Another source is an indirect effect where the value of a product increases with the number of users because the quality of the product is higher or there are more complementary products available. After a new kind of operating system is released, it will be more software that is compatible with the new operating system. The last source of network externalities arises in situations where increasing number of sales of a durable good produces greater quality and availability of post-purchase services related to the product depend on the experience and size of the service network. The number of service center of a product increase as the number of the consumer increases. Relating to network externalities theory, the number of shared video in video streaming website like YouTube grows as the number of YouTube viewers grows. In other words, the more people watch YouTube, the more videos could be shared by YouTube. Consequently, perceived network externality is included as one of the antecedents of intention to use in our model.
There are some prominent postulates of network externality theory (Rohlfs, 1974): the value to a user from joining the network is an increasing function of the total number of users who join the network, that users perceive this value and that they make their joining decision based on this perceived value. Video streaming website networks are clearly possessed of network externalities.
13
2.4.2 Interpersonal Norm
Interpersonal influence happens in the most individualized influence situations, in which the number of people immediately involved is small and there is one-to-one communication between influence agent and target (Zimbardo & Leippe, 1991). For example, how a best friend tries to convince you go to watch movie with him, or how a mother try to get his son to clean his room.
In the theory of planned behavior (I. Ajzen, 1985), decision maker’ subjective norms related to their cohesive referents, such as family, friends and colleagues. According to innovation diffusion theory (E. M. Rogers, 1983), users will tend to increase communication with referent others to interpret the IT adoption. Therefore, the interactions with social network will influence their decision about IT adoption. In the newer version of his book, Rogers explained there are two category of communication channel, namely interpersonal channel and mass communication (E. Rogers, 1995).
Interpersonal norm is a direct and unmediated causal effect of one person on another (Friedkin, 1998) or in the other words, peer to peer influence (Hung, Ku, & Chang, 2003). Friedkin also mentioned that the greater the probability of an interpersonal attachment from one person to another, the greater the probability that one person will have some influence on another person. Interpersonal norm refers to ‘‘influence by friends, family members, colleagues, superiors, and experienced individuals known to the potential adopter (Bhattacherjee, 2000).
14
2.4.3 Social Norm
In the theory of planned behavior framework, a social norm is defined as perceived social pressure that is whether or not perform a behavior (I. Ajzen, 1985). Social norm refers to mass media reports and expert opinions considered by individuals in performing a behavior (Bhattacherjee, 2000). According to Zimbardo and Leippe (1991), Influence takes place in mass media settings. Massage and images conveyed over television, radio, and printed publications reach millions of people around the world (Zimbardo & Leippe, 1991). By nature, they are highly impersonal; not only are they designed to be meaningful to many individuals, but they are also communicated through a medium. The communicator is neither physically present nor often explicitly identifiable as a single person or entity but yet the influence can be potent.
The mass media undoubtedly serve many social functions (Lazarsfeld & Merton, 1996). One of them is the status conferral function. In this function, the mass media confer status on public issues, persons, organizations, and social movements. Another function is the enforcement of social norms. Such function catches phrases as the power of the press (and other mass media) or the bright glare of publicity. As for our study, based on those functions stated above, we add social norm as a function of the mass media to influence someone’s behavioral intention.
2.5 Moderating Effects of Gender
Gender has been one of the most common forms of segmentation in marketing practice (Putrevu, 2001). There are three reasons of frequently applying gender as a segmentation strategy. First, information about gender is easily identified and
15
accessed. Second, gender segments are measurable and responsive to marketing mix elements. Finally, gender segments are adequately extensive and profitable (Darley & Smith, 1995). The literature on gender issues in, for example, advertising, is vast and findings suggest that females versus males process advertisements differently, and, consequently, respond differently to marketing communication efforts (Wolin, 2003). Moreover, gender is also frequently being identified as a key moderator in consumer behavior studies (Bendall-Lyon & Powers, 2002; Dommeyer & Gross, 2003; Moutinho & Goode, 1995) and studies of technology usage (D Gefen & Straub, 1997; Venkatesh & Morris, 2000).Gefen and Straub (1997) revealed that women and men differ in their perception of e-mail, while Venkatesh and Morris (2000) found there are gender differences in the determinants for using a new software system at a workplace. The results from these two studies indicate differential effects of gender on determinants for using information technology.
16
CHAPTER 3 RESEARCH FRAMEWORK AND METHODOLOGY
This chapter is devoted to describe the research framework and research methodology used in this study. It contains four sub-chapters: research framework, definition of the constructs, development of the hypotheses and the research methodology.
3.1 Research Framework
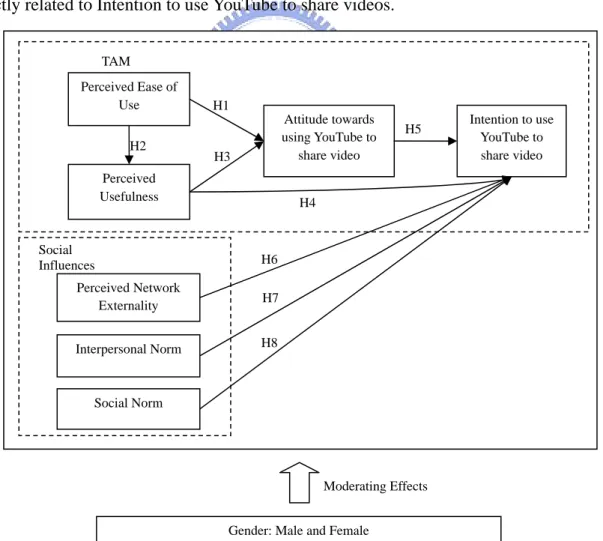
Figure 4 illustrates the research model which was built based on TAM model and social influence from related literature. For social influence, it asserts Perceived Network Externalities, Interpersonal Norm and Social Norm which in this model are directly related to Intention to use YouTube to share videos.
Figure 4 Research Model
Perceived Usefulness Perceived Ease of Use Attitude towards using YouTube to share video Intention to use YouTube to share video Perceived Network Externality Social Influences TAM Social Norm Interpersonal Norm H5 H1 H3 H6 H7 H8 H2 H4
Gender: Male and Female
17
3.2 Variables Used in the Research and the Definition
3.2.1 Variable used in the Research
Referring to the research model at Figure 4, we have two kinds of variables used in this study, exogenous and endogenous variable. The exogenous variables contained Perceived Ease of use from TAM, and Perceived Network Externalities, Interpersonal Norm and Social Norm from social influence. On the other hand, the endogenous variables contained Perceived Usefulness, Attitude towards using YouTube to share videos and Intention to use YouTube to share videos. Based on this work, our study focused on gender as the moderator.
3.2.2 Definition of Constructs
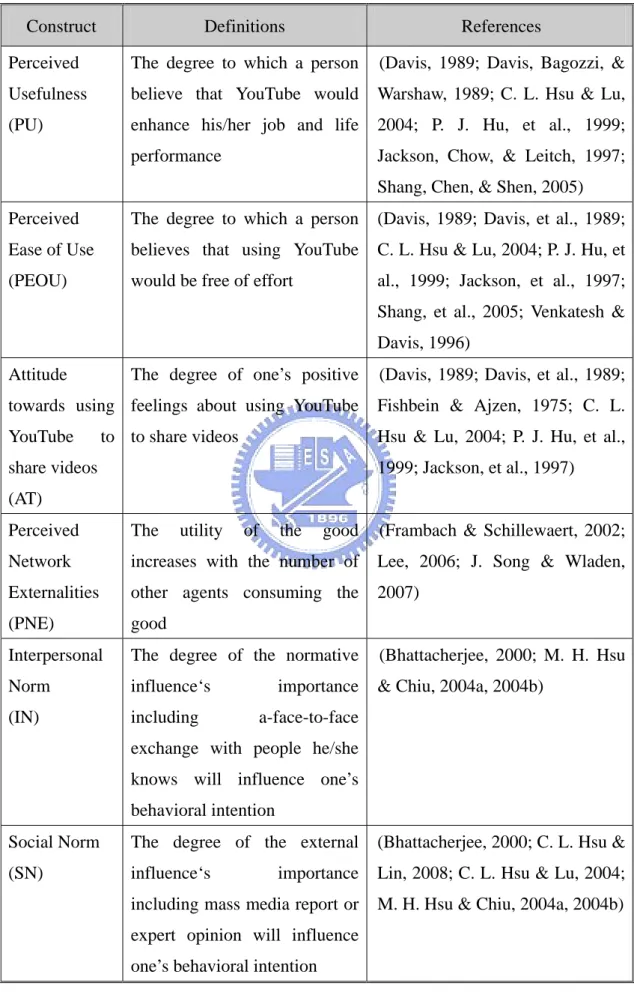
The complete definition of the constructs we used in the study was provided in Table 1. We referred to prior literature related to this topic. For example, for constructs in TAM model including PU, PEOU, Attitude and Intention, we mostly referred to Davis (1989), Davis et al. (1989). In addition, we referred to some others like Jackson et al. (1997), Hu et al. (1999), Hsu & Lu (2004) and Shang et al. (2005) which we consider useful for our study. For perceived network externalities, we referred our definition to the study of Lee (2006), Song & Wladen (2007), while for interpersonal norm and social norm are mostly referred to study ofM. H. Hsu & Chiu (2004), C. L. Hsu and Lin (2008), C. L. Hsu and Lin (2008).
18
Table 1 Definition of the Constructs
Construct Definitions References
Perceived Usefulness (PU)
The degree to which a person believe that YouTube would enhance his/her job and life performance
(Davis, 1989; Davis, Bagozzi, & Warshaw, 1989; C. L. Hsu & Lu, 2004; P. J. Hu, et al., 1999; Jackson, Chow, & Leitch, 1997; Shang, Chen, & Shen, 2005) Perceived
Ease of Use (PEOU)
The degree to which a person believes that using YouTube would be free of effort
(Davis, 1989; Davis, et al., 1989; C. L. Hsu & Lu, 2004; P. J. Hu, et al., 1999; Jackson, et al., 1997; Shang, et al., 2005; Venkatesh & Davis, 1996) Attitude towards using YouTube to share videos (AT)
The degree of one’s positive feelings about using YouTube to share videos
(Davis, 1989; Davis, et al., 1989; Fishbein & Ajzen, 1975; C. L. Hsu & Lu, 2004; P. J. Hu, et al., 1999; Jackson, et al., 1997)
Perceived Network Externalities (PNE)
The utility of the good increases with the number of other agents consuming the good
(Frambach & Schillewaert, 2002; Lee, 2006; J. Song & Wladen, 2007)
Interpersonal Norm
(IN)
The degree of the normative
influence‘s importance including a-face-to-face exchange with people he/she knows will influence one’s behavioral intention
(Bhattacherjee, 2000; M. H. Hsu & Chiu, 2004a, 2004b)
Social Norm (SN)
The degree of the external
influence‘s importance including mass media report or
expert opinion will influence one’s behavioral intention
(Bhattacherjee, 2000; C. L. Hsu & Lin, 2008; C. L. Hsu & Lu, 2004; M. H. Hsu & Chiu, 2004a, 2004b)
19
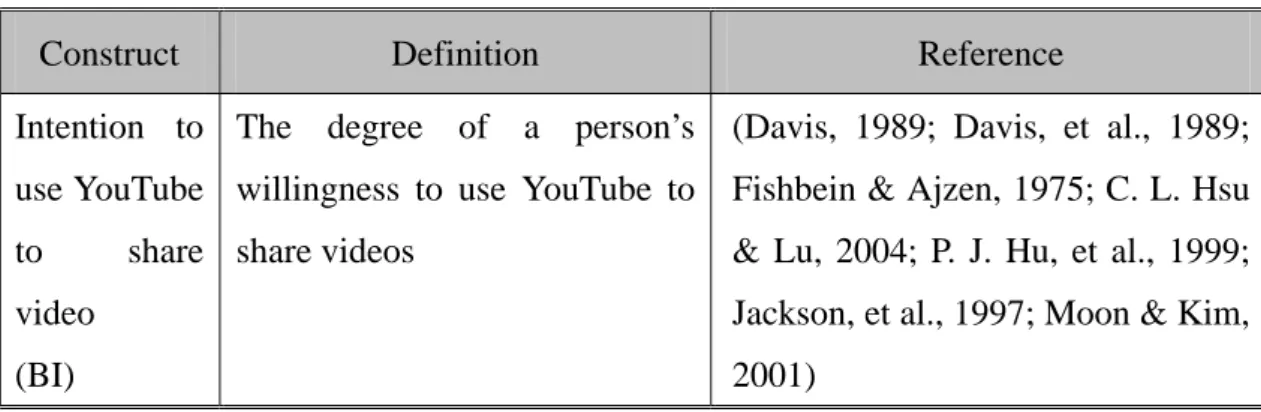
Table 1 Definition of the Constructs (con’t)
Construct Definition Reference
Intention to use YouTube to share video
(BI)
The degree of a person’s willingness to use YouTube to share videos
(Davis, 1989; Davis, et al., 1989; Fishbein & Ajzen, 1975; C. L. Hsu & Lu, 2004; P. J. Hu, et al., 1999; Jackson, et al., 1997; Moon & Kim, 2001)
3.3 Research Hypotheses
This research model adopted the TAM belief-attitude-intention relationship. First of all, we verified the hypotheses related to PU and PEOU. In our study, PEOU is defined as degree to which a person believes that using YouTube would be free of effort. As the previous studies (Davis, 1989; Davis, et al., 1989; C. L. Hsu & Lin, 2008; C. L. Hsu & Lu, 2004; Jackson, et al., 1997) have demonstrated the relationship between PEOU with PU and PEOU with attitude, we therefore established the hypotheses below:
Hypothesis 1. Perceived ease of use is positively related to attitude toward using
YouTube to share videos.
Hypothesis 2. Perceived ease of use is positively related to perceived usefulness.
Many Prior studies (Davis, 1989; C. L. Hsu & Lin, 2008; C. L. Hsu & Lu, 2004; Moon & Kim, 2001) had shown us that PU can both directly and indirectly relate to behavioral intention. In this study, PU is defined as degree to which a person believe that choosing YouTube to share videos would fulfill his/her purpose because there would be many people to watch them so that this activity can enhance their life
20
performance. Therefore, PU was expected to have a positive effect behavioral intention. Also, as the prior studies shown that PU also was directly related to attitude, so we wish to demonstrate the same result here.
Hypothesis 3. Perceived usefulness is positively related to attitude toward using
YouTube to share videos.
Hypothesis 4. Perceived usefulness is positively related to Intention to use YouTube
to share videos.
The last hypothesis in the basis of TAM in our model is to describe the relationship between attitude and intention. We wish to demonstrate the attitude was positively related to intention to use YouTube to share videos.
Hypothesis 5. Attitude toward using YouTube to share videos is positively related to
Intention to use YouTube to share videos.
Aside from TAM’s constructs, we add some constructs from social influence factors. Social influence occurs when somebody’s action is changed by other individuals or things or when somebody has intention to change because of a stimulus (Zimbardo & Leippe, 1991). Stimulus can be people, an activity, a product or an issue. Using web 2.0 platforms, YouTube’s has characteristics as other web 2.0 websites have and the most obvious one is user participation. In YouTube, user can participate in two major ways, sharing and watching videos, or other ways such as rating or commenting a video. The impact of user participation is value of the application will increase as the number of participants increase (O’Reilly, 2005). In sharing video, user will have an expectation his/her video will be watched. If there are no other participants in that application, it is just uploading video for his/her own self and the
21
value of the video will not increase. This condition is in consonance with theory of network externality (Liebowitz & Margolis, 1994). According to Liebowitz and Margolis, network externality is the change in the benefit, or surplus that a person derives from a good when the number of other people consuming the same kind of good changing.
Bhattacherjee explained about two source of social influence in his study (Bhattacherjee, 2000); Interpersonal influence which refers to worth-of-mouth influence by friends, colleagues and superiors, while external influence refers to mass media reports, expert opinions and other non-personal information. Proofs of those sources of influences are supported by marketing studies (Herr, Kardes, & Kim, 1991; Holak, 1988) and information technology product acceptance studies (Agarwal & Prasad, 1997; Brancheau & Wetherbe, 1990; Wangenheim & Bayon, 2003).
Based on this definition, we wish to demonstrate user’s intention to use is positively influenced by perceived network externality (Frambach & Schillewaert, 2002; Lee, 2006; J. Song & Wladen, 2007), interpersonal norm and social norm (Bhattacherjee, 2000; C. L. Hsu & Lin, 2008; C. L. Hsu & Lu, 2004; M. H. Hsu & Chiu, 2004a).
Hypothesis 6. Perceived network externality is positively related to Intention to use
YouTube to share videos.
Hypothesis 7. Interpersonal norm is positively related to Intention to use YouTube to
share videos.
Hypothesis 8. Social norm is positively related to Intention to use YouTube to share
22
3.4 Development of the Questionnaire
The survey instrument for this study was designed using validated items for the prior research as a means of assessing the theoretical constructs of extended TAM model, using TAM scales of PU, PEOU, AT and BI from Davis (1989) and Davis et al. (1989). Besides those two references, for each construct, we used other references as shown in Table 1. A scale for measuring Perceived Network Externalities was developed using the measures of Lee (2006), Song & Wladen (2007) while the measurement of Interpersonal Norm and Social Norm were adapted from M. H. Hsu & Chiu (2004), C. L. Hsu and Lin (2008), C. L. Hsu and Lin (2008),
The questionnaire was divided into three sections: filtering question, main questions and demographic question. Filtering question asked whether the respondent has ever used YouTube to share videos. If the answer is yes, they will go through the next sections. But if the answer is no, they will stop in the current section.
23
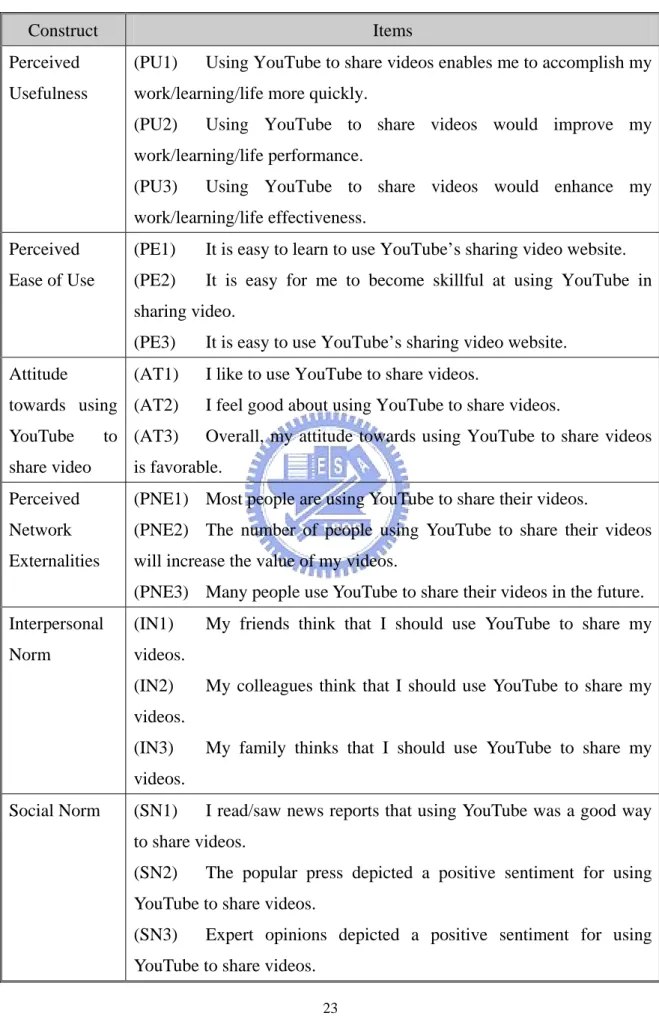
Table 2 Measurement Items of the Related Constructs
Construct Items
Perceived Usefulness
(PU1) Using YouTube to share videos enables me to accomplish my work/learning/life more quickly.
(PU2) Using YouTube to share videos would improve my work/learning/life performance.
(PU3) Using YouTube to share videos would enhance my work/learning/life effectiveness.
Perceived Ease of Use
(PE1) It is easy to learn to use YouTube’s sharing video website. (PE2) It is easy for me to become skillful at using YouTube in sharing video.
(PE3) It is easy to use YouTube’s sharing video website. Attitude
towards using YouTube to share video
(AT1) I like to use YouTube to share videos.
(AT2) I feel good about using YouTube to share videos.
(AT3) Overall, my attitude towards using YouTube to share videos is favorable.
Perceived Network Externalities
(PNE1) Most people are using YouTube to share their videos.
(PNE2) The number of people using YouTube to share their videos will increase the value of my videos.
(PNE3) Many people use YouTube to share their videos in the future. Interpersonal
Norm
(IN1) My friends think that I should use YouTube to share my
videos.
(IN2) My colleagues think that I should use YouTube to share my videos.
(IN3) My family thinks that I should use YouTube to share my
videos.
Social Norm (SN1) I read/saw news reports that using YouTube was a good way to share videos.
(SN2) The popular press depicted a positive sentiment for using YouTube to share videos.
(SN3) Expert opinions depicted a positive sentiment for using YouTube to share videos.
24
Table 2 Measurement Items of the Related Constructs (con’t)
Construct Items
Intention to use YouTube to share video
(BI1) I have the intention of using YouTube to share videos. (BI2) I will frequently use YouTube to share videos in the future. (BI3) I will strongly recommend others to use YouTube to share video in the future.
In the second section, all scales were modified to suit the context of this research and were measured on a five-point Likert scale which “1” was representing “strongly agree” and “5” was representing “strongly disagree”. Table 2 is the list of questions in the Main Questions section.
The third sections contained the demographic questions including respondents’ gender, age, educational background, how long they have been using YouTube, total number of video they have ever shared, average of hours they spent on internet and the category of video they shared. Summary of the questionnaire sections of this study is shown in Table 3.
Table 3 Summary of Questionnaire Sections
Section Item Number of Questions
1 Filtering Question 1
2 Main Questions: Variables used in the Research 21
25
3.5 Preliminary Test and Analysis
In preliminary test, we conducted pre-test and pilot test to as one of the steps of our research processes. After collecting all the data, we used Cronbach’s Alpha to assess the reliability analysis and factor analysis to assess the validity of our model.
3.5.1 Pre-test and Pilot Test
The questionnaire was pre-tested on 5 respondents in order to discuss the length of the instruments, the format, and the clarity and appropriateness of the wording of the scales, which is resulted in the revision of some questions that are considered ambiguous.
For the next phase, the questionnaire was designed to be placed as web pages on the World Wide Web (WWW). We use a free service from www.my3q.com to create free online survey, free online questionnaire. The measure was pilot tested on Institute of Information Management’s graduate students in National Chiao Tung University. We started to spread this online questionnaire on June 18, 2008. Within one week, we collected 64 respondents which only 52 respondents completely filled in the questionnaire. The objective of the pilot study was to precisely examine the statistical validity of the constructs.
26
3.5.2 Reliability Analysis
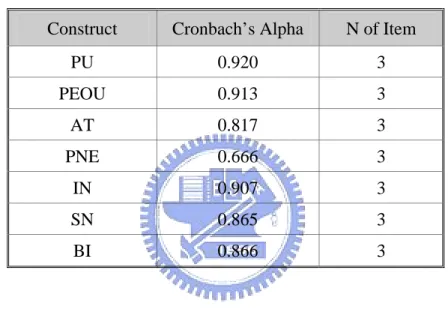
A Cronbach’s Alpha reliability analysis was applied to test the internal consistency of our measurement model. Table 4 shows that each construct has reliability ranging from 0.666 to 0.920. All the values are acceptable because a minimum Cronbach’s Alpha of 0.6 is sufficient for the early stages of the research (Nunnally, 1967).
Table 4 Reliability Statistics
Construct Cronbach’s Alpha N of Item
PU 0.920 3 PEOU 0.913 3 AT 0.817 3 PNE 0.666 3 IN 0.907 3 SN 0.865 3 BI 0.866 3 3.5.3 Validity Analysis
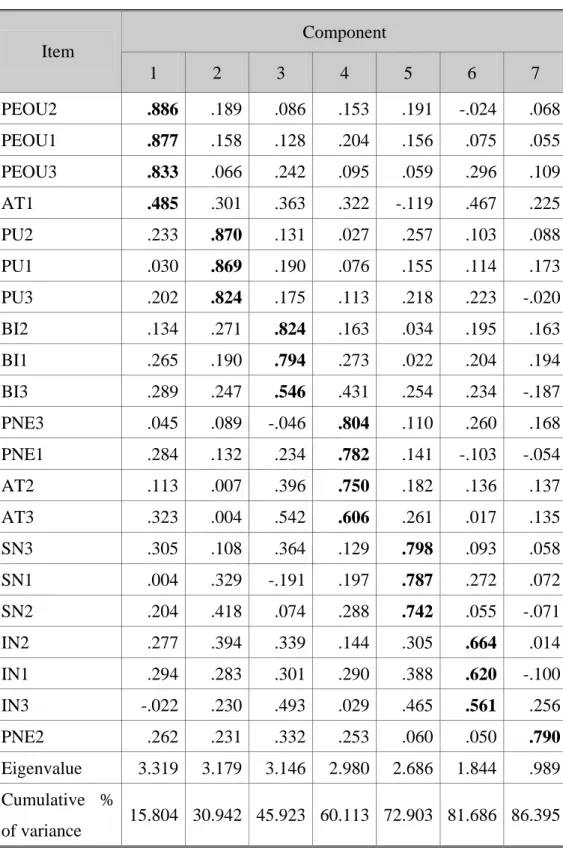
Factor analysis with varimax rotation was performed to ascertain those seven constructs used in this research are distinct constructs. As it is shown in Table 5, the cumulative percentage of variance is 86.395% of the total variance. This number represents that the result is acceptable.
27
Table 5 Rotated Component Matrix (factor analysis) Component Item 1 2 3 4 5 6 7 PEOU2 .886 .189 .086 .153 .191 -.024 .068 PEOU1 .877 .158 .128 .204 .156 .075 .055 PEOU3 .833 .066 .242 .095 .059 .296 .109 AT1 .485 .301 .363 .322 -.119 .467 .225 PU2 .233 .870 .131 .027 .257 .103 .088 PU1 .030 .869 .190 .076 .155 .114 .173 PU3 .202 .824 .175 .113 .218 .223 -.020 BI2 .134 .271 .824 .163 .034 .195 .163 BI1 .265 .190 .794 .273 .022 .204 .194 BI3 .289 .247 .546 .431 .254 .234 -.187 PNE3 .045 .089 -.046 .804 .110 .260 .168 PNE1 .284 .132 .234 .782 .141 -.103 -.054 AT2 .113 .007 .396 .750 .182 .136 .137 AT3 .323 .004 .542 .606 .261 .017 .135 SN3 .305 .108 .364 .129 .798 .093 .058 SN1 .004 .329 -.191 .197 .787 .272 .072 SN2 .204 .418 .074 .288 .742 .055 -.071 IN2 .277 .394 .339 .144 .305 .664 .014 IN1 .294 .283 .301 .290 .388 .620 -.100 IN3 -.022 .230 .493 .029 .465 .561 .256 PNE2 .262 .231 .332 .253 .060 .050 .790 Eigenvalue 3.319 3.179 3.146 2.980 2.686 1.844 .989 Cumulative % of variance 15.804 30.942 45.923 60.113 72.903 81.686 86.395
28
The criteria used to identify and interpret factors were each time should load 0.5 or greater on one factor and 0.35 or below on other six factors (Igbaria, Iivari, & Maragahh, 1995). Some of the result of in Table 5 did not exceed the acceptable values. This may be because of the ambiguity and inappropriateness of the language we used in the questionnaire or there were too few respondents who filled in the questionnaire in this pilot study phase. But after the correction of the language used in each item and the discussion with the Professor, some PhD students, we set the final revision for the questionnaire. The final list of the items in questionnaire is shown in Table 6. The complete questions for the questionnaire are given in the appendix.
29
Table 6 Final List of Measurement Items of the Related Constructs
Construct Items
Perceived Usefulness
(PU1) Using YouTube to share videos enables me to accomplish my work/learning/life more quickly.
(PU2) Using YouTube to share videos would improve my work/learning/life performance.
(PU3) Using YouTube to share videos would enhance my work/learning/life effectiveness.
Perceived Ease of Use
(PE1) It is easy to learn to use YouTube’s sharing video website. (PE2) It is easy for me to become skillful at using YouTube in sharing video.
(PE3) It is easy to use YouTube’s sharing video website. Attitude
towards Using YouTube to share video
(AT1) I like to use YouTube to share videos.
(AT2) I feel good about using YouTube to share videos.
(AT3) Overall, my attitude towards using YouTube to share videos is favorable.
Perceived Network Externalities
(PNE1) Most people are using YouTube to share their videos.
(PNE2) The number of people using YouTube to share their videos will increase the value of my videos.
(PNE3) There will be more people use YouTube to share their videos. Interpersonal
Norm
(IN1) My friends think that I should use YouTube to share my
videos.
(IN2) My colleagues think that I should use YouTube to share my videos.
(IN3) My family thinks that I should use YouTube to share my
videos.
Social Norm (SN1) I read/saw news reports that using YouTube was a good way to share videos.
(SN2) The popular press depicted a positive sentiment for using YouTube to share videos.
(SN3) Expert opinions depicted a positive sentiment for using YouTube to share videos.
30
Table 6 Final List of Measurement Items of the Related Constructs (con’t)
Construct Items
Intention to use
YouTube to share video
(BI1) I have the intention of using YouTube to share videos. (BI2) I will frequently use YouTube to share videos in the future. (BI3) I will strongly recommend others to use YouTube to share video in the future.
31
CHAPTER 4 RESULTS
There are several major objectives for the survey reported in this chapter: (1) to explain the data collection process in this final stage survey, (2) to explain the strategy used to assess the model, (3) to show the result of reliability and validity analysis of the model, and (4) to empirically test the hypothesized causal structure of the proposed model.
4.1. Data Collection
We set an online survey to collect the data through this website, http://www.my3q.com/home2/232/moyazu/YouTubenew.phtml. The survey was started on July 2, 2008 until August 20, 2008, by spreading the website to popular Bulletin Board System in Taiwan (bbs://ptt.cc and bbs://bs2.to) and popular forums for online gamers (http://forum.gamer.com.tw/A.php?bsn=60076 and http://tw.games.yahoo.com/). Respondent were asked to complete all the questions especially questions in main questions section. From 397 of the total respondents, only 341 were usable, while 56 were dropped either because of no experience in sharing videos by YouTube or incompleteness in answering the questionnaire. A complete demographic profile of the respondents is presented in Table 7. The gender breakdown was 60 percent male and 40 percent female. Around 69 percents of respondents was at the age of between 21 and 30 years old, while 27 percents of respondents was at the age under 21 years old. More than half of the total respondents had bachelor’s degree and had more than one year experience in using YouTube to share video.
32
Table 7 Profile of respondents
Measure Items Frequency Percentage
Gender Male 206 60.4% Female 135 39.6% Age < 21 91 26.7% 21-30 236 69.2% 31-40 11 3.2% 41-50 1 0.3% 51-60 1 0.3% >60 1 0.3%
Education Elementary School
or below
1 0.3%
Junior High School 5 1.5%
High School 13 3.8%
Bachelor’s degree 195 57.2%
Graduate degree 127 37.2%
Experience in <6 months 48 14.1%
using YouTube 6-12 months 72 21.1%
to share video >1 year 221 64.8%
Total numbers of <11 281 82.4%
shared video 11-50 44 12.9%
using YouTube 51-100 9 2.6%
>100 7 2.1%
Average hours <1 14 4.1%
spent per day 1-2 41 12%
to use internet 3-4 106 31.1%
5-6 83 24.3%
33
4.2. Analytical Strategy for Assessing the Model
The proposed model was evaluated using Structural Equation Modeling (SEM), a powerful second-generation multivariate technique for analyzing causal models with an estimation of the two components of a causal model: measurement and structural models. The measurement model was measured using Confirmatory Factor Analysis (CFA) to test whether the constructs have the sufficient reliability and validity. The structural model is used to investigate the strength and direction of the relationship between the theoretical constructs. In this study, we used AMOS 7.0 to assess the measurement and the structural model (Arbuckle, 2006; B. M. Byrne, 2001).
4.3. The Measurement Model
The test of the measurement model includes the estimation of reliability analysis, validity analysis and model fitness. CFA reliability analysis includes item reliability, composite reliability and average variance extracted. Validity analysis includes convergent and discriminant validity. Meanwhile, the measure used to assess the model fit includes X2/d.f. ratio, RMR, RMSEA, GFI, AGFI, NFI, TLI, and CFI.
4.3.1 Reliability Analysis
The initial phase of the evaluation indicated that some items should be removed. In the beginning, our result showed that there are items of attitude, perceived network externalities and interpersonal norm have item reliability below the acceptable value of 0.5 (Hair, Anderson, Tatham, & Black, 1992). Thus, we removed these items from our model. We provide the first result of CFA reliability analysis in appendix.
34
Table 8 Final CFA reliability analysis
Item Measurement Item Item
Reliability
Composite Reliability
PEOU1 Using YouTube to share videos enables me to
accomplish my work/learning/life more quickly. 0.666
PEOU2 Using YouTube to share videos would improve my
work/learning/life performance. 0.738
PEOU3 Using YouTube to share videos would enhance my
work/learning/life effectiveness. 0.664
0.8693
PU1 It is easy to learn to use YouTube’s sharing video
website. 0.586
PU2 It is easy for me to become skillful at using
YouTube in sharing video. 0.780
PU3 It is easy to use YouTube’s sharing video website. 0.709
0.8702
AT2 I feel good about using YouTube to share videos. 0.577
AT3 Overall, my attitude towards using YouTube to
share videos is favorable. 0.528
0.7116
PNE1 Most people are using YouTube to share their
videos. 0.589
PNE3 There will be more people use YouTube to share
their videos. 0.663
0.7698
IN1 My friends think that I should use YouTube to share
my videos. 0.771
IN2 My colleagues think that I should use YouTube to
share my videos. 0.796
0.8786
SN1 I read/saw news reports that using YouTube was a
good way to share videos. 0.509
SN2 The popular press depicted a positive sentiment for
using YouTube to share videos. 0.701
SN3 Expert opinions depicted a positive sentiment for
using YouTube to share videos. 0.560
35
Table 8 Final CFA reliability analysis (con’t)
Item Measurement Item Item
Reliability
Composite Reliability
BI1 I have the intention of using YouTube to share
videos. 0.690
BI2 I will frequently use YouTube to share videos in the
future. 0.881
BI3 I will strongly recommend others to use YouTube
to share video in the future. 0.607
0.8877
The retained items were shown in Table 8. Item reliability ranged from 0.509 to 0.881. Composite reliability was computed to measure the internal consistency of the measurement model. As it is shown in Table 8, all composite reliabilities exceeded the recommended value, 0.6 (RP Bagozzi & Yi, 1988). 4.3.2 Convergent Validity and Discriminant Validity
Convergent validity includes analysis of factor loading and average variance extracted. Convergent validity is demonstrated when items load highly. The loading coefficient for all items were above the recommended loadings of 0.7 (Fornell & Larcker, 1981).
36
Table 9 Convergent Validity
Item Factor Loading Average Variance Extracted
PEOU1 0.8161 PEOU2 0.8591 PEOU3 0.8149 0.6894 PU1 0.7655 PU2 0.8832 PU3 0.8420 0.6917 AT2 0.7596 AT3 0.7266 0.5525 PNE1 0.7675 PNE3 0.8142 0.626 IN1 0.8781 IN2 0.8922 0.7835 SN1 0.7134 SN2 0.8373 SN3 0.7483 0.5900 BI1 0.8307 BI2 0.9386 BI3 0.7791 0.7260
Convergent validity is also adequate when all constructs have an average variance extracted (AVE) of at least 0.5 (Fornell & Larcker, 1981). All the value of AVE was also above the suggested threshold. The complete report for convergent validity is shown in Table 9.
To assess discriminant validity, we use the square root of AVE guideline. We checked whether the square root of AVE for each construct is greater than the correlation values of the construct with other constructs (Fornell & Larcker, 1981). Table 10 shows the inter-correlation between the constructs. Diagonal elements are the square root of AVE for that construct.
37
Table 10 Inter-correlation of constructs
PEOU PU AT PNE IN SN BI PEOU 0.8303 PU 0.279 0.8317 AT 0.575 0.341 0.7433 PNE 0.510 0.193 0.803 0.7912 IN 0.300 0.289 0.271 0.272 0.8851 SN 0.426 0.370 0.629 0.478 0.535 0.7681 BI 0.566 0.352 0.676 0.560 0.445 0.586 0.8521
As Table 10 shows, correlation between PNE and AT (0.803) is greater than the square root of its AVE (0.7433). Even though according to Kline (2005), value of correlations of the constructs under 0.85 are not categorized as high (Kline, 2005), but we decided to do another guideline of discriminant validity, namely pairwise discriminant analysis, in order to break of the doubt of the first test’s result.
Pairwise discriminant analysis is to compare the original CFA model with other alternative measurement models, which included every possible combination of combining two constructs into one (D. Gefen, et al., 2003). Discriminant validity is demonstrated if chi-square is significantly lower for the original CFA model, as this suggests that the better model was the one in which the two constructs were viewed as distinct (but correlated) factors (Anderson & Gerbing, 1988; R Bagozzi & Phillips, 1982). In this case, since combining two constructs adds six degree of freedom to the new model, the chi-square differences between the original CFA and any alternative model should be at least 22.46 at p-value smaller than 0.001. Table 11 shows that the minimum chi-square difference was 39.5. Therefore, the test of this discriminant validity was met.
38
Table 11 Pairwise discriminant analysis of constructs
Model X2df
X2 difference from original
Original CFA Model X2df = 214.2
Combining intention with perceived usefulness X2df = 673.8 459.6 Combining intention with perceived-ease-of-use X2df = 538.9 324.7 Combining intention with perceived network
externalities
X2df = 389.1 174.9
Combining intention with interpersonal norm X2df = 518.0 303.8
Combining intention with social norm X2df = 441.4 227.2
Combining intention with attitude X2df = 349.2 135
Combining attitude with perceived usefulness X2df = 514.7 300.5 Combining attitude with perceived-ease-of-use X2df = 404.3 190.1 Combining attitude with perceived network
externalities
X2df = 253.7 39.5
Combining attitude with interpersonal norm X2df = 526.5 312.3
Combining attitude with social norm X2df = 364.1 149.9
Combining perceived usefulness with perceived-ease-of-use
X2df = 706.8 492.6
Combining perceived usefulness with perceived network externalities
X2df = 535.1 320.9
Combining perceived usefulness with interpersonal norm
X2df = 587.7 373.5
Combining perceived usefulness with social norm
X2df = 640.6 426.4
Combining perceived ease-of-use with perceived network externalities
X2df = 415.4 201.2
Combining perceived ease-of-use with interpersonal norm
X2df = 576.9 362.7
Combining perceived ease-of-use with social norm
39
Table 11 Pairwise discriminant analysis of constructs (con’t)
Model X2df
X2 difference from original Combining perceived network externalities with
interpersonal norm
X2df = 573.4 359.2
Combining perceived network externalities with social norm
X2df = 408.0 193.8
Combining interpersonal norm with social norm X2df = 456.8 242.6 Difference of X2 at df = 6 and P-value < 0.001 is at least 22.46.
40
4.3.3 Model fit analysis
The measure used to assess the model fit includes the X2/d.f. ratio, Root Mean Square Residual (RMR), Root Mean Square Error of Approximation (RMSEA), Goodness of Fit Index (GFI), Adjusted Goodness of Fit Index (AGFI), Normed Fit Index (NFI), Tucker-Lewis Index (TLI), Comparative Fit Index (CFI). We did not use chi-square and degree of freedom because the sample size in this study is commonly considered big (>300), the chi-square value (X2=214.2) and related p-value (p<0.001) are neglected for their over sensitivity to the sample size (Joreskog & Sorbom, 1993).
Table 12 provides the summary of overall fits of model. All the criteria met the recommended level; consequently, the proposed model provided a suitable fit.GFI was 0.936, above the cut-off value of 0.8 (Seyal, Rahman, & Rahim, 2002) and AGFI was 0.904, above the cut-off value of 0.8 (D Gefen, Straub, & Boudreau, 2000).
Table 12 Overall fits of model Fit
Index
Recommended
Criteria Results Suggested by authors
X2
/d.f. <3 1.879 (Bentler & Bonett, 1980)
GFI >0.8 0.936 (Seyal, et al., 2002)
AGFI >0.8 0.904 (D Gefen, et al., 2000)
NFI >0.9 0.938 (Bentler & Bonett, 1980)
TLI >0.9 0.960 (Bentler & Bonett, 1980)
CFI >0.9 0.970 (Bentler & Bonett, 1980; Bhattacherjee,
2002; L. Hu & Bentler, 1999)
RMSEA <0.08 0.051 (Hair, et al., 1992)
RMR <0.05 0.027 (L. Hu & Bentler, 1995)
41
values of 0.9 (Bentler & Bonett, 1980). CFI was 0.970, also above the cut-off value of 0.9 (Bentler & Bonett, 1980; Bhattacherjee, 2002; L. Hu & Bentler, 1999). RMSEA was 0.051, below the 0.08 cut-off, indicating a satisfactory model fit (L. Hu & Bentler, 1999). In addition, we investigated the RMR index, which represent the badness of index, based on the fitted residual (B. Byrne, 1998). In this study, the RMR was 0.027, below the 0.05 cut-off (L. Hu & Bentler, 1995).
4.4. Tests of the Structural Model
Table 13 and Figure 5 give the result of structural equation modeling analysis. We tested the hypothesized positive relationship among the research variables. According to Alwin & Hauser (1975), the path coefficient of an exogenous variable is the direct effect of that variable on the endogenous variable. In addition, an indirect effect represents those effects mediated by the intervening variables between the cause and effect of interest in a model (Alwin & Hauser, 1975).
Table 13 Result of structural modeling analysis
Path Path coefficient Standard error P-value
PEOU Æ AT 0.608 0.063 0.000 *** PEOU Æ PU 0.300 0.058 0.000 *** PU Æ AT 0.166 0.06 0.008 ** PU Æ BI 0.070 0.045 0.175 AT Æ BI 0.427 0.064 0.000 *** PNE Æ BI 0.178 0.057 0.004 ** IN Æ BI 0.183 0.043 0.002 ** SN Æ BI 0.183 0.059 0.007 ** ** P-value <0.01 *** P-value <0.001
42
Table 14 provides the result of direct and indirect effects of this study. Total effect is the sum of direct and indirect effect of a variable on another variable. For example in this case, perceived usefulness has direct effect on intention to use of 0.07 and indirect effect of 0.071, resulting total effect of perceived usefulness on intention to use of 0.141.
Significant path Non-significant path
** P-value <0.01, *** P-value <0.001
Figure 5 Result of structural modeling analysis
In TAM model, the results showed that perceived ease-of-use had significant effect on attitude. Its direct effect was 0.608 and indirect effect through the intervening variable of perceived usefulness was 0.0498. Thus, the total effect of perceived ease-of-use on attitude was 0.6578. Effect from perceived ease-of-use to
Perceived Usefulness R2 = .090 Perceived Ease of Use Attitude toward using YouTube to share videos R2 = .458 Intention to use YouTube to share videos R2 = .540 Perceived Network Externality Social Influences TAM Social Norm Interpersonal norm .427 *** .608 *** .166 ** .178 ** .183 ** .183 ** .3 *** .07
43
perceived usefulness was β=0.3 with p<0.001. The significant factors to attitude are not only perceived ease-of-use, but also perceived usefulness. We can see from the result that perceived usefulness has significant effect on attitude (β=0.166, p<0.001). These results supported our hypothesis 1, 2 and 3. Both paths from perceived-ease-of-use and perceived usefulness to attitude accounted for 45.8 % of the variance in attitude.
As we can see from the result, hypothesis 4 was not supported; the path from perceived usefulness to intention to use was not significant (β=0.07, ns). Meanwhile, as hypothesized, Attitude was positively related to intention to use (β=0.427, p<0.001). Therefore, hypothesis 5 was supported.
Table 14 Effects on intention to use YouTube to share videos
Construct Direct effects Indirect effects Total effects
Perceived Ease of Use 0.260
0.021 0.021 0.302 Perceived Usefulness 0.070 0.071 0.141 Attitude 0.427 *** 0.427 Perceived Network Externalities 0.178 ** 0.178 Interpersonal Norm 0.183 ** 0.183 Social Norm 0.183 ** 0.183 ** P-value <0.01 *** P-value <0.001
We need to give note here that even we did not set perceived ease-of-use to directly relate to intention, but we can see from Table 14 that Perceived ease-of-use has indirect effects on intention to use with total effect of 0.302. Mean while, perceived usefulness, with the direct and indirect effects, only had total effects of 0.141 on intention to use YouTube to share videos.
44
Table 15 Result of hypotheses test Research
Hypotheses Statement of Research Hypotheses Results
H1 Perceived ease of use is positively related to
attitude toward using YouTube to share videos.
Supported
H2 Perceived ease of use is positively related to
perceived usefulness.
Supported
H3 Perceived usefulness is positively related to attitude toward using YouTube to share videos.
Supported
H4 Perceived usefulness is positively related to
Intention to use YouTube to share videos.
Not supported
H5 Attitude toward using YouTube to share videos is
positively related to Intention to use YouTube to share videos.
Supported
H6 Perceived network externality is positively related to Intention to use YouTube to share videos.
Supported
H7 Interpersonal norm is positively related to Intention to use YouTube to share videos.
Supported
H8 Social norm is positively related to Intention to use YouTube to share videos.
Supported
All factors from social influence, including perceived network externalities, interpersonal norm and social norm, have significant effects on intention to use (β=0.178, p<0.01, β=0.183, p<0.01, β=0.183, p<0.001, respectively). Therefore, hypotheses 6, 7 and 8 were also supported. The model accounted for 54% of variance in intention to use. We provided the summary of hypotheses test’s result in Table 15.
4.5. Result of Group Analysis: Gender Comparison
After analyzing the data wholly, we analyzed by gender differences. The result of gender comparison fits of model was provided in Table 16. All the fit index of male
45
group is in the acceptable area. The X2/d.f. ratio was 1.628. GFI and AGFI were 0.911 and 0.867, respectively, above the cut-off value of 0.8. NFI, TLI and CFI were 0.914, 0.952 and 0.964, respectively, all above the cut-off value of 0.9. RMSEA was 0.055, below the recommended cut-off value of 0.08. RMR was 0.031, below the cut-off value of 0.05
Table 16 Gender comparison fits of model Gender
Fit Index Recommended
Criteria Overall Results Male (N=206) Female (N=135) X2 /d.f. <3 1.879 1.628 1.375 GFI >0.8 0.936 0.911 0.891 AGFI >0.8 0.904 0.867 0.836 NFI >0.9 0.938 0.914 0.899 TLI >0.9 0.960 0.952 0.959 CFI >0.9 0.970 0.964 0.969 RMSEA <0.08 0.051 0.055 0.053 RMR <0.05 0.027 0.031 0.035
In female group, we found aside from NFI that is slightly under the recommended cut-off value, all the value was still in the acceptable area. The X2/d.f. ratio was 1.375. GFI and AGFI were 0.891 and 0.836, respectively, above the cut-off value of 0.8. NFI was 0.899, slightly below the recommended cut-off value of 0.9. TLI and CFI were 0.959 and 0.969, respectively, all above the cut-off value of 0.9. RMSEA was 0.053, below the recommended cut-off value of 0.08. RMR was 0.035, below the cut-off value of 0.05
Table 17 shows the result of path coefficient comparison by gender. The direct path coefficient from perceived ease-of-use to attitude for males was significantly larger than females (β=0.646, p<0.001, β=0.556, p<0.001). With perceived usefulness