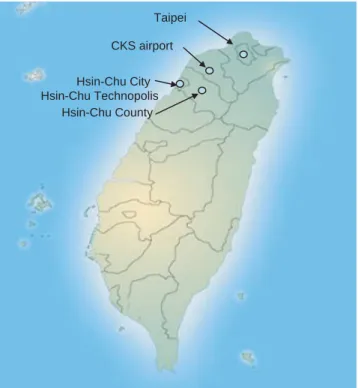
the Hsin-Chu technopolis, in the northwestern part of Taiwan (see Figure 1).
With increasing awareness that global warming and related cli-mate change are factors affecting life and health, the Hsin-Chu tech-nopolis urgently needs to review its systems of transportation and patterns of behavior of its citizens to provide a more habitable and sustainable environment. Research has revealed that students in the Hsin-Chu area depend heavily on their parents to get to school using both motorcycles and cars. Specific data are as follows:
• Forty-seven percent of junior high school students (ages 13 to 15) in the city and 53% in the county get to school by car or motorcycle and
• Ninety-four percent of students in the city and county can cycle, and most of them own bicycles (79%); however, only 15% of them ride their bikes to school.
Thirty years ago, most Taiwanese students walked or cycled to school but with the current and increasingly heavy road traffic, many parents are justifiably concerned about their children’s safety when using either of these two relatively insecure modes of transportation. As a result, the number of students who walk or cycle to school has dropped from 28% to 15% (1).
Walking and cycling to school can provide important opportuni-ties for students to explore their neighborhoods, develop social skills, and experience a sense of responsibility and independence as well as exercise their bodies (2). The Ministry of Education in Taiwan is drawing up a plan to encourage students to walk or cycle to school.
Denmark was the first European country committed to promoting a Safe Routes to School Program for children riding their bikes or walking. That program has spread throughout Europe, Canada, and, most recently, the United States (2).
In the United Kingdom, there has been a 50% decline in cycling and more than 90% of students have never cycled to school. To deal with this situation, the British government began a 21st century cycling proficiency program (the Bikeability Award Scheme), which started in April 2007 (3).
Initially, £10 million (£1 = $1.97 in 2007 U.S. dollars) was bud-geted to fund the project with a view to provide students with a real-istic experience about cycling practice on the road. The program will include cycling proficiency courses for 100,000 students as well as the development of more cycling lanes linked to schools. Local governments are also responsible for providing training pro-grams through road safety bureaus and volunteers. The curriculum includes, among other things, cycling skills, emergency braking procedures, and considerations when crossing roads. The program
Students’ Perceptions of Difficulties
in Cycling to School in Urban and
Suburban Taiwan
Hsin-Wen Chang and Hsin-Li Chang
123 Previous research has identified the importance of cycling training programs and examined the relationship between cycling attitudes and the behavior of cyclists; another important factor that needs further research is obstacles to cycling in cities. This study investigates cycling difficulties confronted by Taiwanese students in the Hsin-Chu technop-olis while riding their bikes to and from school. For an empirical perspective, a questionnaire was designed to collect data related to perceptions of cycling difficulties and to provide a descriptive analysis of students and their parents. Data were collected from samples in urban and suburban environments. The Rasch model was applied to analyze the cycling abilities of the students as well as their perceptions of cycling difficulty. Findings indicate that boys have better cycling abilities than girls, urban students have better abilities than suburban students, ability parallels age (older students have better cycling ability), and parents’ attitudes toward cycling to school parallel their children’s abilities (parents of students with better cycling ability are less con-cerned). Various impediments to cycling are identified and, based on students’ perceptions, levels of difficulty are assigned. Implications of the results are discussed, and recommendations are offered, so as to facilitate matching bicycle use with Taiwan’s status as a worldwide leader in bicycle manufacturing.
Hsin-Chu Science Industrial Park is world famous for being the so-called, “Asia’s Silicon Valley.” The park is located in the Taiwanese county of Hsin-Chu and, together with the city of Hsin-Chu, makes up a flourishing industrial technopolis that, in the last 25 years of rapid high-tech development, has seen its production value soar to U.S. $36 billion annually.
The population has also grown to 920,000 citizens, who have the highest average household income in Taiwan. More than 1/10th of the region’s population also works in the science park. Because of this rapid economic growth, car ownership in the region has become the highest among Taiwan’s counties (342 cars per 1,000 people in Hsin-Chu County) and cities (322 cars per 1,000 people in the city of Hsin-Chu). The specific empirical example concerned
H.-W. Chang, Department of Leisure and Recreation Planning and Management, Chung Hua University, and Department of Transportation Technology and Manage-ment, National Chiao Tung University, Hsinchu, Taiwan. H.-L. Chang, Department of Transportation Technology and Management, National Chiao Tung University, 1001, Ta-Hsueh Road, Hsinchu, 300, Taiwan. Corresponding author: H.-W. Chang, [email protected].
Transportation Research Record: Journal of the Transportation Research Board, No. 2060, Transportation Research Board of the National Academies, Washington, D.C., 2008, pp. 123–130.
includes a written test on traffic laws and a practical cycling exam at the end of the class (3).
The situation is remarkable as not only the government but society as a whole and nonprofit organizations are giving careful considera-tion to the importance of walking and cycling. For example, Sustrans (a sustainable transport charity in the United Kingdom) works on a practical program to encourage people to walk, cycle, and use more public transport systems in their daily lives to reduce automobile traf-fic and its adverse effects. The charity is also making an extra effort to promote the Safe Routes to School Program by establishing a package of practical educational measures to encourage children to walk or cycle to school (4, 5).
Gardner (6) showed that cycling is an integral part of childhood and many positive recollections are involved with it. It serves as a means for keeping the body healthy and is also a source of fun and enjoy-ment, an opportunity to socialize with peers, and a context for family outings. The research also revealed that adult respondents tend to link cycling with notions of escapism and freedom.
In the United States, the number of students walking or cycling to school has dropped drastically, from 66% to 13% (2). This radical change in habits has led to issues such as greater traffic congestion, increased chemical and acoustical air pollution in areas surrounding schools, and childhood obesity.
FHWA convened a steering group of bicycle safety experts and, in 1998, developed the first National Bicycle Safety Education Curricu-lum. This curriculum lists several bicycle safety educational topics and targets cyclists of different ages and abilities (7).
At the same time, the Pedestrian and Bicycle Information Cen-ter developed a program and checklist to rate a community’s level of “bikeability.” This checklist was divided into the following five score-grouping categories:
• 26–30 = a bicycle-friendly community, • 21–25 = a good community,
• 16–20 = conditions for riding are okay, • 11–15 = conditions are poor, and • 10 and below = the worst conditions.
This review identified the importance of cycling training and exam-ined the relationship between cycling attitudes and behavior as well as some of the things being done in various countries to change atti-tudes and patterns of bicycle use; however, it has not addressed obstacles to cycling. In Taiwan, there is a need for policies to provide systematic training on cycling safety but, unlike in other countries, the issue presents an additional consideration: Europe and the United States have focused on training and implementation (8–11), but in Taiwan students simply do not cycle to school. Therefore, this study attempts to investigate the current status of students’ perceived cycling difficulties, their ability levels, and impediments to riding their bikes to their school.
RESEARCH DESCRIPTION
In December 2006, as a first step in the study, the authors administered the Pedestrian and Bicycle Information Center checklist to students in 22 schools in the Hsin-Chu technopolis area. The average bikeability score was 14.64, which means conditions are poor. This result reflects a nonfriendly environment for students to ride their bikes to school.
To obtain objective data, a survey was conducted to collect student and parent information and a descriptive analysis was applied to examine their characteristics by using the Rasch model as a basis for analyzing the data. Random sampling led to the choice of two junior high schools; one located in the city of Hsin-Chu, which represents an urban location, and the other in Hsin-Chu County, which represents a suburban location. A total of 687 valid questionnaires were collected in the city school and 923 were collected in the county school.
The data were organized to represent three categories of variables to determine cycling difficulties and the abilities of students 13 to 15 years old:
• Student personal characteristics, which include gender and age (grade),
• Family characteristics and the parents’ thoughts and attitudes about letting their children ride bikes to school, and
• Location of schools (city or county).
Three hypotheses were proposed to explain the differences and relationships among these variables:
1. Male and female students have different cycling abilities. 2. Students with better cycling ability are in higher grades than students with less cycling ability.
3. Students with better cycling ability have greater parental support for cycling to school than students with less cycling ability.
4. Students with better cycling ability have more educated parents than students with less cycling ability.
5. Students’ cycling abilities differ according to whether they live in an urban or a suburban area.
6. Students’ perceptions of cycling to school are affected by traffic conditions, which include narrow shoulders, crossing intersections, left turns, uneven paving, shared roads, trucks, heavy traffic, and occupied shoulders.
7. Students’ perceptions of cycling to school are affected by physical conditions, which include darkness, rain, and wind. Taipei
CKS airport Hsin-Chu City Hsin-Chu County Hsin-Chu Technopolis
ITEM RESPONSE THEORY AND RESEARCH METHODOLOGY
An 11-item questionnaire was used to collect data based on students’ ratings of items using a five-point Likert-type scale (5 = strongly agree, 4 = agree, 3 = neutral, 2 = disagree, and 1 = strongly disagree). A Rasch model was applied to investigate the difficulties of students cycling to school. Following the methodology of Massof and Fletcher (12), the variables selected to represent these obstacles are latent and were inferred from the subjects’ answers and the observer’s judgments about the subjects’ behavior.
Item response theory (13, 14) was used to estimate the values of these latent variables based on an ordinal scale interval of scores col-lected in the questionnaires. Item scores are called “raw scores.” If the raw scores form a one-dimensional ordinal scale, then when the data are displayed with the items ordered according to item raw scores and with the subjects ordered according to individual raw scores, the data matrix will conform to a Guttman scale (12).
A Guttman scale reflects a situation in which item raw scores are monotonic with item difficulty, and test scores are monotonic with the subject’s ability (12). Item response theory begins with a defi-nition of the latent variable and measures θ, a variable that is an attribute of student n and has a unique value for each student θn. Each item i in the theory requires a threshold value of θ and has a difficulty of bi.
The probability (P) that student n will give a particular response to item i can be represented by the following function, as explained by Birnbaum (15):
where
c= lower performance, d= upper performance, and ai= discriminability of the item.
There are three types of item response theory: one-parameter logistic model, two-parameter logistic model, and three-parameter logistic model.
The simplified one-parameter item response model is identical to the probabilistic measurement model developed by the Danish mathematician George Rasch (12–15). His model is applied to this research.
RASCH MODEL
To simplify the Rasch model, dichotomous responses were consid-ered. The probability that student n will respond to item i with an “agree” answer (success) is represented by the following function:
The probability that student n will respond to item i with a “dis-agree” response (failure) is represented as follows:
P b P b e n i n i n bi 0 1 1 1 1 θ, θ, θ
(
)
= −(
)
= + − P b e e n i b b n i n i 1 1 θ, θθ(
)
= + − − P c d c e ni ai n bi θ θ(
)
= + − + − ( − ) 1The raw score percentage is then converted into an agree-to-disagree (success-to-failure) ratio, or odds ratio. The odds ratio reflects the likelihood that student n will agree with item i.
Then, the logarithm of odds ratio (logit) is as follows:
In 1978, Andrich (16) modified the Rasch model to make it applicable to polytomous rating scale data, which is also used in this study.
In Andrich’s modified Rasch model, each item i has its own thresh-old Fixfor each category x. Therefore, bix= bi+ Fix, and Equation 1 becomes Equation 2.
The partial credit model is derived as follows, where Pnixis the probability of student n choosing answer x in item i.
MODEL FIT AND RELIABILITY
The Rasch model provides a mathematical framework against which test developers can compare their data. This model is based on two hypotheses: one is unidimensionality, which means useful measure-ment involves the examination of only one student attribute at a time; the other is local independence.
Bond and Fox (17 ) argued that “student” and “item” performance deviations from the “fit” can be assessed and the item’s “difficulty” and “student ability” are estimated on a logit scale. There are two fit statistics in the Rasch model—infit and outfit:
• The infit statistic is a weighted standardized residual and • The outfit statistic is an average of the standardized residuals. Standardized fit statistics (Zstd) must be within the 95% confi-dence interval to be considered as having acceptable values between −2.0 and +2.0 standard deviations from the mean; however, Oreja-Rodriguez and Yanes-Estévez (18) suggested that a range between −3.0 and +3.0 is also acceptable.
P e e nix b b k m n ix f x n ix j k = − ( ) − = = =
∑
∑
∑
θ θ 0 0 0 ln P ( ) P b F nix ni x n i ix − ( ) ⎛ ⎝⎜ ⎞ ⎠⎟= − − 1 2 θ ln P ( ) P b nix ni x n ix − ( ) ⎛ ⎝⎜ ⎞ ⎠⎟= − 1 1 θ ln , , P b P b b n i n i n i 1 0 θ θ θ(
)
(
)
= − P b P b e n i n i b n i 1 0 θ θ θ , ,(
)
(
)
= −RESEARCH RESULTS
For this research, two junior high schools in the Hsin-Chu technop-olis area of Taiwan were chosen at random for administering the questionnaire.
Hsin-Chu County has a population of around 920,000, with 530,000 living outside the city and 390,000 within the city of Hsin-Chu. The population ratio is 1.35 to 1 and the sampling of students is almost the same as the population ratio: 923 from Hsin-Chu County and 687 from the city of Hsin-Hsin-Chu. The sample matches the distribution of the population and therefore can be considered representative.
Questionnaires were administered in spring 2007 and 1,610 valid responses were obtained. The research process was then divided into three tasks:
1. Descriptive analysis of students’ profiles, 2. Rasch analysis, and
3. Cycling difficulties and cycling abilities analysis.
Descriptive Analysis of Students’ Profiles
With regard to Hypothesis 1 (as represented in Figure 2), the vari-ables and data obtained are organized and represented in Table 1. The results are as follows:
• With regard to the gender variable, girls were slightly in the majority (53%) of the overall sample of students.
• In terms of grade and age, the 14-year-old grade group was the largest (35%), followed by 13-year-olds (33%) and 15-year-olds (32%).
• With regard to the parents’ education variable, 72.1% are at or above the college level, in both the city and the county. This is not an unexpected finding as the research area is a science-based technopolis, and the average education is higher than in other areas.
• With regard to the parents’ attitude toward children cycling to school, 27.4% of parents supported the idea, and 16.0% parents were opposed to it. The vast majority (56.6%) did not have an opinion.
Rasch Model Analysis
This research applied the Rasch model to analyze the cycling abili-ties of students from two schools in the technopolis.
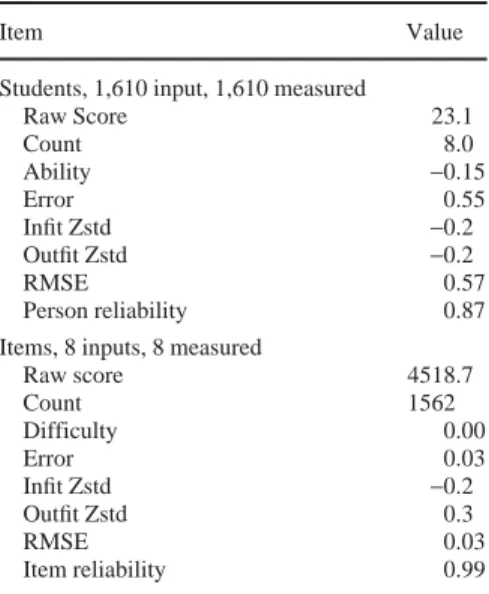
The mean item difficulty was set at 0, and the mean measure of student ability was set at −0.15 logit, which means the item content (i.e., the situation to which the item referred) was considered to be slightly more difficult for the students.
In the Rasch model, reliability is estimated for both students and items. A reliability index larger than 0.80 means that the scale (stu-dent or item) is reliable. Table 2 shows that stu(stu-dent reliability (0.87) is greater than 0.80, which falls within the reliable range. Item reli-ability (0.99) is far greater than 0.80, which means the results are very reliable. Thus, this questionnaire and the results obtained are useful in measuring the cycling difficulties of school students for the Hsin-Chu case.
Cycling Difficulties and Students’ Abilities
As derived from the WINSTEPS software output, eight of the 11 items have been ranked according to their level of difficulty (Bi) as shown
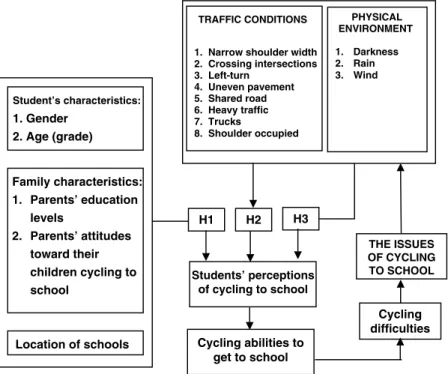
Cycling difficulties H1 THE ISSUES OF CYCLING TO SCHOOL Cycling abilities to get to school Student’s characteristics: 1. Gender 2. Age (grade) Family characteristics: 1. Parents’ education levels 2. Parents’ attitudes toward their children cycling to school Location of schools Students’ perceptions of cycling to school H2 H3 TRAFFIC CONDITIONS
1. Narrow shoulder width 2. Crossing intersections 3. Left-turn 4. Uneven pavement 5. Shared road 6. Heavy traffic 7. Trucks 8. Shoulder occupied PHYSICAL ENVIRONMENT 1. Darkness 2. Rain 3. Wind
FIGURE 2 Conceptual research framework: cycling difficulties and cycling abilities as factors influencing students’ cycling to school.
in Table 3. Three of the 11 items were dropped from the analysis because no significant between-group differences were found for those items.
Those eight items’ infit Zstds and outfit Zstds fall within ±2.00 standard deviations from the mean, which means those items are reliable. The higher the item’s difficulty measure, the more difficult that task was perceived to be by the students. The respective item difficulty ranges are +0.35 to −0.73 logit.
The results indicate the following:
• Students cycling to school perceive the most difficult condi-tions as being the presence of trucks, heavy traffic, and rainy and windy conditions.
• Darkness, cars occupying the shoulder, making left turns, and crossing intersections are considered low difficulty and easy to overcome.
TABLE 1 Personal and Family Characteristics of Respondents
Variable City Students County Students Total Gender Male 292 42.5% 465 50.4% 757 47.0% Female 395 57.5% 458 49.6% 853 53.0% Total 687 100.0% 923 100.0% 1,610 100.0% Age 13 years old 210 30.6% 323 35.0% 533 33.0% 14 years old 240 34.9% 320 34.6% 560 35.0% 15 years old 237 34.5% 280 30.4% 518 32.0% Total 687 100.0% 923 100.0% 1,610 100.0% Parents’ Education Primary 34 4.9% 40 4.3% 74 4.6% High school 145 21.1% 230 25.0% 375 23.5% College 386 56.2% 491 53.2% 877 54.5% University 105 15.3% 130 14.1% 235 14.6% Graduate school 17 2.5% 32 3.4% 49 3.0% Total 687 100.0% 923 100.0% 1,610 100.0%
Parents’ Attitudes Toward Cycling to School
Disagree 110 16.0% 148 16.0% 258 16.0%
No opinion 422 61.4% 489 53.0% 911 56.6%
Agree 155 22.6% 286 31.0% 441 27.4%
Total 687 100.0% 923 100.0% 1,610 100.0%
TABLE 2 Reliability of Rasch Model Applied in Hsin-Chu Case
Item Value
Students, 1,610 input, 1,610 measured
Raw Score 23.1 Count 8.0 Ability −0.15 Error 0.55 Infit Zstd −0.2 Outfit Zstd −0.2 RMSE 0.57 Person reliability 0.87 Items, 8 inputs, 8 measured
Raw score 4518.7 Count 1562 Difficulty 0.00 Error 0.03 Infit Zstd −0.2 Outfit Zstd 0.3 RMSE 0.03 Item reliability 0.99
NOTE: RMSE = root-mean-square error.
TABLE 3 Results of Item Ranking According to Raw Score and Difficulties
Raw Infit Outfit
Item Score Difficulty Zstd Zstd
Can you safely ride your bike 4,198 0.35 −2.0 −1.7 when there are trucks on the
road?
Can you safely ride your bike 4,225 0.34 −1.0 −0.2 when there is heavy traffic
on the road?
Can you safely ride your bike 4,454 0.08 −1.7 −1.9 when it is raining?
Can you safely ride your bike 4,473 0.08 −1.2 −1.0 when it is very windy?
Can you safely ride your bike 4,486 0.01 1.6 2.0 when crossing intersections
with fast-moving traffic?
Can you safely ride your bike 4,532 −0.05 1.5 2.0 when turning to the left?
Can you safely ride your bike 4,593 −0.08 0.8 1.3 when cars occupy the
shoulder?
Can you safely ride your bike 5,189 −0.73 0.7 1.5 when it is dark?
• Narrow shoulder width, uneven pavement, and cycling on shared roads are not rated as being of significant difficulty. Therefore, these items were dropped.
Students’ cycling ability is also examined in the Rasch model. This model transfers the raw score into a logit score through an odds ratio. The students’ abilities by logit scores are between −4.38 and +4.12, which means that most students have very low cycling abilities.
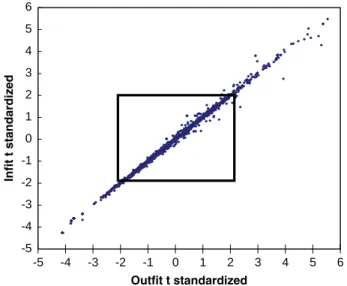
Figure 3 presents a scatterplot of the weighted (infit) and outlier-sensitive (outfit) fit statistics for the estimates of item measures. The infit and outfit values are expressed as z scores for the normalized distribution of students (relative to the Rasch model expectations). The central rectangle shows the boundaries of the 95% confidence interval and each dot represents a student response. The x-axis reflects the outfit. Student responses in the upper right quadrant represent overdispersion and student responses in the lower left corner reflect underdispersion (i.e., outliers). Those student responses are dis-carded. It should be noted that 1,277 of the 1,610 Infit Zstd and out-fit Zstd scores (79.3%) fall within ±2.00 standard deviations from the mean, thus modeling the Guttman scale.
Further analyses examined students’ cycling abilities based on a variety of student and parent characteristics. The results of these analyses are shown in Table 4. “Mean ability” reflects the mean logit for the groups under examination.
Boys’ cycling abilities are significantly greater than the abilities of girls. Age also appears to have a role in cycling ability. The results indi-cate that 15-year-olds have significantly better cycling abilities than 14-year-olds who, in turn, are significantly better than 13-year-olds.
Parents who support the idea of their children cycling to school have children with significantly better cycling abilities than the chil-dren of parents who do not support the idea. Finally, students who live in the city have significantly better cycling abilities than students who live in the country.
SUMMARY
Even though Taiwan is a world leader in the manufacture of bicycles (19, 20), the numbers of students who cycle to school is low. According to the extant literature and the current study, most
students possess bicycles and only a small percentage (16.0%) of parents are opposed to the idea of their children cycling to school, so there must be other reasons for students not cycling to school. The current study examined a variety of potential obstacles to cycling and the extent to which students perceived them to present difficulties while riding.
The abilities of students to cycle are generally poor. However, it is logical to think that the old adage “practice makes perfect” might be applicable in this situation. It is reasonable to expect students who do not practice riding to have less ability than those who have more practice. It was also evident from the data that ability is related to age; specifically, as children age they become more proficient in riding. This is a normal developmental princi-ple; however, without opportunity to participate the skill will never be developed—in general, ability is concomitant with time spent on the task.
The data in this study indicate that boys have better cycling ability than girls; however, as noted in the previous paragraph, skill develop-ment parallels time practicing and there is no reason to believe that males have some type of innate superiority to females in the area of cycling ability. Further research would be needed for a definitive answer, but the literature on physical ability testing indicates that, although males have a slight advantage in upper body strength, no sig-nificant difference has been found for physical agility, which is more related to cycling ability.
The results of this study suggest that a larger issue appears to be at the root of the lack of student cycling; specifically, perceived obsta-cles within the environment in which they would be riding appear to be at the heart of students not riding bikes to school. Of 11 possible impediments to cycling (eight related to traffic conditions and three related to weather; see Figure 2), the three most often rated as being problematic were heavy traffic, trucks, and rain. Dealing with dark-ness, cars occupying the shoulder, and making left turns were rated as less difficult obstacles.
RECOMMENDATIONS
Not a lot can be done about weather conditions; however, address-ing the other issues that have emerged as impediments to cycladdress-ing is no different than what has been done, and is currently being done, in Europe and the United States (21, 22). It appears logical
-5 -4 -3 -2 -1 0 1 2 3 4 5 6 -5 -4 -3 -2 -1 0 1 2 3 4 5 6 Outfit t standardized Infit t standardized
FIGURE 3 Standardized residuals of difficulty scale items.
TABLE 4 Differences in Cycling Abilities Based on Student and Parent Characteristics
Variable Group Number Mean Ability p
Gender Boy 588 0.3078* <.001
Girl 689 −0.5993
Grade (age) Third (age 15) 401 −0.0519* <.001 Second (age 14) 451 −0.0559
First (age 13) 425 −0.4373
Parents’ Agree 229 0.4054* <.001
attitudes No opinion 707 −0.1396
Disagree 341 −0.6629
Location School in city 589 0.0437* <.001 School in county 688 −0.3745
that if most students currently use cars and motorcycles as the primary mode of transportation to school, and “heavy traffic” is one of the major impediments to cycling, there is an ipsative relationship between the two. Specifically, if more students rode their bicycles to school the volume of motor-driven traffic would decrease.
Ideally, the installation of cycling lanes would circumvent the vast majority of the issues that students perceived as leading to dif-ficulty in cycling to school. That may not be possible in all areas. In lieu of the “ideal,” the government could implement a “cycling awareness” campaign that would educate drivers about the pres-ence of cyclists on shared roads and provide guidelines for driving safely in their presence. Many cities in the United States have implemented a system of school safety zones (7 ). During the hours when students are traveling to and from school, flashing lights on the roadsides inform drivers that speed limits have been temporar-ily reduced—usually to 20 mph. Penalties for violating the speed limit are severe.
To deal with the issue of trucks, it might be possible to restrict their times on city streets to allow students to cycle to and from school when trucks are banned. Some new logistics would be required on the part of the trucking companies, but it would not be impossible and all parties would soon adjust.
This study examined a relatively small, though important, number of impediments to cycling, but various other potential obstacles should be examined: for example, citizens’ perceptions of sharing roads with increasing numbers of bicyclists, police willingness to enforce more stringent traffic laws, and the impact of decreasing traf-fic flows at peak cycling hours. More unusual, though nonetheless real, issues of providing cycling classes, mandating practical cycling tests, and the use of safety equipment (e.g., helmets) also need to be examined.
The authors discussed the case of the United States, where the number of students walking or cycling to school has dropped con-siderably from 66% to 13% compared with Taiwan’s situation. Again, in Taiwan, there is a need for policies to provide systematic training on cycling safety but, unlike in other countries, the issue presents an additional consideration. Europe and the United States have focused on training and implementation.
All the issues raised by this study that are obstacles to cycling and that prevent students from riding their bicycles to their schools should become priority targets for the Taiwanese government to encourage and expand cycling opportunities.
CONCLUSIONS
In the early 18th century, bicycles were fashionable toys for Euro-pean nobility and became a worldwide craze by the end of the 19th century. Entering the 20th century, people in the world faced a trans-portation revolution as the new technology brought faster and more comfortable modes of transportation that changed the way people traveled, took their leisure, and worked the land. The new technol-ogy changed human behavior in general; however, bicycles were still deeply rooted in the cultural zeitgeist. By the 1930s, the British believed bicycles gave their country a new kind of outdoor culture; in the Netherlands, bikes were seen as an indispensable and beloved part of society.
Taiwan has 23 million residents and one of the highest popula-tion densities on earth, with a growing dependence on motor-driven
transportation, as evidenced by the presence of 5.7 million cars and 11.7 million motorcycles. Vehicles with internal combustion engines have, therefore, become an inseparable way of life in Taiwan and a staple of its economy (23), despite the fact it is also the third largest multinational maker of bicycles in the world (they are mainly made for export purposes).
Motorcycles are the most common feature of Taiwanese city traffic because of their mobility, convenience, and easy parking, but they are also a huge problem as cities’ infrastructures are far from adequate to cope with such a large number of them. Roads are also jammed with cars and trucks, and peak hours have become an unbearable daily experience for drivers and a very risky situa-tion for those who want to ride a bike. In addisitua-tion, environmental problems derived from the chemical emissions produced by those vehicles are causing severe health issues (throat, lung, and skin problems, as well as cancer) and are a burden for the Taiwanese health care system.
The government of Taiwan has taken notice of this situation and, after neglecting walking, cycling, and public transportation systems for a long time, has started promoting them and encouraging citizens to use them.
Cycling to school provides students with opportunities to have meaningful social interactions and provides physical benefits while protecting the environment. It is, therefore, socially correct for the gov-ernment of Taiwan to promote this alternative mode of transportation as a relevant part of life and lifestyle today.
The results of this study suggest that, with a large population and numerous automobiles, the government of Taiwan needs to consider in the short run how to encourage increasing use of bicycles to ensure that children can safely cycle to school. Therefore, the government must decide how best to use the land to improve the state of the roads and street networks (based on pedestrians’ and cyclists’ needs) and produce a package of regulations (as discussed earlier) to pro-vide a smooth and safe cycling experience and a healthy high-quality standard of life for all Taiwanese citizens.
REFERENCES
1. Chang, H. L. A Survey Report of Students Commuting to School—
Hsin-Chu Case (in Chinese). Hsin-Chu City Government, Taiwan, 1997.
2. Safe Routes to School. Research Sheet. Georgia Department of Trans-portation, Atlanta, 2006.
3. Cycling England Homepage. Bikeability Update. www.cyclingengland. co.uk. Accessed March 29, 2007.
4. Bicycle Association. Cycle-Friendly Infrastructure. Guidelines for
Plan-ning and Design. Cyclists’ Touring Club, Godalming, Surrey, United
Kingdom, 1996.
5. Bicycle Association. Making Ways for the Bicycle. Sustrans, London, 1994.
6. Gardner, G. Transport Implications of Leisure Cycling. TRL Report 347. Transport Research Laboratory, Wokingham, Berkshire, United Kingdom, 1998.
7. Good Practices Guide for Bicycle Safety Education. Publication FHWA-SA-02-001. FHWA, U.S. Department of Transportation, Wash-ington, D.C., 2002.
8. Colwell, J., and A. Culverwell. An Examination of the Relationship Between Cycle Training, Cycle Accidents, Attitudes, and Cycling Behav-iour Among Children. Ergonomics, Vol. 45, no. 9, 2002, pp. 640–648. 9. Guidelines for Cycle Audit and Cycle Review. Institution of Highways
and Transportation, Department of Environment, Transport, and Regions, London, 1998.
10. Hansen, K. S., G. E. Eide, E. Omenaas, L. B. Engesater, and A. Viste. Bicycle-Related Injuries Among Young Children Related to Age at
Debut of Cycling. Accident Analysis and Prevention, Vol. 37, 2005, pp. 71–75.
11. Pucher, J., and L. Dijkstra. Promoting Safe Walking and Cycling to Improve Public Health: Lessons from the Netherlands and Germany.
American Journal of Public Health, Vol. 93, No. 9, 2003, pp. 1508–1517.
12. Massof, R. W., and D. C. Fletcher. Evaluation of the NEI Visual Func-tioning Questionnaire as an Interval Measure of Visual Ability in Low Vision. Vision Research, Vol. 41, 2001, pp. 397–413.
13. Johnson, C., and S. W. Raudenbush. A Repeated Measures Multilevel
Rasch Model with Application to Self-Reported Criminal Behavior.
Research Report. University of Michigan, Ann Arbor, 2002. 14. Smith, E. V., Jr., and R. M. Smith. Introduction to Rasch Measurement:
Theory, Models and Applications. JAM Press, Maple Grove, Minn.,
2004.
15. Birnbaum, A. Some Latent Trait Models and Their Use in Inferring an
Examinee’s Abilities. Addison-Wesley, Boston, Mass., 1968.
16. Andrich, D. A Rating Formulation for Ordered Response Categories.
Psychometrika, Vol. 43, 1978, pp. 561–573.
17. Bond, T. G., and C. M. Fox. Applying the Rasch Model: Fundamental
Measurement in the Human Sciences. Lawrence Erlbaum Associates,
London, 2001.
18. Oreja-Rodriguez, J. R., and V. Yanes-Estévez. Perceived Environmen-tal Uncertainty in Tourism: A New Approach Using the Rasch Model.
Tourism Management, Vol. 28, No. 6, 2007, pp. 1450–1463.
19. Chang, H.-W., and H.-L. Chang. A Strategic Study of Bicycle Tourism in Taiwan. Journal of the Eastern Asia Society for Transportation Studies, Vol. 5, 2003, pp. 1675–1685.
20. Chang, H.-W. Let’s Get the Nation Riding Bicycles. Taipei Times, Sept. 10, 2006, p. 8.
21. Aultman-Hall, L., and F. L. Hall. Research Design Insights from a Survey of Urban Bicycle Commuters. In Transportation Research
Record 1636, TRB, National Research Council, Washington, D.C.,
1998, pp. 21–28.
22. Moritz, W. E. Adult Bicyclists in the United States—Characteristics and Riding Experience in 1996. In Transportation Research Record 1636, TRB, National Research Council, Washington, D.C., 1998, pp. 1–7. 23. Chang, H.-L., and H.-W. Chang. Environmental Preference and
Satisfac-tion of RecreaSatisfac-tional Cyclists in a Technopolis. Presented at 85th Annual Meeting of the Transportation Research Board, Washington, D.C., 2006.
The Context-Sensitive Design–Solutions Task Force sponsored publication of this paper.