國立交通大學
管理學院(工業工程與管理學程)碩士班
碩士論文
應
應
用
用
資
資
料
料
包
包
絡
絡
法
法
於半導體構裝外包廠之績效評比
於
Apply Data Envelopment Analysis to Performance Ranking
for Semiconductor Packaging Subcontractors
研 究 生 : 李昆峰
指導教授 : 劉復華 博士
應
應
用
用
資
資
料
料
包
包
絡
絡
法
法
於半導體構裝外包廠之績效評比
於
Apply Data Envelopment Analysis to Performance Ranking
for Semiconductor Packaging Subcontractors
研 究 生:李昆峰
Student:Kun-Feng Lee
指導教授:劉復華 博士
Advisor : Fuh-Hwa F. Liu, Ph.D.
國 立 交 通 大 學
管理學院(工業工程與管理學程)碩士班
碩 士 論 文
A Thesis
Submitted to Department of Industrial Engineering and Management College of Management
National Chiao Tung University in Partial Fulfillment of the Requirements
for the Degree of Master of Science in
Industrial Engineering and Management
July 2004
HsinChu, Taiwan, Republic of China
應
應
用
用
資
資
料
料
包
包
絡
絡
法
法
於半導體構裝外包廠之績效評比
於
學生:李昆峰
授課教授 : 劉復華 博士
國 立 交 通 大 學
管理學院(工業工程與管理學程)碩士班
摘 要
本研究為對於台灣一家半導體公司,以異常發生率、交期達成率、品質稽核表現三 項指標來評比其構裝外包廠。應用資料包絡分析法(Data Envelopment Analysis,簡稱 DEA) 的方法來評量外包廠的相對績效,藉由分析的結果作為外包產能分配的依據並指引各外 包廠績效改善的方向,此績效評比的結果對於外包管理系統上助益甚大。本文介紹半導 體製造流程、該公司的外包業務的管理流程、並簡要介紹 DEA 方法,以逐步暫移除一 個高效率的外包廠的方法來間接評比多個高效率外包廠的排名。Apply Data Envelopment Analysis to Performance Ranking
for Semiconductor Packaging Subcontractors
Student: Kun-Feng Lee
Advisor : Fuh-Hwa F. Liu, Ph. D.
Department of Industrial Engineering and Management
National Chiao Tung University
Abstract
Based on the data from a semiconductor company in Taiwan, this research evaluates the subcontractors’ performance ranking via abnormality occurrence rate, delivery commit rate and quality audit performance. The DEA method is adopted to access the subcontractors’ related performance, in which the result could be used as the reference for subcontracting capacity allocation, can steer each subcontractor’s performance in correct direction for improvement, and can enhance the subcontracting management system. This content introduces semiconductor manufacturing flow, the subcontracting management flow of that company, also introduces the DEA method, using the way of step by step to remove one high efficiency firm then evaluate indirectly the final ranking for many high efficiency subcontractors.
Keywords: Performance Ranking, DEA (Data Envelopment Analysis), Semiconductor Packaging, Subcontracting Management System
Acknowledge
誌 謝
基於對人生旅途中的一個夢想,碩士的學業是我在大學時的一個努力
目標,直到十五年後的今日終於完成本論文,也達到了這個長遠的夢想。
很幸運地考取工管所在職專班,但在工作期間來求學的確是蠻辛苦
的,常常寫作業至半夜或假日無休下完成功課,在這幾年的求學時間,還
好都能得到家人的體諒與支持,同仁們的協助與支援,再加上同學間的互
相討論、合作之下,使得以兼顧學業與工作。
要感謝地人很多,在此,首先真誠地感謝指導教授劉復華博士的細心
教導與指正,使得本論文可以順利的完成。也謝謝公司的同仁們不斷的協
助,幫忙處理許多事宜使我放心地在校上課,更感謝長官們的包容,讓我
得以兼顧學校課業。
最重要的是我的家人,這段期間感謝你們的體諒與鼓勵,使我可以走
過這段不好走的歲月,謹以本論文獻給我最親愛的老婆慧娟、可愛的佳芸
和旻叡。接下來又是人生的另一個階段的挑戰了,最後真心地祝福大家有
個幸福的未來。
昆峰 於風城
Contents
Abstract (Chinese) ……….…….………....i
Abstract (English) ……….……..………….….. ii
Acknowledgements……….……iii
Contents……….… iv
1. Introduction ………..……….…. 1
2. Literature Review ………...……3
2.1 Semiconductor Industry Development ………..3
2.2 IC Assembly Introduction ………. 4
2.3 Subcontracting Management ……… 5
3. Research Method ………..…….10
3.1 Units for performance assessment ……….….….10
3.2 Performance Ranking Index Selection ………..…. 10
3.3 Efficiency Score ………..…13
3.4 DEA Model Selection ………...……13
4. Research Result and Analysis ………...……17
4.1 Measurement Analysis ……….…..….17
4.2 Performance Ranking Result ……….….18
4.3 Subcontracting Capacity Allocation ……….…….….19
5. Conclusion ………20
References ………..……...21
1. Introduction
For the consideration of economic production scale and professional technique, more and more semiconductor integrated device manufacturers (IDM) strategically tend to horizontal division of processes to other manufacturers to attain competition advantage. Most design firms which without fab subcontract the integrated circuit (IC) packaging manufacturing processes. From the fabrication of extended circumstances, we see that the packaging growth is increasing. In a world of capitalization and low-risk appraisal, companies should be able to continue to subcontracting.
For IDMs in Taiwan, more IC design companies are also employ subcontractors for finished wafer production and IC packaging, and testing. How to choose great and suitable subcontractors to fulfill excellent performance to meet customer’s demand is the concern of subcontract management for a lot of enterprises. Such as varied product quality, unstable shipment, poor quality system and unqualified customer audit performance drive subcontract management more subtle. We must take more factors into consideration simultaneously. Product category is so huge that they need many subcontracts. In the following, how to rank subcontractor performance to realize the whole performance and furthermore fine tune ideal quota to the subcontractors has became a crucial topic in subcontract management.
Customers today are becoming increasingly concerned with quality, and since subcontractors control the assembly process, this means a company must strive to find subcontractors capable to produce high quality goods. Due to delivery concerns, however, a company may sometimes be forced to rely on a subcontractor that is not qualified to meet a customer’s request. An important issue is how to allocate production capacities to the subcontractors. When viewing semiconductor industry as a whole, IC packaging technology is most important at the semiconductor back-end.
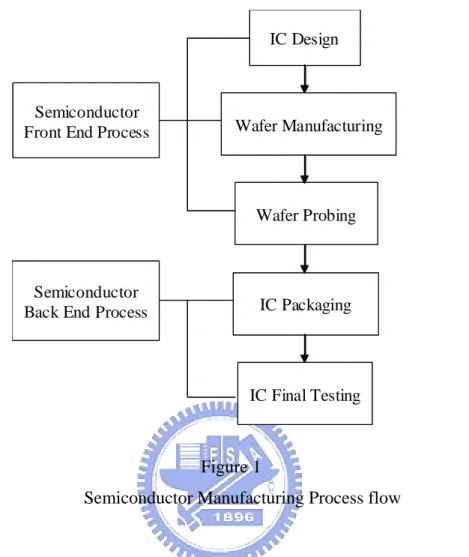
Figure 1 is a brief chart of semiconductor manufacturing process flow. IC Design Wafer Manufacturing Wafer Probing IC Packaging IC Final Testing Semiconductor
Front End Process
Semiconductor Back End Process
IC Design Wafer Manufacturing Wafer Probing IC Packaging IC Final Testing Semiconductor
Front End Process
Semiconductor Back End Process
Figure 1
Semiconductor Manufacturing Process flow
This research examines an IDM anonymous as M Company, where the IC packaging process is completed through subcontractors. Its capital is around 20 billion US dollars. Its yearly average revenue of M Company is approximately 7~9 billion US dollars, with the amount paid to assembly subcontractors totaling 0.7~0.9 billion US dollars per year, or 10% of the revenue. Considering this high subcontracting cost, the performance ranking is become more important. We utilize DEA (Thanassoulis, 2001) (Liu, 2003) to evaluate the subcontractors ranking as a reference for subcontracting management. Then, the equitable result is used to plan the capacity allocation, thereby helping steer subcontractor’s performance in the correct direction for improvement.
2. Literature Review
2.1 Semiconductor Industry Developing
Reviewing world semiconductor industries (Peng, 2003) in 2003 from the demand side shows the entire economic environment was returned. Most companies have increased the cost expense for information technology (IT) that will increase the growth of personal computer, electronic technology and the semiconductor industry, a clear sign of economic recovery. In 2001 and 2002, capital expenses were reduced to give all the IC fab more effective control. As a result of the market recovery in 2003, it has grown 16% in 2002, totaling approximately 1.64 billion US dollars.
To continue developing the semiconductor industry, IDM and design companies must understand professional technology to achieve competition advantage in the economic dimension. It is beneficial, then, to entrust production to subcontractors. The semiconductor industry leans towards the outsourcing, and currently people are more focused on R&D and thus elect to subcontract for production. The international IDM is now expanding; the IC packaging aspect is more positive; especially Taiwan’s IC packaging manufactures have already reached the top of the world and still have room to grow in the future.
2.2 IC Assembly Introductions
In IC assembly (Xie, 1996), plastic material (Epoxy molding compound) is put in a die to create an IC, where most dies are smaller than 1 cm as shown in Figure 2. Millions of electrical circuits need to build up in this tiny area, and all circuits and parts are approximately 0.15~0.4 micro meter. Today, we even have 90 nano meter technical wafer process, and thus the IC is extremely fragile, so that even a small particle can affect it. We can observe from this the importance of the IC assembly.
The IC assembly process has two stages, front-end and back-end. The front-end process includes wafer backside grinding, die sawing, die attachment and wire bonding, while the back-end process has molding, trimming, marking, forming, inspection and packing. During the IC assembly process, the assembly production yield is important to gain the more volume of IC and achieve the target of delivery commit volume for customers. The assembly process should be maintained stable to reduce the abnormality which may cause the defects and induce the potential customer’s complaint on application.
These years the IC packaging types are upgraded from conventional types DIP, SO, CC, QFP, and PGA to new ones as TSOP, BGA, CSP, and FC. Due to the packaging technology and equipments capacity improved, and to approach the high pin count, smaller package volume and electrical、thermal requirement, the capacity requirement of new packaging types will be growth very much. Below are the packaging type abbreviations.
DIP : Dual Inline Package SO : SOP ; Small Outline Package CC : PLCC; Plastic Leaded Chip Carrier QFP : Quad Flat Package
PGA : Pin Grid Array TSOP : Thin SOP BGA : Ball Grid Array CSP : Chip Scale Package FC : Flip Chip
Figure 2
Chip, IC (CSP type) vs. 1 Euro cent coin
Since the Cu process caused IC assembly needs to increase, many Taiwanese traders have started to develop the technical aspect. In fact, elevating IC packaging technology is what IDMs strive for as well. The new assembly demanding has grown, and predictions say assembly gravity of the IC cost will increase. In recent years, the growth of related IC products has been unparalleled throughout the world. One can see the potential of the IC packaging market growing in the semiconductor industry.
2.3 Subcontracting Management
A subcontractor uses spare parts and materials that it owns, and authorizes a company following up with the specification of drawing or layout for the related production. When a company goes in for a production move, its need for materials, processes, and equipment used to make magnetic heads are similar to those used in the semiconductor industry. Examples include very thin conductor and dielectric films and processes/equipment that rely on
plasma-based or ion-based systems. (Fu, 1992)
The traditional make-to-buy decision, which determines whether or not a subcontractor should supply a particular component, includes cost, schedule, technical need, resources, and risk as important objectives. (Minis, et al. 1999)
Following the technical improvements prevalent in the corporate strategy, subcontractors have become standard. For a company to complete production total by itself does not make sense economically, especially in work processing in a competitive, intense environment. Therefore, a subcontractor is the fastest and most cost effective method to complete production, especially in the IC assembly industry. (Huang, 2003)
Choosing a suitable subcontractor to support the back-end of IC assembly manufacturing is very important as well. The packaging subcontractor evaluation procedure in M Company is shown in Figure 3.
New Subcontractors
Application
Select the Proper Subcontractor
Quality System Verification
Product Try Run
Build up the Formal Subcontractor Contract PASS FAIL PASS FAIL Re-Apply Procedure Package Qualification New Subcontractors Application
Select the Proper Subcontractor
Quality System Verification
Product Try Run
Build up the Formal Subcontractor Contract PASS FAIL PASS FAIL Re-Apply Procedure Package Qualification Figure 3
IDMs need to consider IC packaging capacity and packaging technology in order to find a suitable subcontractor. To begin the process of choosing a subcontractor, one have to consider some factors, assembly cost for the IC packaging price, pay time, production capability, quality, etc. Then apply the procedure for that new subcontractor. After the application has been approved, one must also ensure the quality system will expect quality requests from both sides. The qualified system is followed ISO9000 international criteria; M Company will audit the quality system for that subcontractor, and define the pass criteria of this audit result. After completing the package qualification which followed the reliability test criteria, once it passes this qualification then that subcontractor could get the formal contract with M Company. We must also ensure that there is a high level of productivity quality and control, and make sure the qualification rate is high to pass.
In semiconductor manufacturing industry, IC process technology has been elevated and the assembly technology requirements have risen, so new products and demand for them come out often. If IC assembly manufacturing is deficient in professional technology or consideration for quality concern, delivery commit rate, and different kinds of risk, the IC industry needs to assume a suitable management method to meet the demand.
IC semiconductor industry implements supply chain management system. Subcontractors are a main point of consideration, and another main subject is production capacity allocation. The subcontracting management system of M Company is shown in Figure 4.
Raw Material Inventory Control Subcontractor Capacity Analysis Die Load Allocation Plan Check the Return Rate Tracking Production Quality Subcontractor Performance Ranking Quality Audit Annual Ranking Monthly Ranking Subcontractor Committee Monthly/Annual Ranking Quality System Department Packaging Engineering Department Production Control Department Production Control Department Production Control Department Raw Material Inventory Control Subcontractor Capacity Analysis Die Load Allocation Plan Die Load Allocation Plan Check the Return Rate Tracking Production Quality Subcontractor Performance Ranking Quality Audit Annual Ranking Monthly Ranking Subcontractor Committee Monthly/Annual Ranking Quality System Department Packaging Engineering Department Production Control Department Production Control Department Production Control Department Figure 4
Subcontracting Management System
On a subcontractor committee, the vice president is the director, while other members include the head of decision strategy, finance of purchases department, the head of the packaging engineering department, capacity control department, quality system department, etc. They decide the capacity allocation for all subcontractors in the meeting, and then provide a performance ranking record for subcontractor committee reference.
After capacity allocation every year, the capacity control department prepares for the product, and examines the monthly performance results. According to the capacity allocation, capacity control will deal with any sudden change orders, quality concerns, capacity problems and customer special requests to achieve the integration of subcontracting management.
Due to the performance ranking will impact the die load percentage for each subcontractor, it’s very important to have fair criteria for this ranking system. Current ranking methodology is used many indices which with more personal decision factors, these data are subjective and could not been evaluated the precise ranking. We want to have a more objective indices and a reliable methodology to conduct IC packaging subcontractors’ performance ranking, the DEA model could be provided a more objective method to analyze ranking data.
3. Research Method
3.1 Units for performance assessment
We employ DEA to assess the relative performance of all existing packaging subcontractor firms of M Company. The seven subcontractors’ anonyms are EKS, BKS, STC, MTA, JCM, GRK, and PTL.
3.2 Performance Ranking Index Selection
We considering the IC packaging related factors and subcontracting management related requirement, in the beginning there are possible eight indices for performance assessment as listed in Table 1. Four of them are not proper to use, two of four indices are combined to one. Adding the remaining two indices, finally, only three indices are used for performance assessment.
Table 1
Performance Ranking Index Analysis
Index Definition Selection
Packaging price The IC packaging cost for assembly of each packaging
type in subcontractors.
No
Production yield The percentage of successful IC packaging volume. No
Pay time Time to pay the IC packaging cost to subcontractors No
Product certification rate
The successful certified rate of new product in IC packaging, which failure result will affect the marketing time or mass production timelines.
No
Customer complaint quantity
IC packaging defect case of customer complaints after shipping out.
Yes
Production abnormality quantity
During IC packaging the process abnormalities happened times, usually this event cause IC waste or shipping delays and may impact the shipping requirement.
Yes
Delivery Commit rate
Volume completion refers to IC volume delivery
percentage while comparing returning volume with input volume in a designated time. Maximum rate is 100%.
Yes
Quality audit performance
Monthly or annual quality system audit performance, must maintain good condition. The higher the audit score, the better quality performance. The maximum score of this audit performance is 100 scores.
Yes
The reasons for not selecting the first four ranking indices: Packaging cost is depends on different IC packaging types which are hard to identify fair evaluation criteria for different subcontractors. The production yield is getting stable and better which without significant difference between different subcontractors. The pay time almost could be longer than 3 months so that it’s not important. Due to M Company occasionally asks for certifying new products, we do not keep the data about certification rate for subcontractors.
Through accessibility evaluation and analysis, we get four ranking indices. Considering the current seven subcontractors, we incorporate two indices “customer complaint quantity” and “production abnormality quantity” into one as “production abnormality quantity”. Besides “delivery commit rate” and “quality audit performance”, we have three ranking indices to evaluate subcontractors’ performance. Process abnormality quantity changes following input volume. If productivity and abnormality quantity are low, it cannot stand for its production quality and control capability. If productivity is high and abnormality quantity is low, it means production quality and control capability is stable. We modify this index as abnormality occurrence rate (The rate of abnormality per million ICs), which illustrates characteristics and capabilities of ample packaging. According to the three measurement indices, we collect the actual production data for further analysis. The data and their notations from each packaging subcontractor performance in 2003 are depicted in Table 2.
Table 2
DEA Analysis Working Table
Firms Abnormality occurrence rate Delivery commit rate % Quality audit performance j Name X1 Y1 Y2 1 EKS x11 0.59 y11 96.52 y21 80 2 STC x12 0.56 y12 99.30 y22 79 3 BKS x13 0.84 y13 97.30 y23 72 4 MTA x14 1.69 y14 92.50 y24 62 5 GRK x15 4.94 y15 93.80 y25 71 6 JCM x16 0.88 y16 86.80 y26 70 7 PTL x17 0.45 y17 83.70 y27 61
3.3 Efficiency Score
We use the following notations for the DEA models employed in this paper.
X1: Abnormality occurrence rate (case per million ICs)
Y1: Delivery commit rate (%)
Y2: Quality audit performance (score 100 extremely)
x1j: denotes the value of Firm-j on index X1
y1j: denotes the value of Firm-j on index Y1
y2j: denotes the value of Firm-j on index Y2
v1 : Weight of index X1
u1 : Weight of index Y1
u2 : Weight of index Y2
Larger values at Y1 and Y2 and smaller values on X1 indicate the superior
performance of a firm. Therefore, one may use the following equation to measure the efficiency of each firm, Firm-j. Smaller x1j would give larger Pj value while larger y1j or
y2j will lead to a larger Pj value.
1 j 1 2 j 2 1 j 1 j x v u y u y P × × + × = (1)
3.4 DEA Model Selection
Charnes, Cooper and Rhodes (1978) proposed a new DEA model, the CCR model, which expands on Farrell’s (1957) works to measure production efficiency under multiple inputs and outputs by the same scope. In this paper, we use the indices of quality, delivery, and abnormal rate to evaluate the subcontractors’ performance through ranking and
suggesting improvements. We use the input-oriented model, CCR-I, as the evaluation model,
to reduce the input index and increase the output index in order to meet the high efficiency.
The following model [CCR-I-FPk] is employed to measure the relative efficiency of Firm-k.
[CCR-I-FPk]
Objective function: maximize '
1 k 1 ' 2 k 2 ' 1 k 1 ' k x v u y u y P = + Subject to x v 1 u y u y P ' 1 j 1 ' 2 j 2 ' 1 j 1 ' j ≤ + = (j = 1,2,…..,7)
v
1',
u
1',
u
'2 ≥ε
>
0
ε is a Archimedean infinitesimally small number.
The objective is to have a maximum efficiency score for the object Firm-k while the
seven constraints limit the efficiency scores for each Firm-j is no more than one. [CCR-I-FPk]
model is a fractional programming model and is transformed into a linear programming model as below. The lower bound conditions for the decision variables u1, u2 and v1 would guarantee the proper transformation.
Max
T
u
y
u
y
P
' 2 k 2 ' 1 k 1 ' k+
=
Subject to x1kv'1 =T (j=1,2,…,7)0
v
x
u
y
u
y
' 1 j 1 ' 2 j 2 ' 1 j 1+
≤
0
ε
u
,
u
,
v
' 2 ' 1 ' 1 ≥>
Let T v v , T u u , T u u ' 1 1 ' 2 2 ' 1 1 = = =[CCR-I-LPk] Max Pk = y1ku1+y2ku2 Subject to x1kv1 =1 0 v x u y u y1j 1+ 2j 2 1j 1≤ (j=1,2,…,7) 0 ε u , u , v1 1 2 ≥ >
Transformed from primal model CCR-I, we get the dual model.
[CCR-I-DLPk] Min θk - ε(s1- + s1+ + s2+ ) Subject to θk x1k – x11 w1 –x12w2 – … –x17 w7 – s1- = 0 y11 w1 + y12w2+ …+ y17 w7 – s1+ = y1k y21 w1 + y22w2+ …+ y27 w7 – s2+ = y2k w1, w2, w3, w4, w5, w6, w7≧ 0 θk free in sign s1- , s1+, s2+≧ 0
The decision variables w1, w2, w3, w4, w5, w6, w7 are the weights assigned to the Firms, respectively, that are participating the relative performance measurement for the object Firm-k.
The solution of CCR-I-DLPk will have some differences due to the setting of ε, so we use the
two-phase solution to solve [CCR-I-DLPk].
Phase I - Obtaining the best θk* [DLPk-I] Min θk Subject to θk x1k –x11 w1 –x12 w2 – …– x17 w7 ≧ 0 y11 w1 + y12 w2+ …+ y17 w7 ≧ y1k y21 w1 + y22 w2+ …+ y27 w7 ≧ y2k w1, w2, w3, w4, w5, w6, w7 ≧ 0 θk free in sign
Phase II - Obtaining the optimum slacks of the indices s1-*, s1+*, s2+* [DLPk-II] Max s1- + s1+ + s2+ Subject to x11 w1 + x12 w2 – …+ x17 w7 + s1- = θk*x1k y11 w1 + y12 w2+ …+ y17 w7 - s1+ = y1k y21 w1 + y22 w2+ …+ y27 w7 - s2+ = y2k w1, w2, w3, w4, w5, w6, w7: 0 ≧ s1- ≧ 0, s1+ ≧ 0, s2+ ≧ 0
s1- :The excess of index X1 indication for Firm-k
s1+ :The shortfall of index Y1 output indication for Firm-k
s2+ :The shortfall of index Y2 output indication for Firm-k
Using Microsoft Office-Excel tool “Solver” (Cooper et al, 2002), one could solve the model [DLPk-I] and [DLPk-II] and get the optimal solution of θk*, s1-*, s1+*, s2+*. Simultaneously, the dual optimal solution of Pk*, v1*, u1*, u2* from FPk model are
obtained. Then the efficiency of Firm-k is:
v x u y u y P * * * 1 1k 2 2k 1 1k * k + = (2) where Pk* = θk*
If θk*=1, s1-* = s1+* = s2+*=0, then Firm-k is an efficient one.
If θk*=1, s1-* + s1+* + s2+*>0, then Firm-k is a weak efficient one with efficiency score equals one but still needs improvement on some indices.
4. Research Result and Analysis
4.1 Measurement Analysis
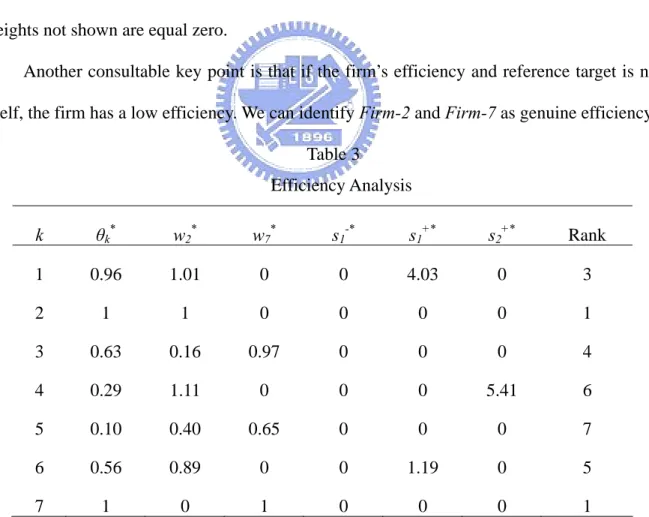
Table 3 summarizes the results of the performance measurement. θ2* and θ7* equal to 1 and s1-*, s1+*, s2+* are all equal to 0, so that Firm-2 and Firm-7 are efficient. θ3* and θ5* <1 with all s1-*, s1+*, s2+* equal to 0, Firm-3 and Firm-5 are pure inefficient firms.
In the CCR model, every inefficient firm has one efficient target for improvement direction. By examining Table 3, we find Firm-2 and Firm-7 are the reference ones for
Firm-3 with weighs 0.16 and 0.97, respectively. In other words, the reference target of Firm-3
is the linear combination of Firm-2 and Firm-7. There is only one reference efficient point
Firm-2 for Firm-1 and Firm-6, and the reference efficient point Firm-7 for Firm-4. The other
weights not shown are equal zero.
Another consultable key point is that if the firm’s efficiency and reference target is not itself, the firm has a low efficiency. We can identify Firm-2 and Firm-7 as genuine efficiency.
Table 3 Efficiency Analysis k θk* w2* w7* s1-* s1+* s2+* Rank 1 0.96 1.01 0 0 4.03 0 3 2 1 1 0 0 0 0 1 3 0.63 0.16 0.97 0 0 0 4 4 0.29 1.11 0 0 0 5.41 6 5 0.10 0.40 0.65 0 0 0 7 6 0.56 0.89 0 0 1.19 0 5 7 1 0 1 0 0 0 1
4.2 Performance Ranking Result
According to the above analysis, the most efficient firms are Firm-2 and Firm-7. To further understand the influence of these two firms, we use Jackknifing method (Ruggiero, 2002). Remove Firm-7 from the data set, six firms are compared each other, and perform the CCR-I analysis. Then, measure the relative efficiencies of the six firms with the absent of
Firm-2. The efficiencies are recorded in table 4. The last row is the sum of the six efficiencies,
3.62 and 3.59. It indicates of Firm-2 has stronger impact on the relative efficiency scores.
Table 4
Efficiency Subcontractors Influence Analysis
k Firm-k Firm-2 absented Firm-7 absented 1 EKS 1 0.96 2 STC - 1 3 BKS 0.63 0.65 4 MTA 0.29 0.31 5 GRK 0.11 0.11 6 JCM 0.59 0.56 7 PTL 1 - Sum 3.62 3.59
4.3 Subcontracting Capacity Allocation
Administration mechanisms on subcontracting capacity allocation are crucial to an IDM company who subcontracts the packaging process. We must take into account many factors, including throughput production, quality conditions on diverse process and product lines, shipment capability, special customer requirements, and so on (Zhou, 2003). These factors affect subcontractor throughput dispersion. The integral ranking on this research provides an excellent reference point. Although we cannot take every individual factor into consideration, we are at least aware of each subcontractor’s strengths and performance for the base of annual capacity allocation.
Based on the above performance ranking result and analysis, we can recommend larger capacity allocation (60~80%) for the top 3 ranked firms, Firm-2, Firm-7 and Firm-1, while
the 4th ranked Firm-3 and 5th ranked Firm-6, should receive the second largest capacity
allocation (10~30%). The last two subcontractors, Firm-4 and Firm-5, get the least capacity allocation since their whole performance is too far behind their competitors and therefore, improvement is required.
5. Conclusion
In today’s increasingly competitive semiconductor industry, a good performance is extremely important. When certain processes must be subcontracted for production, one must select quality subcontractors. Meanwhile, ranking activity is crucial because ranking results will decide the quantity and percentage we intend to die load, making a good ranking system imperative.
We usually discover that the conclusion differs following different directors on the ranking. DEA provides us with a more objective method to analyze rating data. DEA explores and analyzes using mathematical modes to provide an improvement reference target and direction in our practical operations to extract an optimum rating target. We can accomplish this optimum performance through these improvement indications. Yet this kind of analysis method only provides relative efficiency evaluation, not absolute efficiency assessment. Since the mode of evaluation is relative, correct data is the key to achieving high efficiency results. These data should also reflect fairness and objectivity.
This research successfully applied DEA to complete packaging subcontractor performance rankings for the IDM. We collected valuable data to judge subcontractor performance and help make proper subcontractor capacity allocation decisions. To an administrator, this is an excellent management indicator.
In the future, we can apply the subcontractor ranking system to conduct subcontractor rankings precisely and consistently. While in annual integral subcontractor capacity allocation, it can act as an annual ultimate rating. In monthly dynamic management, adjusting throughput or quality ratings are maneuverable. We can take into consideration proper performance indices such as a monthly rating using DEA methodology. These rating data are able to accurately capture sufficient information to construct a perfect performance ranking and throughput strategy arrangement. Also, it could be applied to new product performance rankings or staff performance, to set up a precise and solid ranking structure.
References
1. Charnes, A., Cooper, W.W., and Rhodes, E., “Measuring the efficiency of decision marking units”, European Journal of Operational Research, v2, n6, pp.429-444, 1978.
2. Cooper, W.W., Seiford, L.M., and Tone, K., DEA A Comprehensive Text with Models,
Applications, References and DEA-Solver Software, New York, Kluwer Academic Publishers, 2002.
3. Farrell, M.J., “The measurement of productive efficiency”, Journal of the Royal Statistical
Society, v120, pp.253-281, 1957.
4. Fu, H.-Y., Subcontractor Management Business, Taipei, Taiwan, Qian Cheng Business
Administration Company, 1992 (in Chinese).
5. Golany, B., and Roll, Y., “An Application Procedure for DEA”, OMEGA, v17, n3, pp.237-250, 1989.
6. Huang, S., “The Design of Dynamic Management Moel for Semiconductor Assembly
Subcontracting”, Department of Industrial Engineering & Management, National Chiao Tung University, Hsin Chu, Taiwan, Master’s thesis, 2003 (in Chinese).
7. Liu, F.-H., “Course’s Handout of Performance Evaluation Technology, DEA (Data Envelopment Analysis)”, Department of Industrial Engineering and Management, National Chiao Tung University, Hsin Chu, Taiwan, 2003 (in Chinese).
8. Loannis, M., Herrmann, J. W., Lam, G., and Lin, E., “A Generative Approach for
Concurrent Manufacturing Evaluation and Subcontractor Selection”, Journal of Manufacturing Systems, v18, n6, pp.383-384, 1999.
9. Onrich, J., and Ruggiero, J., “An analysis of jackknifing”, The Journal of the Operational
Research Society, v53, n3, pp.342-346, 2002.
10. Peng, M.-R., “IC Industry Review in 2003”, Industrial Technology Research Institute, Industrial Technology Information Services Plan, pp.1-2, 2003 (in Chinese).
11. Thanassoulis, E., Introduction to the Theory and Application of Data Envelopment Analysis, New York, Kluwer Academic Publishers, 2001.
12. Xie, W.-L., “Plastic IC Assembly Process”, Industrial Material, pp.121-125, 1996 (in Chinese).
13. Zhou, X.-S., “Outsourcing Capacity Planning for IC Design House”, Department of Industrial Engineering & Management, National Chiao Tung University, Hsin Chu, Taiwan, Doctor’s thesis, 2003 (in Chinese).
Authors’ Biographies
Kun-Feng Lee had his bachelor degree from the Department of Electrical Engineering of Fung Chia University. He is working in an integrated device manufacturer company as a manager of Subcontracting Engineering Department. He gains experiences in semiconductor IC packaging manufacturing technology for more then ten years, also with more subcontracting management experiences and well knows the subcontracting system.