國 立 交 通 大 學
分子醫學與生物工程研究所
碩 士 論 文
建立一種可應用於流式細胞儀上檢測之
螢光微脂體複合體及其特性探討
Development and characterization of a
velcro liposomal complex as a fluorescent
probe by the flow cytometer
研 究 生: 馬冠倫
指導教授: 廖光文 博士
建立一種可應用於流式細胞儀上檢測之螢光微脂體複合體及
其特性探討
Development and characterization of a velcro liposomal complex as a fluorescent probe by the flow cytometer
研 究 生:馬冠倫 Student:Kuan-Lun Ma 指導教授:廖光文 Advisor:Kuang-Wen Liao 國 立 交 通 大 學 分子醫學與生物工程研究所 碩 士 論 文 A Thesis
Submitted to Institute of Molecular Medicine and Bioengineering College of Biological Science and Technology
National Chiao Tung University in partial Fulfillment of the Requirements
for the Degree of Master
in
Molecular Medicine and Bioengineering
July 2010
Hsinchu, Taiwan, Republic of China
i
建立一種可應用於流式細胞儀上檢測之螢光微脂體複合體及
其特性探討
研究生:馬冠倫 指導教授:廖光文 博士 國立交通大學分子醫學與生物工程研究所摘要
用於檢測與定量生物標記之技術已被快速發展及應用於研究與臨 床診斷上。一般而言,生物標記是利用抗體-抗原為主之免疫檢測系統 進行偵測,抗體會專一性地與特定抗原蛋白結合並可藉由標定物來定 量。此篇研究建立之螢光物質標定之微脂體可作為探針應用於免疫檢 測系統上。Lipo-PEI-PEG complex (LPPC)為本實驗室開發出來之新型 微脂體,它具有穩定且快速吸附各種蛋白之能力且蛋白本身可保有原 本之生物活性,此外 LPPC 亦具有容易被脂溶性螢光物質標定之特性。 這篇研究成功建立了螢光標定之 LPPC,並測試其在流式細胞儀上 偵測細胞激素(cytokine)之可行性。研究結果顯示其螢光強度與細胞激 素之濃度成正比。同時此研究亦比較了與傳統用來偵測細胞激素之酵 素連結免疫吸收分析(ELISA)間的差異性。因此,以螢光標定之 LPPC 作為檢測探針可提供作為另一種免疫檢測之方式。ii
Development and characterization of a velcro liposomal complex
as a fluorescent probe by the flow cytometer
Student: Kuan-Lun Ma Advisor: Dr. Kuang-Wen Liao Institute of Molecular Medicine and Bioengineering
National Chiao Tung University
Abstract
The techniques to identify and quantify biomarkers have been developed rapidly on research and clinical diagnosis. Generally, detections for biomarkers are performed using the antibody-based immunoassay system, in which the targeting proteins are specifically bound by their antibodies and the complex can be detected via some signal-reporting labels. Here, an alternative is the fluorescent dyes incorporated liposomes as immunoassay probes. Lipo-PEI-PEG complex (LPPC) is a novel liposome, composed of lipids and two polymers. LPPC can strongly and quickly adsorb various proteins and maintain their own functions on surface. Furthermore, LPPC are easily incorporated lipophilic fluorescent dyes.
In this study, fluorescent dye-labeled LPPC was constructed and its ability for detection of soluble proteins by the flow cyotometer was examined. At the field of soluble cytokines, the total fluorescence intensity is proportional to the concentrations of target cytokines. The limitations were also evaluated compared with traditional ELISA assay. Thus, LPPC as a probe may provide an alternative method to immunoassay.
iii
Acknowledgements
旭日東昇,夜幕低垂,週而復始,連綿不絕。碩士班的影子在這看似無窮的 輪迴中重複七百餘次後終將離我而去,和這所謂的影子分別之後,心中卻是滿懷 感恩,與其說這是一個階段的結束,毋寧說是破蛹而出的新生,在這過程曾經幫 助我砥礪我乃至於指正我的人,都值得讓我向你們一一道謝。 首先,必須感謝我的指導教授 廖光文博士,對我而言,他是學術上的啟蒙 者、人生的嚮導。在學習及研究中,從基礎的學科知識,到後來的實驗設計理論、 方法甚至於實驗的邏輯性,無一不傾囊相授、諄諄教誨。在人生智慧的道上,每 每其深富哲理之語有如醍醐灌頂,所謂:「知之難,不在見人,在自見。」因此老 師所言有助於自我省思與改進。故在老師循循善誘之下,便覺如沐春風,受益甚 豐。此外,參與學生口試的吳彰哲老師、鄭添祿老師及蔡女滿老師,除感激各位 老師在論文上提出的許多關鍵指點與良好建議外,對於老師們在研究與做人處事 上的心路歷程的分享,更是切中內心。真可謂:朝聞道,夕死可矣! 接著,我要對敬愛的于鈴學姊、彥谷學長及家弘學長表達感謝之意,作為同 一組的前輩,能願意犧牲時間給予我在實驗及論文上寶貴的建議,更不吝於分享 自己的經驗,進而減少我走錯路的機會,今時今日能開花結果,學長姊們居首功 而當之無愧矣。其次我要感謝我友愛的維瞳、筱薇和靜敏,在研究的旅途上有時 如虎尾春冰,作為同窗,有你們的提攜扶持,才能使我度過那些艱難困苦的時刻, 感激之情,溢於言表,道謝當不在話下。接著我要謝謝我喜愛的宗翰與姝怡,雖 身為學弟妹,許多在課業與生活的問題仍多虧了你們才能解決,在我的論文研究 中亦貢獻良多,可道:道之所存,師之所存也。同時你們與美惠、廷諺亦扮演了 在我的學習中重要的角色,但願你們能一路順遂平安。再者我需要對親愛的助理 欣怡訴說對她的感激之意:感謝你擁有洞悉人心與撫慰心靈的特質,還有小巧而 美麗的文學素養,並且在適當的時間地點展現地淋漓盡致,猶如黑夜中的明燈、 枯井中的月光一般給予我很多的支持,能認識你真是三生有幸。而在那些無盡的 寂寥中要感謝堅甫、琇民及芳正陪我渡過一次次的深河幽谷。此外,許多已離開 實驗室的學長姊及學弟妹,給我的幫助不勝枚舉,其實千言萬語也不足以表達大 家對我的協助,但願這寥寥數句能夠傳達我對每個人的謝意。 最近我必須謝謝我的家人二十多載以來無怨的付出,九我之恩,三世難報, 你們值得擁有這無上的榮耀,但願吾能以自身成就報答其養育之恩,唯其恩報, 而後已矣。 冠倫 頓首iv
Contents
Abstract in Chinese ... i Abstract ... ii Acknowledgements ... iii Contents ... ivLists of Figures and Legends ... vi
Lists of Tables ... vii
Abbreviations ... viii
Introduction ... 1
Materials and Methods ... 5
Materials ... 5
Reagents ... 5
Kits ... 5
Methods ... 5
LPPC preparation ... 5
Cholesterol liposome preparation ... 6
Determination of characteristics of LPPC ... 7
DiI and DiO labeling and purification ... 8
Measurement of particle numbers of components by the flow cytometer ... 8
Determination of blocking reagents and fluorescence performance ... 9
v
The effects of fluorescent probes by the flow cytometry ... 10
Statistical analysis ... 11
Results ... 12
Characterizations of LPPC ... 12
The performance of detection probe on the flow cytometry ... 13
The effects of blocking reagents on the fluorescent intensity ... 14
The fluorescent intensities of probes with various concentrations of dyes ... 15
The measurements of cytokines by the fluorescent probes ... 16
Discussion ... 19
Figures and Legends ... 24
vi
Lists of Figures and Legends
Figure 1. Schematic illustration of the fluorescent detection probes for the
flow cytometry. ... 24
Figure 2. The characteristic of centrifugation of LPPC. ... 26
Figure 3. The character of protein adsorption of LPPC. ... 28
Figure 4. The character of fluorescent dyes labeling on LPPC. ... 30
Figure 5. The particle distributions of LPPC, blocking reagents, and solutions on the flow cytotmetry. ... 31
Figure 6. The influences of BSA and PEG1500 as blocking reagents on fluorescent intensities. ... 34
Figure 7. The fluorescent intensities of the various concentrations of dyes on the flow cytometry. ... 36
Figure 8. The fluorescent distributions of fluorescent probes on the flow cytometry. ... 39
Figure 9. The measurements of rat IL-6 cytokines on the flow cytometry or ELISA assay. ... 41
Figure 10. The measurements of rat IL-10 cytokines on the flow cytometry or ELISA assay. ... 43
Figure 11. The measurements of mouse IFN- cytokines on the flow cytometry or ELISA. ... 45
vii
Lists of Tables
viii
Abbreviations
BSA: bovine serum albumin
DiI: 1,1′-Dioctadecyl-3,3,3′,3′-tetramethylindocarbocyanine perchlorate DiO: 3,3′-Dioctadecyloxacarbocyanine perchlorate
DMSO: dimethyl sulfoxide
DOPC: 1,2-dioleoyl-sn-glycero-3-phosphocholine DLPC: 1,2-dilauroyl-sn-glycero-3-phosphocholine FSC: forward scatter IL-6: interleukin 6 IL-10: interleukin 10 IFN-interferon gamma LPPC: Lipo-PEI-PEG complex OD: optical density
PBS: phosphate buffered saline PEI: polyethyleneimine
PEG: polyetylenen glycol SSC: side scatter
1
Introduction
To devise a detecting system with high sensitivities, the nano-particles, such as liposomes, colloidal golds, and quantum dots, are recently utilized as assay system’s materials. Liposomes were first described by A. D. Bangham in England at 1965 [1] and they have been widely investigated in recent four decades. Liposomes are spherical particles and are composed of one or more phospholipid bilayers surrounding an aqueous volume. Liposomes have two parts of lipophilic and hydrophilic in their formation. The lipophilic part is composed of the hydrocarbon chains, and the other part is made of phosphate and choline groups [2]. The amphiphilic character provides not only self-assembly but also the abilities of carrying the lipophilic and hydrophilic molecules. Besides, liposomes are usually modified on their surface to enhance the encapsulation, provided the targeting ability, protected the structure, and prolonged the circulation times. For instance, modification of liposomes with specific ligands, such as antibodies or oligopeptides enables liposomes to target to specific tumors or tissues [3, 4]. On the other hand, another approach for prolonging circulation times of liposomes is modified by poly-ethylene glycol (PEG)
2
on the surface [2]. Nowadays liposomes have been utilized for biological or clinical diagnostics [5-7]. At this field, liposomes in which the detectable molecules, e.g. dyes or specific markers are encapsulated, can provide significant enhancement in immunoassays. Fluorescent markers such as sulforhodamine B (SRB) were also used for liposome immunoassay and measured by spectrofluorometer [8].
Our laboratory has developed a novel liposome, Lipo-PEI-PEG complex (LPPC), which is a cationic liposome with an average diameter of nanometer scale. Our unpublished results showed that the zeta-potential of LPPC on its surface was about positive 41.4±1.2 mV, and the average diameter was about 216±4 nm. The previous data also illustrated LPPC could adsorb various proteins on its surface mainly via the electrostatic force, and the proteins still maintain their bio-activities and functions. Until now, LPPC presented the abilities of being a good carrier and showed the potential to induce specific immune responses in vitro and in vivo. Nevertheless, the probabilities of LPPC to apply on detection or diagnosis still need further investigation.
3
Flow cytometry is a well-known technique especially for laboratory research, biological practice, and clinical diagnosis worldwide. Flow cytometry has the following advantages of being fast, sensitive, and accurate for both qualitative and quantitative analysis [9]. Compared to traditional immunoassay or fluorescent microscopy, flow cytometry provides an alternative to present particle numbers and quantify of interesting markers simultaneously. However, flow cytometer cannot detect smaller components, e.g. soluble chemical compounds or proteins. This inconvenience may limit the applications for specific usages.
Trying to improve the inconvenience, one of the methods is incorporating fluorescent dyes into liposomes. Brussaard et al. reported that virus could be detected when used nucleic acid specific dyes, SYBR GREEN [10]. Another method is utilizing targeting liposomes or nano particles to catch the targets and then detect the particles to represent interesting targets [5]. So a liposome-based probes should have the properties of being detectable on the flow cytometry, being separable from other particles, and having the specific binding activity to targets. In this research, we used the LPPC as a liposome-based fluorescent probe,
4
modifying by fluorescent dyes, target antibodies, and blocking reagent, PEG, on its surface (Fig. 1). Then we evaluated the feasibility of applications with the flow cytometry, the results indicated that the novel LPPC-based fluorescent probe indeed measured the cytokines by flow cytometer.
5
Materials and Methods
Materials Reagents
The following reagents and chemicals were obtained or purchased as indicated: DOPC and DLPC were purchased from Avanti Polar Lipids. Cholesterol, DiI, DiO, PEG8000, and PEI25000 were purchased from SIGMA.
PEG1500 was purchased from SHOWA. BSA was purchased from
Invitrogen. DMSO was purchased from MP Biomedicals. Methanol was purchased from C-Echo.
Kits
Rat IL-6, Rat IL-10, and Mouse IFN- DuoSet ELISA kits were purchased from R&D systems.
Methods
LPPC preparation
LPPC was prepared by thin-film hydration method with modified. Briefly, both DOPC and DLPC were dissolved in chloroform in a
6
concentration of 50 mg/ml (w/v). 200 l of DOPC and DLPC were mixed with 400 l of methanol in a round-bottom flask. Then placed the flask on a rotary evaporator and exposed to vacuum until the solvent removed. Added 2 ml of methanol to re-dissolve the lipids, exposed to vacuum again until the solvent almost removed. Then placed the flask on the rotary evaporator with 37℃, minimum rotary speed, and without exposed to vacuum until dried. After the solvent was removed, a thin, homogeneous lipid film was obtained on the bottom of the round-bottom flask. 2 ml of aqueous solution containing 0.27 g of PEI25000 and 0.088 g of PEG8000 was added and gently
rotated for about 30 minutes to rehydrate the lipid film. When finished the rehydration, the solution in the flask was agitated for 10 minutes. The LPPC was placed at room temperature overnight after agitation. Then, using an extruding apparatus to extrude the LPPC through 200 nm polycarbonate membrane filter 9 times. Last, the LPPC was stored at 4℃ until used.
Cholesterol liposome preparation
Two different amounts of cholesterol were mixed with DOPC and DLPC to obtain two molar ratios of cholesterol and lipids, namely 1:9 and
7
1:4. The following procedures were the same as LPPC preparation.
Determination of characteristics of LPPC Centrifuge speed
20 l of LPPC was added in 980 l of ddH2O and returned to room
temperature. Then different centrifuge speeds were utilized for 5 minutes. The supernatants were separated from pellets and the pellets were suspended by 1 ml of ddH2O. The turbidities were estimated via OD600.
Capacity
20 l of LPPC was added in 980 l of ddH2O and returned to room
temperature. Then it was centrifuged at 10,000 rpm for 5 minutes to separate free components from LPPC. After removed the supernatants, 500 l of ddH2O were added to suspend the LPPC pellets. The above procedure
was the basic purification of LPPC, and all the following experiments related to LPPC were utilized the pretreatment or with little modified.
For estimation of BSA capacity on LPPC and cholesterol liposome, 20 l of LPPC or cholesterol liposome were purified first as previous described. Then different amounts of BSA were added and mixed into 40
8
g of LPPC or cholesterol liposome suspended in 100 l of ddH2O. After
incubation at 37℃ for 20 minutes, 900 l of ddH2O were added and then
centrifuged at 10,000 rpm for 5 minutes. The pellets were suspended and dissolved by 1 ml of 1:1 (v/v) DMSO/PBS. The quantifications of BSA capacity were measured by Bradford protein assay.
DiI and DiO labeling and purification
DiI and DiO were dissolved in DMSO at a concentration of 375 M and 93.75 M respectively. Different amounts of DiI or DiO were incubated with 100 g of purified LPPC suspended in the 100 l of ddH2O
for 30 minutes at room temperature and avoid light. Then, the dye-labeled LPPC were centrifuged at 10,000 rpm for 5 minutes and repeated once to remove free DiI or DiO.
Measurement of particle numbers of components by the flow cytometer
BSA was dissolved in ddH2O at a concentration of 50 g/ml. PEG1500
was also dissolved in ddH2O and at a concentration of 2 mg/ml. 5 l of
9
The above three components and two solutions, H2O and PBS, were
measured for 30 seconds at various FSC gates, E01, E00, and E-1, by the flow cytometer.
Determination of blocking reagents and fluorescence performance
DiI and DiO were incorporated into the LPPC and purified as previous described. The pellets of 100 g dye-labeled LPPC were suspended by 100 l of ddH2O. Then 20 l of PEG1500 solution or BSA solution at
concentrations of 100 mg/ml and 5 mg/ml respectively were added to 20 g of DiI or DiO-labeled LPPC suspended in 20 l of ddH2O. The mixture
were incubated for 30 minutes at room temperature and avoid light. After incubation, the appearances and fluorescence intensities were measured at the E00 gate.
To observe the influence of blocking reagents on fluorescence, different amounts of DiI and DiO labeled on the LPPC and purified as previous described. The pellets of 100 g dye-labeled LPPC were suspended by 100 l of ddH2O. After suspension, 20 l of PEG1500 solution
10
DiO labeled LPPC in 20 l ddH2O for 30 minutes at room temperature and
avoid light. Last, the fluorescence intensities were measured by the flow cytometer.
Preparation of fluorescent probes
DiI and DiO were dissolved in DMSO at a concentration of 375M and 93.75M respectively. And 4 l of DiI and 4.8 l of DiO were mixed with 100 g of purified LPPC suspended in 100 l of ddH2O for 30
minutes at room temperature and avoid light. Then the dye-labeled LPPC were centrifuged at 10,000 rpm for 5 minutes and repeated once. After centrifugation, the pellets were suspended by 10 l of ddH2O. Then various
amounts antibodies depended on cytokine kits were mixed with DiI or DiO LPPC for 30 minutes. Next, LPPC-DiI and LPPC-DiO were blocked by PEG1500 as previous described. The fluorescent probes were performed after
blocking.
The effects of fluorescent probes by the flow cytometry
The fluorescent probes were prepared as previous described. 25 g of LPPC-DiI and LPPC-DiO were mixed with various amounts of target
11
cytokines for 30 minutes and avoid light. Then 1 ml of ddH2O was added.
The solutions were analyzed by the flow cytometer to detected the fluorescence on FL-1 and FL-3 filters.
Statistical analysis
All results were presented as mean±SD. All results were performed at least two independent experiments. The statistical significance were computed by Student's t-test. p < 0.05 was considered significant.
12
Results
Characterizations of LPPC
In this study, the characteristics of LPPC were examined. LPPC consisted of lipids and polymers, it appeared as white and suspended complex after preparation. First, we determined whether LPPC could be purified by centrifugation to discard the nonreactive components. Therefore, the various speeds of centrifuge were tested to precipitate LPPC. The turbidities of the supernatants and the pellets were used to evaluate the efficiency of centrifugation. The results showed the turbidities of supernatants' were decreased and the pellets' were increased as the centrifuge speeds were raised (Fig. 2a), and centrifugation from 8000 rpm reached a plateau for the efficiency of pellet formation. Figure 2b showed that LPPC could be formed a solid pellet at the bottom of the tube after centrifugation.
To be a detective probe, LPPC should have the ability to adsorb or conjugate with the targeting proteins, e.g. antibodies. Here, we first examined whether LPPC owned the capacity to adsorb proteins. BSA was
13
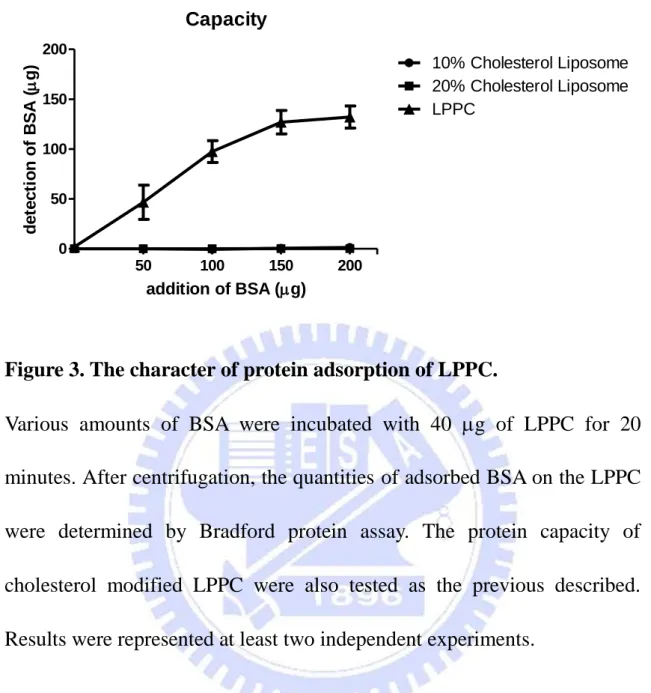
utilized to study this characteristic. The results showed the adsorbed BSAs on LPPC were increasing as the additions of BSA were increased and the maximum adsorption was about 130 to 140 g BSA per 40 g LPPC (Fig. 3). In contrast, it was showed that the protein binding capacity of LPPC almost disappeared as LPPC was modified by adding 10% or 20% cholesterol related to lipids in the LPPC preparation (Fig. 3). In addition, LPPC showed it could not only adsorb BSA on its surface but also various proteins, such as enzymes and antibodies (Table 1).
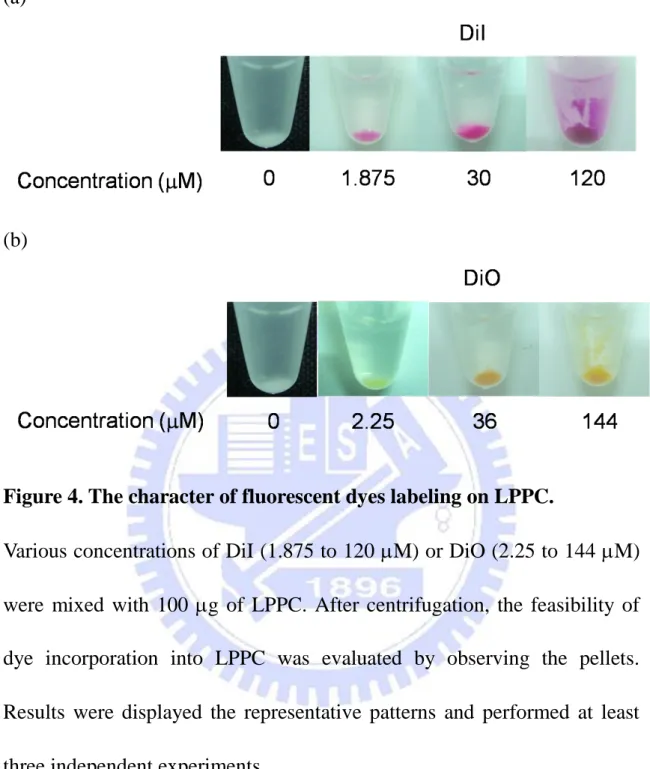
To evaluate the feasibility of LPPC as fluorescent probe, fluorescent lipophihlic dyes, DiI or DiO, were utilized as labeling molecules. The results displayed that DiI and DiO both could incorporated into LPPC at different concentrations (Fig. 4).
The performance of detection probe on the flow cytometry
Different gates of forward scatter (FSC) were selected and monitored the particle distribution of LPPC using FSC and side scatter (SSC) plot on the flow cytometry. The blocking components or solutions were also determined their particle distributions as above. The FSC-SSC dot
14
histogram demonstrated that no particles of the blocking components or solutions were detectable under the E-1 gate except the particles of LPPC. However, only few LPPC particle numbers were present in FSC-SSC dot histogram under the E-1 gate. On the other hand, the FSC-SSC dot histogram under E00 gate also showed only LPPC could be detectable but not other components, and the E00 gate could detect more the particles of LPPC than E-1 gate. Although E01 gate could monitor more the particle numbers of the LPPC than E00, however, other materials were also detected at this gate, even were H2O or PBS. As a consequence, E00 gate
might be a suitable condition for detection (Fig 5).
The effects of blocking reagents on the fluorescent intensity
It is required to block the positive charge on the surface of LPPC to prevent from causing non-specific bindings between antigens and LPPC. For this reason, BSA and PEG were respectively used to determine their effects and the results revealed BSA seemed to increase the fluorescence intensities of DiI or DiO labeled LPPC as monitoring with FL-3 or FL-1 filter. In contrast, PEG as blocking reagent could neutralize the positive charge of LPPC surface (data not shown) and slightly decreased the
15
fluorescence intensities of LPPC, no matter which fluorescent dyes utilized (Fig. 6).
The fluorescent intensities of probes with various concentrations of dyes
At this part, various concentrations of DiI or DiO were added to incorporate into LPPC, and the fluorescent intensities were quantified by the flow cytometry. The results illustrated the concentrations of DiI or DiO were proportional to the fluorescent intensities. DiI emitted red fluorescence, so it was detectable with FL-2 and FL-3 filters but not FL-1 filter. Similarly, DiO emitted green fluorescence and represented evidently at FL-1 filter. Surprisingly, the results also showed the fluorescence of DiO could be detected at FL-2 and FL-3 filter, though the intensities were lower than FL-1 filter. According previous results, PEG was used to block the non-specific adhesion. Thus, whether the PEG-blocking will influence the fluorescent intensity or not was next examined. Figure 7 showed that both the fluorescent intensity of DiI and DiO would be reduced by PEG-blocking. But the trends did not change significantly.
16
The measurements of cytokines by the fluorescent probes
Sequentially, the detection probes were further examined whether they could detect various soluble cytokines or not. The specific antigens were mixed with DiO-labeled and DiI-labeled probes, quantified their fluorescent intensities by flow cytometer. And two fluorescent filters, FL-1 or FL-3, were used to detect green or red fluorescence. Figure 8a and 8b showed the fluorescent distributions of LPPC-DiI or LPPC-DiO alone respectively. Figure 8c showed the fluorescent distributions of two fluorescent probes mixed without the addition of antigen, and their fluorescence were not interfered each other comparing to the results of figure 8a and 8b. Figure 8d revealed the intensities of fluorescence would be increased by the addition of antigen. Here, the total fluorescence intensity (TFI) was used to represent the amounts of antibody bound to antigen, and TFI is calculated as the mean fluorescence intensity (MFI) multiplied by the numbers of events in gate.
Rat IL-6, rat IL-10 or mouse IFN-cytokines were utilized as examples in this study. The plots revealed the relative fluorescent intensities were antigen dose-dependent (Fig. 9a, 9b, 10a, 10b, 11a, and
17
11b). As measurement of rat IL-6 cytokine (the amounts are between 30.4 to 820 pg), the fluorescent intensities of FL-1 showed a linearity (Fig. 9a) when the amounts of IL-6 cytokine were increased but their FL-3 fluorescence is not linear (Fig. 9b). Figure 9c showed a standard curve of IL-6 cytokine measured by traditional ELISA kit, and it represented a linear curve. Figure 9d illustrated that the ELISA assay curve which was tested those amounts of IL-6 cytokine applied on the flow cytometry before, and it revealed the values of optical density were too low to distinguish the difference between the background and samples when the quantities of cytokines was below to 91.1 pg.
Contrary to rat IL-6 cytokine test, FL-3 fluorescence showed a better linearity than FL-1 fluorescence when rat IL-10 cytokine was measured as quantities between 14.8 to 400 pg (Fig. 10a and 10b)The standard curve of IL-10 cytokine measured by ELISA kit assay at figure 10c showed a linear curve. The conditions of IL-10 cytokine for flow cytometry also tested by the ELISA assay and the results showed all samples could be significantly detectable by this kit (Fig. 10d).
18
Third, different amounts of mouse IFN- cytokine were also measured by flow cytometer as their quantities were between 0.74 to 60 pg. The fluorescence measured by FL-1 or FL-3 filters both could express linearity as the amounts of antigens increased (Fig. 11a and 11b). Figure 11c showed the mouse IFN- cytokine standard curve measured by ELISA assay. In addition, the quantities of cytokines used on the flow cytometry also were measured by the ELISA kit assay. And the results showed the values of OD450 were not obviously distinguishable from background when the
19
Discussion
In this study, we developed liposomal fluorescent probes and they will be applied to quantify the soluble cytokines by the flow cytometry. The principle section of the fluorescent probes was utilized a novel, cationic liposome-based complex, LPPC, which were developed by our laboratory previously. The feasibility of LPPC could be fluorescent probes was first evaluated. LPPC could be purified easily by centrifugation, be incorporated by fluorescent DiI or DiO, adsorb antibodies and remain the activities of bound antibodies. The non-specific bindings of this fluorescent probe could be eliminated by PEG modification on the surface. Finally, we proved the fluorescent LPPC could interact with target cytokines and the complex could be analyzed on the flow cytometry.
The basic characteristics of LPPC have been described as previously, here other characteristics were examined. The optical density at 600 nm was usually used as the indicator to express the turbidity [11] and here it was used to determine the efficiency of centrifugation at different speeds for LPPC. We found LPPC could be centrifuged and reached a plateau from
20
8000 rpm (Fig. 2). This feature could purify the LPPC immunocomplex to discard the free additives easily. Besides, LPPC could be labeled by fluorescent dyes, DiI or DiO (Fig. 4). DiI and DiO are long-chain, lipophilic fluorescent dyes and they are commonly applied to detect cell-cell fusion and adhesion [12-14], trace cells migration in vitro [15], or label the lipoproteins [16, 17]. The dyes label cells via diffusion into the membrane and do not transfer from labeled cells to unlabeled cells in general [18]. Here we also discovered the particle sizes of dye-labeled LPPC became larger compared to unlabeled LPPC (274.6 and 255.5 nm for DiI and DiO-labebled LPPC v.s. 216.4 nm for unlabeled LPPC). In addition, LPPC could adsorb proteins on the surface. However, the capacity of LPPC for protein adsorption was decreased violently by modification of cholesterol (Fig. 3). Generally, cholesterol was added into the liposomes during preparation, in order to modulate the flexibility and increase the rigidity. It could enhance the stability of liposomes in circulations. However, if the proportion of cholesterol was raised, the amounts of PEI in the surface might be decreased. The capability of LPPC for adsorption is resulted from electrostatic forces by PEI and velcro-like interactions. So addition of cholesterol would cause velcro-like surface of LPPC to become
21
rigid and the percentage of phospholipids on the surface would further decrease [19], thus resulted in declines of PEI content and LPPC protein capacity.
The fluorescence of DiI or DiO labeled LPPC could be detected on the flow cytometry and the fluorescent intensities were proportional to the concentrations of additional dyes (Fig. 7a). The fluorescent peaks on the plot of emission wavelength (x-axis) and intensity (y-axis) were asymmetrical, they had a tailing-shift phenomenon at longer wavelength but not at shorter wavelength [20]. Thus, we also found the DiO fluorescence could be detected by FL-2 FL-3 filters except of FL-1. It may be explained why the DiO fluorescence could be detected at FL-2 and FL-3 filters.
On the other hand, minimizing the non-specific bindings is one of the most important parts of being probes. The positive charge of PEI on the surface of LPPC is one of the main factors to cause the non-specific bindings. Here, BSA and PEG1500 were tested as blocking reagents and
22
previously discovered PEG1500 showed better blocking effect than BSA.
Besides, we observed PEG1500 reduced the fluorescent intensities; however,
the fluorescent intensities increased when used BSA as blocking reagents. PEG1500 has smaller molecular weight and caused less structural hindrance
than BSA. As a result, PEG1500 could spread on the surface of fluorescent
LPPC and thus quenched the fluorescence. On the contrast, the average molecular weight of BSA is 66,000 Da, LPPC might aggregated each other when adsorbed BSA. So the increment of fluorescent intensities as BSA added might result from the LPPC aggregation.
The practicable probe for use on the flow cytometry should: (1) provide a strong and stable fluorescence in the detectable range, (2) not be affected or contaminated by changes in the solutions or samples, (3) provide a satisfied sensitivity and repeatability, (4) not disturb the process, (5) simplify the procedure as much as possible [21]. Fluorescent LPPC was attempted to achieve the applications on the flow cytometry. Consequently, the soluble cytokines were tested and evaluated the efficacy compared to ELISA assays. Figure 8 showed DiI or DiO labeled LPPC did not interfere each other, and when the target cytokines added, the fluorescent intensities
23
would increase. Figure 9 to 11 illustrated fluorescent LPPC could be utilized for measurements of rat IL-6, rat IL-10, and mouse IFN- cytokines at various concentrations. The fluorescence were different between cytokines, and different affinities between antibodies and antigens resulted in the variances. The same conditions of target cytokines were also estimated, and we found the ELISA assays showed less sensitivity than fluorescent LPPC assays on the flow cytometry at some cytokines detection.
In conclusion, this study showed LPPC had the abilities of being fluorescent probes, including the convenience purification, antibodies adsorption, fluorescent dyes labeling, and detectable by the flow cytometer. Thus soluble cytokines could be detected on the flow cytometry with fluorescent LPPC. This fluorescent probe provides alternatives for soluble proteins detection in biological applications and diagnosis.
24
Figures and Legends
Various target
cytokines
25
Figure 1. Schematic illustration of the fluorescent detection probes for the flow cytometry.
The following procedures were utilized for the preparation of fluorescent probes: The LPPC was first labeled by fluorescent dyes, DiI or DiO. Next, the target antibodies were adsorbed on their surface. Then PEG1500 was
used to block the surface of fluorescent liposomes. After preparation, DiI-labeled and DiO-labeled liposomes were mixed and incubated with target cytokines. The degrees of detection were measured by the flow cytometer.
26 (a)
27
Figure 2. The characteristic of centrifugation of LPPC.
Various speeds of centrifugation were used to determine whether LPPC could be purified by centrifugation. OD600 was presented as the tubidities of
the supernatant and pellet to evaluate the feasibility of centrifugation (a). The appearances of LPPC before and after centrifugation (b). Results were presented two independent experiments.
28 Capacity 50 100 150 200 0 50 100 150 200 10% Cholesterol Liposome 20% Cholesterol Liposome LPPC addition of BSA (g) d e te c ti o n o f B S A ( g)
Figure 3. The character of protein adsorption of LPPC.
Various amounts of BSA were incubated with 40 g of LPPC for 20 minutes. After centrifugation, the quantities of adsorbed BSA on the LPPC were determined by Bradford protein assay. The protein capacity of cholesterol modified LPPC were also tested as the previous described. Results were represented at least two independent experiments.
29
Proteins Assay methods
Bovine serum albumin (BSA) Bradford protein assay
FITC-conjugated BSA Spectrofluorometer
-galactosidase Enzyme activity
HRP-conjugated antibody Enzyme activity
Helicobacter pylori heat shock
protein 60
OD280 absorbance
Urease B OD280 absorbance
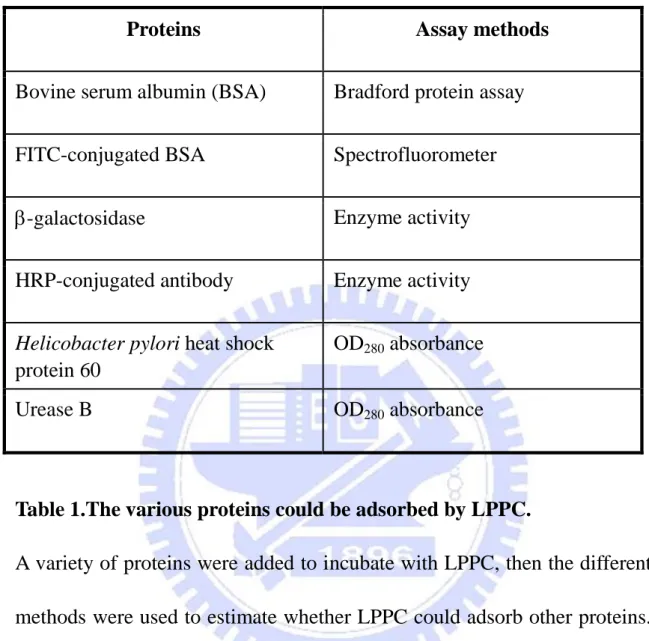
Table 1.The various proteins could be adsorbed by LPPC.
A variety of proteins were added to incubate with LPPC, then the different methods were used to estimate whether LPPC could adsorb other proteins. The results were cited from Yen-Ku Liu and Chia-Hung Chen (NCTU).
30 (a)
(b)
Figure 4. The character of fluorescent dyes labeling on LPPC.
Various concentrations of DiI (1.875 to 120 M) or DiO (2.25 to 144 M) were mixed with 100 g of LPPC. After centrifugation, the feasibility of dye incorporation into LPPC was evaluated by observing the pellets. Results were displayed the representative patterns and performed at least three independent experiments.
31 (a)
(b)
(c)
32 (e)
33
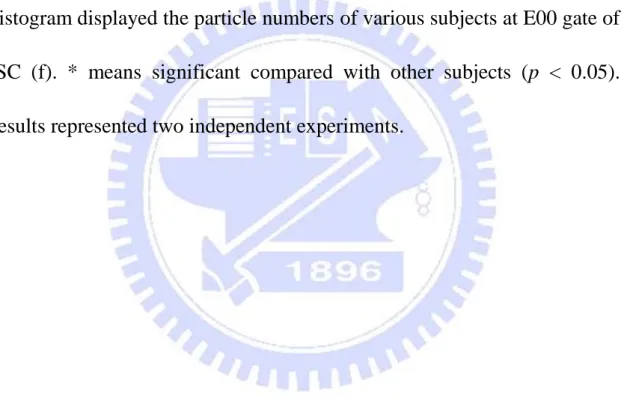
Figure 5. The particle distributions of LPPC, blocking reagents, and solutions on the flow cytotmetry.
H2O (a), PBS (b), 50 g/ml of BSA (c), 2 mg/ml PEG1500 (d), and 50 g/ml
of LPPC (e) were measured for 30 seconds via E01, E00, and E-1 gate (from left to right) of FSC and SSC plots on the flow cytometry. Figure a to e were displayed the one of the representative patterns of the experiments. Histogram displayed the particle numbers of various subjects at E00 gate of FSC (f). * means significant compared with other subjects (p < 0.05). Results represented two independent experiments.
34 (a)
35
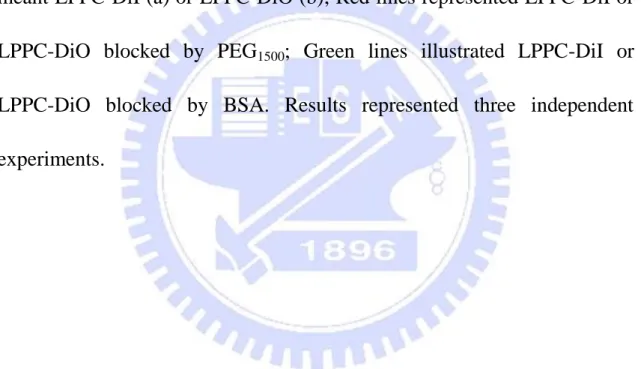
Figure 6. The influences of BSA and PEG1500 as blocking reagents on fluorescent intensities.
100 g of BSA or 20 l of PEG1500 at a concentration of 50 mg/ml were
added with LPPC-DiI or LPPC-DiO. After purification, the fluorescent intensities were measured by the flow cytometer. Figure 6a displayed the LPPC labeled by DiI and figure 6b were LPPC labeled by DiO. Black lines meant LPPC-DiI (a) or LPPC-DiO (b); Red lines represented LPPC-DiI or LPPC-DiO blocked by PEG1500; Green lines illustrated LPPC-DiI or
LPPC-DiO blocked by BSA. Results represented three independent experiments.
36 (a)
37 (b)
38
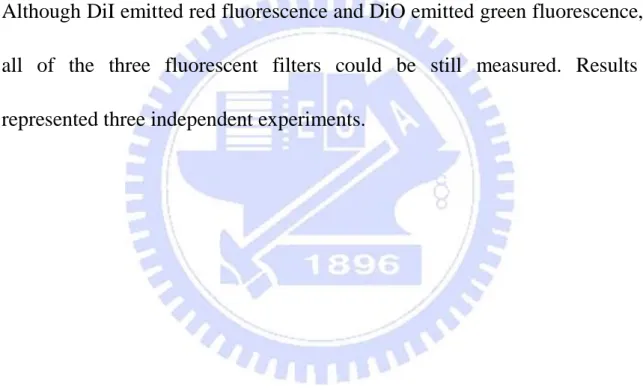
Figure 7. The fluorescent intensities of the various concentrations of dyes on the flow cytometry.
Different concentrations of DiI (0.23 to 60 M) or DiO (0.28 to 72 M) were mixed with 100 g of LPPC. After purification, fluorescent dye-labeled LPPC were further incubated without (a) or with (b) PEG1500
blocking. The fluorescent intensities were estimated by the flow cytometer. Although DiI emitted red fluorescence and DiO emitted green fluorescence, all of the three fluorescent filters could be still measured. Results represented three independent experiments.
39 (a) (b) (c) (d) FL3 -H FL3 -H
40
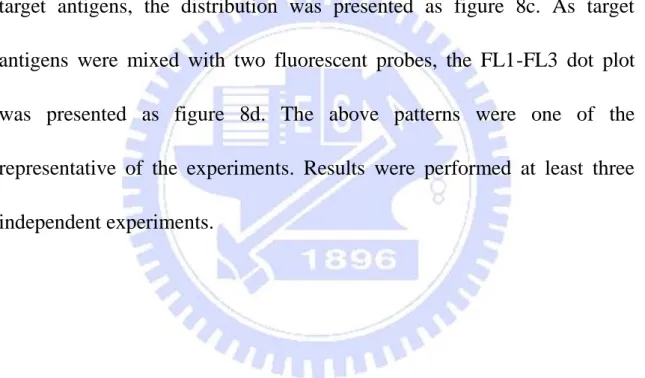
Figure 8. The fluorescent distributions of fluorescent probes on the flow cytometry.
FL1-FL3 dot plots were utilized to evaluate the fluorescent distributions of LPPC-DiI and LPPC-DiO. After preparation of fluorescent probes, LPPC-DiI was displayed on the FL1-FL3 dot plot as figure 8a and LPPC-DiO was figure 8b. When mixed two fluorescent probes without target antigens, the distribution was presented as figure 8c. As target antigens were mixed with two fluorescent probes, the FL1-FL3 dot plot was presented as figure 8d. The above patterns were one of the representative of the experiments. Results were performed at least three independent experiments.
41
(a) (b)
(c) (d)
Figure 9. The measurements of rat IL-6 cytokines on the flow cytometry or ELISA assay.
Fluorescent probes were prepared as previous described. Various amounts of rat IL-6 cytokines were mixed with two probes, and then their fluorescence were detected on the flow cytometry. The green fluorescent intensities presented on FL-1 filter (a) and red fluorescent intensities presented on FL-3 filter (b). The commercial standard curve for rat IL-6 test showed a linear curve on the ELISA assay (c). The quantities of target antigens for flow cytometry were also applied on the ELISA assay, and the
42
pattern showed on figure 9d. Results represented three independent experiments.
43
(a) (b)
(c) (d)
Figure 10. The measurements of rat IL-10 cytokines on the flow cytometry or ELISA assay.
Fluorescent probes were prepared as previous described. Various amounts of rat IL-10 cytokines were mixed with two probes, and then their fluorescence were detected on the flow cytometry. The green fluorescent intensities presented on FL-1 filter (a) and red fluorescent intensities presented on FL-3 filter (b). The commercial standard curve for rat IL-10 test showed a curve on the ELISA assay (c). The quantities of target
44
antigens for flow cytometry were also applied on the ELISA assay, and the pattern showed on figure 10d. Results represented three independent experiments.
45
(a) (b)
(c) (d)
Figure 11. The measurements of mouse IFN- cytokines on the flow cytometry or ELISA.
Fluorescent probes were prepared as previous described. Various amounts of mouse IFN- cytokines were mixed with two probes, and then their fluorescence were detected on the flow cytometry. The green fluorescent intensities presented on FL-1 filter (a) and red fluorescent intensities presented on FL-3 filter (b). The commercial standard curve for mouse IFN- test showed a linear curve on the ELISA assay (c). The quantities of
46
target antigens for flow cytometry were also applied on the ELISA assay, and the pattern showed on figure 11d. Results represented four independent experiments.
47
References
[1] A.D. Bangham, M.M. Standish, J.C. Watkins, Diffusion of univalent ions across the lamellae of swollen phospholipids, J Mol Biol 13 (1965) 238-252.
[2] H. Barani, M. Montazer, A review on applications of liposomes in textile processing, J Liposome Res 18 (2008) 249-262.
[3] G. Huang, Z. Zhou, R. Srinivasan, M.S. Penn, K. Kottke-Marchant, R.E. Marchant, A.S. Gupta, Affinity manipulation of surface-conjugated RGD peptide to modulate binding of liposomes to activated platelets, Biomaterials 29 (2008) 1676-1685.
[4] M. Wang, M. Thanou, Targeting nanoparticles to cancer, Pharmacol Res 62 (2010) 90-99.
[5] Y. Pellequer, M. Ollivon, G. Barratt, Methodology for assaying recombinant interleukin-2 associated with liposomes by combined gel exclusion chromatography and fluorescence, J Chromatogr B Analyt Technol Biomed Life Sci 783 (2003) 151-162.
[6] L.J. Ou, S.J. Liu, X. Chu, G.L. Shen, R.Q. Yu, DNA encapsulating liposome based rolling circle amplification immunoassay as a versatile
48
platform for ultrasensitive detection of protein, Anal Chem 81 (2009) 9664-9673.
[7] A. Gunnarsson, P. Sjovall, F. Hook, Liposome-based chemical barcodes for single molecule DNA detection using imaging mass spectrometry, Nano Lett 10 (2010) 732-737.
[8] J.A. Ho, H.W. Hsu, M.R. Huang, Liposome-based microcapillary immunosensor for detection of Escherichia coli O157:H7, Anal Biochem 330 (2004) 342-349.
[9] S. Bjornsson, S. Wahlstrom, E. Norstrom, I. Bernevi, U. O'Neill, E. Johansson, H. Runstrom, P. Simonsson, Total nucleated cell differential for blood and bone marrow using a single tube in a five-color flow cytometer, Cytometry B Clin Cytom 74 (2008) 91-103.
[10] C.P. Brussaard, D. Marie, G. Bratbak, Flow cytometric detection of viruses, J Virol Methods 85 (2000) 175-182.
[11] D. Hongve, G. Å kesson, Comparison of nephelometric turbidity measurements using wavelengths 400–600 and 860 nm Water Research 32 (1998) 3143-3145
[12] R. Ramanathan, M.F. Wilkemeyer, B. Mittal, G. Perides, M.E. Charness, Alcohol inhibits cell-cell adhesion mediated by human L1, J Cell
49 Biol 133 (1996) 381-390.
[13] L. Huerta, E. Lamoyi, A. Baez-Saldana, C. Larralde, Human immunodeficiency virus envelope-dependent cell-cell fusion: a quantitative fluorescence cytometric assay, Cytometry 47 (2002) 100-106.
[14] L. Huerta, N. Lopez-Balderas, C. Larralde, E. Lamoyi, Discriminating in vitro cell fusion from cell aggregation by flow cytometry combined with fluorescence resonance energy transfer, J Virol Methods 138 (2006) 17-23. [15] A. Glavaski-Joksimovic, C. Thonabulsombat, M. Wendt, M. Eriksson, H. Ma, P. Olivius, Morphological differentiation of tau-green fluorescent protein embryonic stem cells into neurons after co-culture with auditory brain stem slices, Neuroscience 162 (2009) 472-481.
[16] X. Wang, Y. Zheng, Y. Xu, J. Ben, S. Gao, X. Zhu, Y. Zhuang, S. Yue, H. Bai, Y. Chen, L. Jiang, Y. Ji, L. Fan, J. Sha, Z. He, Q. Chen, A novel peptide binding to the cytoplasmic domain of class A scavenger receptor reduces lipid uptake in THP-1 macrophages, Biochim Biophys Acta 1791 (2009) 76-83.
[17] Y.Q. Xiong, H.C. Sun, W. Zhang, X.D. Zhu, P.Y. Zhuang, J.B. Zhang, L. Wang, W.Z. Wu, L.X. Qin, Z.Y. Tang, Human hepatocellular carcinoma tumor-derived endothelial cells manifest increased angiogenesis capability
50
and drug resistance compared with normal endothelial cells, Clin Cancer Res 15 (2009) 4838-4846.
[18] D.J. Swinton, M.J. Wirth, Lateral diffusion of 1,1'-dioctadecyl-3,3,3'3'-tetramethylindocarbocyanine perchlorate at the interfaces of C18 and chromatographic solvents, Anal Chem 72 (2000) 3725-3730.
[19] F. de Meyer, B. Smit, Effect of cholesterol on the structure of a phospholipid bilayer, Proc Natl Acad Sci U S A 106 (2009) 3654-3658. [20] R.P. Haugland, Handbook of Fluorescent Probes and Research Products, ninth ed., Molecualr Probes, 2002.
[21] V.S. Malinin, M.E. Haque, B.R. Lentz, The rate of lipid transfer during fusion depends on the structure of fluorescent lipid probes: a new chain-labeled lipid transfer probe pair, Biochemistry 40 (2001) 8292-8299.