行政院國家科學委員會補助專題研究計畫成果報告
※※※※※※※※※※※※※※※※※※※※※※※※※
※不同型態的運動(游泳 vs. 跑步)對大鼠骨骼的影響※
※
The effects of differ ent exer cise modes, swimming vs. r unning,
※
※
On the bone of r ats
※
※※※※※※※※※※※※※※※※※※※※※※※※※
計畫類別:þ個別型計畫 □整合型計畫
計畫編號:NSC 89-2314-B-002-380-
執行期間:89 年 8 月 1 日至 90 年 7 月 31 日
計畫主持人:楊榮森(臺大醫學院骨科)
共同主持人:謝伸裕(臺灣師大體育系)
劉興華(臺大醫學院毒理學所)
本成果報告包括以下應繳交之附件:
□赴國外出差或研習心得報告一份
□赴大陸地區出差或研習心得報告一份
□出席國際學術會議心得報告及發表之論文各一份
□國際合作研究計畫國外研究報告書一份
執行單位:臺大醫學院骨科
中
華
民
國
90
年
10
月
5
日
行政院國家科學委員會專題研究計畫成果報告
不同型態的運動(游泳 vs. 跑步)對大鼠骨骼的影響
The effects of differ ent exer cise modes, swimming vs. r unning,
On the bone of r ats
計畫編號:NSC 89-2314-B-002-380
執行期限:89 年 8 月 1 日至 90 年 7 月 31 日
主 持 人:楊榮森 國立臺灣大學醫學院骨科
共同主持人:謝伸裕 國立臺灣師範大學體育系
計畫參與人員:黃滄海 國立臺灣師範大學體育系
中文摘要 機械性負荷是影響骨骼發展相當重要的因子 之一,不同的運動模式可能對骨骼產生不同的機械 性負荷型態。適當運動所產生的機械性負荷有助於 顛峰骨量的增加,並有預防骨質疏鬆症的效應。本 研究的目的在於利用所建立之動物模式,探討不同 型態的適當強度運動對大鼠骨骼的影響。 本研究以 36 隻 Wistar 雄性大鼠(五週大)為 動物實驗樣本,將之隨機分派至如下三組:控制組 (CON),跑步組(RUN)及游泳組(SWIM)。 其中跑步組大鼠以動物跑步機為訓練工具,運動強 度約為 70% V•O2max 的適中強度;而游泳組大鼠則 是於每次游泳訓練前在其尾巴繫上等值於其體重 2%的重物,再將之放入水槽中進行游泳訓練,亦屬 於適中強度的運動。兩組運動組每天均進行 1 小時 的運動訓練,每週訓練 5 天,訓練期共為期 8 週。 所有的實驗動物將在訓練期結束後以斷頭方式犧 牲,採集血液樣本後,將取下之脛骨、股骨與脊椎 進行如下分析:1. 血清中骨代謝指標測定; 2.右脛 骨近端海綿骨組織型態學分析;3. 左脛骨及左股骨 的骨密度評估:以雙能 X 光吸收測量儀(DEXA) 檢查;4. 骨骼強度檢測:以 MTS (model-858)材 料 測 試 儀 , 測量骨骼強度。結果顯示,運動訓練顯 著減少大鼠體重的增加,而在血清中的骨代謝指標 則顯示 SWIM 組有較低的第一型膠原羧基端交鍵的 末端胜月太 (ICTP)濃度。雖然骨檢查呈現組廣泛的在 脛骨與股骨各區段有較高的 BMD 及 BMC。但組織 型態學及材料力學分析結果指出,除了游泳大鼠的 脛骨斷裂負荷值較低外,其餘數值則並未呈現組間 差異。結論:控制組在 BMD 及 BMC 有較高的絕對 值,可能由於其體重較高的關係。一些相對性的數 據,例如組織型態學的分析結果可看出運動組有並 不亞於控制組,甚至有優於控制組的趨勢。然而, 游泳似乎還是仍未能提供骨骼足夠的刺激,以致於 游泳組的脛骨的斷裂負荷值較低於跑步運動組。關 鍵詞:游泳、跑步、運動型態、骨骼發育 Abstr actMechanical loading is an important factor on bone development. Different exercise modes will produce variable mechanical loading styles on the bone.
Moderate exercise-induced produced mechanical loading will increase the peak bone mass and prevent osteoporosis. The purpose of this study is to investigate the effects of different exercise modes, swimming vs. running, on the rat’s bone through moderate exercise program.
Thirty-six male Wistar rats (5-wk-old) will be randomly divided into three groups: control group (CON), running group (RUN) & swimming group (SWIM). Running exercise will be held on the treadmill. The running group will be trained at moderate exercise intensity (about 70% V•O2max) and
the swimming trained animals will swim with a weight attached to their tails (about 2% of body weight). The training sessions will be 1hr/day and 5 days/wk for a period over 8wks. All rats will be sacrificed by decapitation after the last training session. After blood sample collected, tibia, femur and spine will be immediately removed from each animal. The following parameters will be measured: 1. Serum bone metabolic marker assay; 2. Spongy bone mass parameters of proximal right tibia by histomorphometric analysis. 3. Left tibia bone and left femur mineral density by DEXA (Dual energy X-ray absorptiometry). 4. Compression breaking force of bone by material testing system (MST-858). Results: Exercise training significantly reduced the increment of body weight. In serum bone marker assay, swimming training group show the lower carboxyterminal cross-linked telopeptide of type I collagen (ICTP). Although the CON was comprehensively higher in BMD and BMC value, there is no significantly difference in histomorphometric structure and biomaterial property among groups, except for the lower fracture load of SWIM tibia. In conclusion, the higher absolute in BMD and BMC of CON might be caused from the higher body weight. From the viewpoint of relative values, such as histomorphometric analysis, exercise groups didn’t show any less value than control group. Simply comparing the RUN and SWIM, we didn’t find any adapted differences in spongy bone structure. However, swimming training might not provide sufficient stress for the development of bone. Therefore, SWIM had lower fracture resistance than RUN and
CON.Key wor ds: swimming, running, exercise mode, bone development
Intr oduction
It’s well known that mechanical loading is an important factor on bone development1,2. According to the exercise modes, different exercise style might produce variable mechanical loading styles and show the site-specific effects on the bone3-6.
In general, moderate exercise produced mechanical loading that will promote the bone formation and increase the peak bone mass7, 8. This might be help to prevent the occurrence or slowing down the rate of osteoporosis. In order to obtain more and enough mechanical loading, weight-bearing exercise is widely suggested for a better bone development7, 9. Except for muscle stretch, skeletal system might not receive sufficient mechanical loading from non-weight-bearing exercise, such as swimming10. Previous studies related to the effects of weight-bearing and non-weight-bearing exercise on bone were mostly limited to the human beings. Non-weight-bearing exercise, most as swimming, was usually concluded to have no effects on bone mineral density and bone mineral content11-16. However, the effects of different mechanical loading type on bone development has not been further investigated in spongy bone structure and bone biomaterial property. The purpose of this study is to investigate the effects of different exercise modes using our animal models, swimming vs. running, on the rat’s bone through moderate exercise program.
Mater ials and Methods
Animals: Twenty-nine male Wistar rats (3 weeks of
age) were obtained from Animal Center of National Taiwan University and were all kept under controlled conditions which included a 22 ± 1°C room temperature and a 12:12 h light-dark cycle. Animals were fed with Purina Laboratory Rodent Diet (PMI ®, St. Louis, MO, USA, 0.95% calcium) and distilled water ad libitum. Body weight of all the animals was determined weekly. The experiment began when the rats were seven weeks old.
Exper imental design: Animals were randomly
assigned into three groups, including 1) running group (RUN), serves as weight-bearing exercise group, 2) swimming group (SWIM), serves as non-weight-bearing exercise group, and 3) control group (CON).
Exer cise tr aining pr otocol: Training protocol of RUN
was set according to the previous study processed in our laboratory17. Animals of RUN underwent exercise training program on the treadmill for 8 weeks (5 days/wk). An electric gird at the rear of the treadmill was used as a running stimulus. Exercise program began when the rats were 7-wk old. In the first week, rats ran for 15 min/day at 12 m/min on the level treadmill. The exercise duration and intensity progressively increased to 60min at speed of 20 m/min
during the training period. Rats of SWIM were began the training at the same time. The swimming trained animals swam with a weight attached to their tails (about 2% of body weight). Daily training duration was consistent with RUN.
Bone samples collection: After the end of training
secession (age 15-wk-old), all the animals were sacrificed by decapitation. The blood was collected for bone marker assay. The right and left tibiae and left femur were dissected, cleaned of soft tissues. The right tibiae were fixed in 10% ice-cold formalin for 48h at 4°C. The left tibia and right femur were also removed and kept in -20°C for densitometric and biomechanical strength assay.
Bone mar ker assay: For understating the bone
metabolic status, serum ICTP and PICP concentration were measured by using ICTP and PICP RIA assay kit (Orion Diagnostica Inc., Espoo, Finland). Concentrations of ICTP and PICP served as bone resorption and bone formation marker, respectively.
Bone histomor phometr y: After fixation was completed, the right tibiae were decalcified in 0.5N hydrochloric acid. Then dehydrated in an ascending series of ethanol solution and acetone, and embedded in paraffin. The serial sections (5 µm) were cut longitudinally and stained with Mayer's hematoxylin-eosin solution18.
The quantitative study of the spongy bone was performed by histomorphometry in the procedures described by Bourrin et al. 19, respectively. Images of the proximal tibia were photographed using a photoMicroGraphic Digitize integrate System (MGDS) (Total-Integra Technology Co., Ltd., Taipei, Taiwan). All measurements were done "in a single blind fashion". Bone volume ratio (BV/TV) measurement was performed in the epiphysis, primary spongiosa and secondary spongiosa. Bone mass parameters for each area (primary spongiosa, and secondary spongiosa) were measured using the image analysis software (Image Pro Plus 4.1 for Windows, Media Cybernetics, Maryland, USA).
Bone Miner al Density (BMD) Analysis
BMD of the left tibia was measured with a Norland XR-26 dual-energy X-ray absorptiometer (DEXA, Fort Atkinson, WI, USA). The left tibiae and femur were thawed to room temperature before BMD testing. The mode adapted to the measurements of small subjects was adopted. A coefficient of variation of 0.7% was calculated from daily measurements of BMD on a lumbar phantom for more than one year. The whole left tibia was scanned and then the image was divided into three areas: proximal quarter, distal quarter, and diaphyseal part. Each area was analyzed to take into account the changes in cortical and cancellous bone density. The division of the image is according to Bourrin et al19.
Biomechanical str ength assay
After the BMD assay, all the left tibiae and femur
were prepared for biomaterial testing. For investigating the maximal and fracture loading value of bone tissues,
we performed the three-point bending testing using a material testing system (MTS-858, MTS System Inc, Minneapolis, MN, USA).
Statistical analysis: All data are expressed as means ±
SD. One-way analysis of variance (ANOVA) was used to evaluate the effects of different exercise modes on the measured parameters. All statistical tests were evaluated using α = .05.
Results
Body weight: after the end of the 3rd week, exercise groups (RUN and SWIM) had significantly lower body weight than CON.
Time (week) 0 1 2 3 4 5 6 7 8 B o d y w e ig h t (g ) 0 200 300 400 500 RUN SWIM CON * * * * * *
Figur e 1. Body weight changes inthree groups during 8
wk of experiment: * RUN and SWIM showed significant lower body weight than CON (p<0.05).
Bone mar ker assay: In serum bone marker
examination, SWIM showed significant lower serum ICTP than CON. However, there is no significant difference in PICP among groups.
ICTP PICP S er um b on e m et ab o lic m ar k e r ( µ g /L ) 0 5 10 15 20 25 RUN SWIM CON *
Figur e 2 Serum bone metabolic marker concentration,
ICTP and PICP: * CON showed significant higher serum ICTP than SWIM (p<0.05).
Bone histomor phometr ic analysis: In histomorphometric analysis, there is no significant difference showed in spongy bone structure.
Epiphysis secondary B V /T V ( %) 0.0 0.1 0.2 0.3 0.4 0.5 0.6 RUN SWIM CON
Figur e 3 Histomorphometric analysis in different zones
spongy bone (Key: Secondary, secondary spongiosa; BV/TV, Bone volume/Tissue volume, the part of cancellous space filled with trabeculae)
Bone miner al density: In BMD examination, CON
and RUN showed higher BMD at total tibia and proximal tibia. In addition, CON had more BMC in total, proximal and diaphysis as compared to SWIM (p< .05). In femur, CON still had the higher BMD at total femur and BMC at diaphysis and distal femur than RUN and SWIM. Furthermore, CON showed a higher proximal BMD, distal BMD and total BMC as compared to SWIM (p< .05).
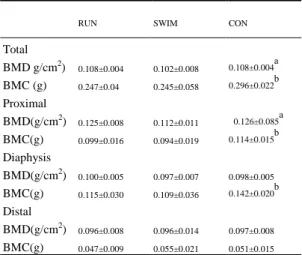
Table 2 Bone mineral densities in total and three
division of tibia
RUN SWIM CON
Total BMD g/cm2) 0.108±0.004 0.102±0.008 0.108±0.004a BMC (g) 0.247±0.04 0.245±0.058 0.296±0.022b Proximal BMD(g/cm2) 0.125±0.008 0.112±0.011 0.126±0.085a BMC(g) 0.099±0.016 0.094±0.019 0.114±0.015b Diaphysis BMD(g/cm2) 0.100±0.005 0.097±0.007 0.098±0.005 BMC(g) 0.115±0.030 0.109±0.036 0.142±0.020b Distal BMD(g/cm2) 0.096±0.008 0.096±0.014 0.097±0.008 BMC(g) 0.047±0.009 0.055±0.021 0.051±0.015 a
p< .05: CON and RUN significantly higher than SWIM;
b
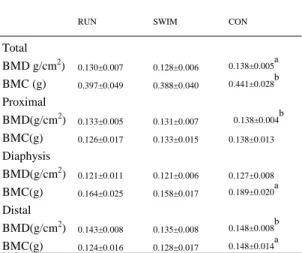
Table 3 Bone mineral densities in total and three
division of femur
RUN SWIM CON
Total BMD g/cm2) 0.130±0.007 0.128±0.006 0.138±0.005a BMC (g) 0.397±0.049 0.388±0.040 0.441±0.028b Proximal BMD(g/cm2) 0.133±0.005 0.131±0.007 0.138±0.004b BMC(g) 0.126±0.017 0.133±0.015 0.138±0.013 Diaphysis BMD(g/cm2) 0.121±0.011 0.121±0.006 0.127±0.008 BMC(g) 0.164±0.025 0.158±0.017 0.189±0.020a Distal BMD(g/cm2) 0.143±0.008 0.135±0.008 0.148±0.008b BMC(g) 0.124±0.016 0.128±0.017 0.148±0.014a
ap< .05: CON significantly higher than RUN and SWIM;
bp< .05: CON significantly higher than SWIM.
Biomater ial examination: Except for the lower tibial
fracture load in SWIM as compared to CON (60.1± 13.1 vs. 83.5±15.8 Nt), there was no difference among groups in other value of biomaterial examination.
Maximal load Fracture load
L o a d ( N t) 0 20 40 60 80 100 120 140 160 RUN SWIM CON *
Figure 4 Maximal load and fracture load of tibia
Maximal load Fracture load
L o a d ( N t) 0 50 100 150 200 250 RUN SWIM CON
Figure 5 Maximal load and fracture load of femur
Discussion
As described in pervious studies, exercise training had the effects of weight loss in present study 19-21. The RUN and SWIM had less increment in body weight during the training period. In addition, there was no different value in body weight between RUN and SWIM. Therefore, the running and swimming training in present study caused similarly energy metabolic balance. This would be helpful in further comparison
between the two exercise groups.
Exercise did not show a significant effect on the expression of serum bone marker but just a lower serum ICTP in SWIM group. As previous study have suggested22, serum bone marker might significantly change during the initial stage of exercise stress.
In bone mineral density and bone mineral content analysis, CON showed the absolutely higher value than the two exercise groups. This might partly due to the higher body weight of CON. In previous studies23-25, body mass was highly related to BMD or BMC. Simply considering the effects of different exercise modes, RUN showed the higher BMD at total tibia, proximal tibia and distal tibia than SWIM. Although there is no statistically significant difference, weight-bearing exercise still showed the higher effects on BMD. Furthermore, the higher BMD of RUN was site-specifically showed in the knee of the animal.
From the viewpoint of relative value, exercise groups did not showed the inferior spongy bone structure. Interestingly, SWIM group even had the higher BV/TV in epiphysis than CON, although the statistically significant level is not attained.
In biomechanical strength testing, all the data we obtained was absolute and did not normalized by any factors. Except for the lower fracture load of SWIM’s tibia, there is not anymore difference among groups. With less body weight for skeletal system to support, we concluded that the exercise groups had a better relative bone mechanical property. Simply comparing the RUN and SWIM group, SWIM had an inferior biomaterial property. This might due to the less mechanical loading produced by swimming exercise.
Refer ences
1. Kannus, P., sievanen, H., and vuori. I. Physical loading, exercise and bone. Bone 18: 1s-3s; 1996. 2.Carter, D. R., van Der Meulen, M. C. H., and
Beaupre, G. S. Physical factors in bone growth and development. Bone 18: 5s-10s; 1996.
3.Bennell, K. L., Malcolm, S. A., Khan, K. M., Thomas, S. A., Reid, S. J., Brukner, P. D., Ebeling, P. R., and Wark, J. D. Bone mass and bone turnover in power athletes, endurance athletes, and controls: a 12-month longitudinal study. Bone 20: 477-484; 1997.
4. Taaffe, D. R., Robinson, T. L., Snow, C. M., and Marcus, R. High-impact exercise promotes bone gain in well-trained female athletes. J Bone Miner Res 12: 255-260; 1997.
5. Morel, J., Combe, B., Francisco, J., and Bernard, J. Bone mineral density of 704 amateur sportsmen involved in different physical activities. Osteoporos Int 12: 152-157; 2001.
6. Lee, E. J., Long, K. A., Risser, W. L., Poindexter, H. B., Gibbons, W. E., and Goldzieher, J. Variations in bone status of contralateral and regional sites in young athletic women. Med Sci Sports Exerc 27: 1354-1361; 1995.
exercise and the skeleton. Arch Physiol Biochem 103: 681-698; 1995.
8. Slemenda, C. W., Miller, J. Z., Hui, S. L., Reister, T. K., and Johnston, C. C. Jr. Role of physical activity in the development of skeletal mass in children. J Bone Miner Res 6: 1227-1233; 1991.
9. French, S. A., Fulkerson, J. A., and Story, M. Increasing weight-bearing physical activity and calcium intake for bone mass growth in children and adolescents: a review of intervention trials. Prev Med 31: 722-31; 2000.
10.Grimston, S. K., Willows, N. D., Hanley, D. A. Mechanical loading regime and its relationship to bone mineral density in children. Medicine and Science in Sports and Exercise 25: 1203-1210; 1993.
11.Taaffe, D. R., and Marcus, R. Regional and total body bone mineral density in elite collegiate male swimmers. J Sports Med Phys Fitness 39:154-159; 1999.
12.Emslander, H. C., Sinaki, M., Muhs, J. M., Chao, E. Y., Wahner, H. W., Bryant, S. C., Riggs, B. L., and Eastell, R. Bone mass and muscle strength in female college athletes (runners and swimmers). Mayo Clin Proc 73: 1151-1160; 1998.
13.Courteix, D., Lespessailles, E., Peres, S. L., Obert, P., Germain, P., and Benhamou, C. L. Effect of physical training on bone mineral density in prepubertal girls: a comparative study between impact-loading and non-impact-loading sports. Osteoporos Int 8: 152-158; 1998.
14.Cassell, C., Benedict, M., and Specker, B. Bone mineral density in elite 7- to 9-yr-old female gymnasts and swimmers. Med Sci Sports Exerc 28: 1243-1246; 1996.
15.Fehling, P. C., Alekel, L., Clasey, J., Rector, A., and Stillman, R. J. A comparison of bone mineral densities among female athletes in impact loading and active loading sports. Bone 17: 205-210; 1995. 16.Taaffe, D. R., Snow-Harter, C., Connolly, D. A.,
Robinson, T. L., Brown, M. D., and Marcus, R. Differential effects of swimming versus
weight-bearing activity on bone mineral status of eumenorrheic athletes. J Bone Miner Res 10: 586-593; 1995.
17.Huang, T. H., Chang, F. L., Hsieh, S. S., and Yang, R. S. The effects of different endurance training intensities on bone density and structure in rats. Med Sci Sport Exer 33: S26; 2001.
18.Yang, R. S., Lin, T. K., Lin-Shiau, S. Y. Increased bone growth by local prostaglandin E2 in rats. Calcif Tissue Int 52: 57-61; 1993.
19.Bourrin, S., Genty, C., Palle, S., Gharib, C., & Alexandre, C. Adverse effects of strenuous exercise: a densitometric and histomorphometric study in the rat. Journal of Appl Physiol 76: 1999 – 2005; 1994. 20.Chang, F. L., Huang, T. H., Hsieh, S. S., Yang, R.
S., and Lin, C. C. The effects of different endurance training intensity on systematic and peripheral citrate synthase activity. Med and Sci Sports Exer
33, S295; 2001.
21.Bigard, A. X., Brunet, A., Guezennec, and C. Y., Monod, H. Effects of chronic hypoxia and endurance training on muscle capillarity in rats. Pflugers Archiv 419: 225-229; 1991.
22.Holy, X., and Zerath, E. Bone mass increases in less than 4 wk of voluntary exercising in growing rats. Med Sci Sports Exer 32: 1562-1569; 2000.
23.Kreipe, R. E. Bone mineral density in adolescents. Pediatr Ann 24: 308-315; 1995.
24.Bendavid, E. J., Shane, J., and Barrett-Connor, E. Factors associated with bone mineral density in middle-aged men. J Bone Miner Res 11: 1185-1190. 25. Hasanoglu, A., Bideci, A., Cinaz, P., Tumer, L.,
and Unal, S. Bone mineral density in childhood obesity. J Pediatr Endocrinol Metab 13: 307-311; 2000.