運用層級分析法推衍智慧財產行銷策略--以交通大學為例
91
0
0
全文
(2) 運用層級分析法推衍智慧財產行銷策略---以交通大學為例 Deriving an Intellectual Property Marketing Strategy for National Chiao Tung University --Using Analytical Hierarchy Process Approach 研 究 生:許嘉如. Student:Chia-Ju Hsu. 指導教授:張力元. Advisor:Charles V. Trappey. 國 立 交 通 大 學 管 理 科 學 系 碩 士 論 文. A Thesis Submitted to Department of Management Science College of Management National Chiao Tung University in partial Fulfillment of the Requirements for the Degree of Master in Management Science June 2005 Hsinchu, Taiwan, Republic of China. 中華民國九十四年六月.
(3) Deriving an Intellectual Property Marketing Strategy for National Chiao Tung University – Using Analytical Hierarchy Process Approach. Student: Chia-Ju Hsu. Advisor: Dr. Charles V. Trappey. National Chiao Tung University. Department of Management Science. Abstract. Intangible assets play an essential role at organizations. It could create more value than tangible assets which refer to land, equipment, plant et cetera. Universities usually have a lot of R&D results which are industry wants to gain. After the legislation asserted university could own its intellectual property (IP), there are more and more TTOs (Technology Transfer Offices) or TLOs (Technology Licensing Offices) established. These offices are the bridge between the university and industry, doing the university/industry technology transfer (UITT).. Due to the different considerations between university and industry, this study focuses on the academic aspect to view what factors (or criteria) are important to the success of technology transfer and how much they are important. After understanding these rankings, IP marketing strategies would be constructed, it would be the effective way to help university to promote their intellectual property.. Keywords: Intellectual Property, Technology Transfer, Marketing Strategy. i.
(4) 運用層級分析法推衍智慧財產行銷策略--以交通大學為例 研究生:許嘉如. 指導老師:張力元. 教授. 國立交通大學 管理科學系碩士班 摘要 無形資產在組織中扮演舉足輕重的角色。它能創造比土地、機器設備等有形 資產更多的價值。學校裡通常擁有許多業界想要獲得的研發成果。在法令鬆綁後 學校可以擁有自身的智慧財產權,也接著出現越來越多的技術移轉中心。這些技 轉中心是學校與業界間的橋樑,負責執行學校與業界之間的技術移轉工作。 由於學術界與業界各有不同的考量,本研究著重於學術界的觀點,探究影響 技術移轉的各因素間相對的重要程度。藉此推衍出相關的行銷策略以作為學校推 廣研發成果的有效方式。. 關鍵字:智慧財產、技術移轉、行銷策略. ii.
(5) Acknowledgment. I have gotten many wonderful experiences within this two-year MBA education at National Chiao Tung University. This wonderful experience could not be achieved without many people’s help.. Firstly, I want to thank my advisor, Dr. Trappey. Without his great guidance, I could not finish my thesis. He also shares many professional marketing issues to me. I also want to thank Dr. Wang Yao-De, although he is not my advisor, he still shares his valuable experiences and provides me some suggestions. Thank Dr. Li Zheng-Zhong and Dr. He Shu-Xun for taking time to be my oral defense committees. Your great recommends are really helpful to me. Thank those professors and experts for my interviews. Your opinions are the essential and valuable content in my thesis.. There are also many thanks to my dear classmates: Yuan-Po, Chun-Peng, Yin-Shan, Zhi-Yin, Cheng-Chung, Wei-Jing, Chuan-Yi, Mei-Ye, Xiao-Yuan, Yi-Fen, Mei-Huan, etc. It is so lucky to be classmates with you. I have a lot of thanks for your encourage and support. There is so much happy time with you at the Department of Management Science.. Thank Fang-Chia for providing me much information about the TLO. Without your kindly help, I could not finish my thesis. Zhao-Zhi had given a great aspect and thinking to my thesis topic. Thank you very much. Chia-Han is experienced but so busy, always takes time to discuss with me and provide many professional aspects. And I should thank Guo-Zhang introduce to me and ask some classmates to help. There are so many people should be appreciated. Forgive me can not list all the names.. iii.
(6) Finally, I really want to give my love and appreciation to my dear family. My grandmother, father, mom, my sister and brother, thank you for supporting me at these two years. Without your considerations and support, I could not finish my MBA education on time. All my glories and honors are dedicated to you.. Chia-Ju Hsu. HsinChu, June 21, 2005. iv.
(7) Table of Contents Abstract ..............................................................................................................................i 摘要...................................................................................................................................ii Acknowledgment .............................................................................................................iii Table of Contents............................................................................................................. v List of Tables..................................................................................................................vii List of Figures...............................................................................................................viii CHAPTER 1 INTRODUCTION ................................................................................... 1 1.1 Background .........................................................................................................2 1.2 Problem Identification.........................................................................................2 1.3 Research Motivation and Research Purpose .......................................................3 1.4 Research Content ................................................................................................4 CHAPTER 2 LITERATURE REVIEW ....................................................................... 5 2.1 The Development of Taiwan IC industry ............................................................5 2.2 Intellectual Property ............................................................................................7 2.2.1 Patents ......................................................................................................8 2.2.2 Trademarks...............................................................................................9 2.2.3 Copyrights ................................................................................................9 2.2.4 Trade Secrets ..........................................................................................10 2.3 The Value of Intellectual Property Rights .........................................................10 2.4 The Development and Trend of Technology Transfer ...................................... 11 2.4.1 The Development of USA Technology Transfer.................................... 11 2.4.2 The Development of Taiwan Technology Transfer ................................ 11 2.4.3 Current Trend .........................................................................................12 2.4.3 How to Do Technology Transfer............................................................14 2.5 Terminology of Technology Transfer................................................................16 2.5.1 Definition of Technology .......................................................................16 2.5.2 Definition of Technology Transfer.........................................................17 2.5.3 Definition of Technology Transfer Mechanism .....................................18 2.5.4 Definition of Technology Transfer Channel...........................................19 2.5.5 Definition of Technology Transfer Approach ........................................19 2.6 Key Factors of Technology Transfer.................................................................20 CHAPTER 3 RESEARCH METHODOLOGY......................................................... 26 3.1 Research Issue and Framework.........................................................................26 3.2 Research Method...............................................................................................28 3.2.1 Interview and Questionnaire ..................................................................28 3.2.2 Algorithm ...............................................................................................28 v.
(8) 3.3 Thesis Hierarchy ...............................................................................................31 3.4 Calculations of AHP..........................................................................................35 3.5 Sample Selection...............................................................................................40 3.5.1 Data Collection ......................................................................................40 3.5.2 Pre-test ...................................................................................................41 CHAPTER 4 RESEARCH RESULTS ........................................................................ 42 4.1 Background of Respondents .............................................................................42 4.2 Data Analysis ....................................................................................................46 4.2.1 Validity of Results ..................................................................................46 4.2.2 Reliability of Results..............................................................................46 4.3 Analysis of Results............................................................................................47 4.3.1 Overall experts .......................................................................................47 4.3.2 Faculty members ....................................................................................50 4.3.3 TLO members ........................................................................................51 4.3.4 Cross-analysis ........................................................................................53 CHAPTER 5 DISCUSSIONS AND CONCLUSIONS............................................... 57 5.1 Summery of Conclusions ..................................................................................57 5.1.1 Conclusions of faculties’ aspect .............................................................57 5.1.2 Conclusions of TLO’s aspect .................................................................61 5.1.3 The difference between faculty and TLO...............................................63 5.2 Contributions.....................................................................................................64 5.3 Strategy construction and recommendations ....................................................64 List of References .......................................................................................................... 67 Appendix A: English Version of the Questionnaire ................................................... 70 Appendix B: Chinese Version of the Questionnaire................................................... 74 Appendix C: Information of experts ........................................................................... 79 Appendix D: Interview Record.................................................................................... 80. vi.
(9) List of Tables Table 1 Factors that facilitate or inhibit technology transfer ..........................................21 Table 2 Critical factors for successful technology transfer.............................................23 Table 3 Explanation of each criterion .............................................................................34 Table 4 Intensity of importance of AHP pairwise comparisons......................................35 Table 5 The form of AHP questionnaire .........................................................................37 Table 6 The modified nine-point scale comparisons.......................................................38 Table 7 The mean consistency index of randomly generated matrices...........................39 Table 8 Information of TLO members ............................................................................45 Table 9 Information of faculties......................................................................................46 Table 10 Rankings of criteria ..........................................................................................49 Table 11 Rank, criterion and weight of faculty and TLO ...............................................53 Table 12 Differences between faculty and TLO .............................................................63 Table 13 Roadmap for Technology Transfer...................................................................66. vii.
(10) List of Figures Figure 1 The infrastructure for chip foundries..................................................................6 Figure 2 The shift to System-on-Chip design infrastructure.............................................7 Figure 3 Product life cycle ..............................................................................................14 Figure 4 How a technology is transferred from a university to a firm............................15 Figure 5 NCTU technology transferring process ............................................................26 Figure 6 The process and structure of the methodology .................................................27 Figure 7 The structure of AHP ........................................................................................30 Figure 8 Thesis hierarchy of AHP...................................................................................32 Figure 9 The revised model of thesis hierarchy ..............................................................33 Figure 10 Matrix form of 3× 3 comparisons ................................................................38 Figure 11 Bar chart of respondents’ workplace...............................................................43 Figure 12 Bar chart of respondents’ title.........................................................................43 Figure 13 Bar chart of respondents’ seniority .................................................................45 Figure 14 Weights of each criterion and sub-criterion....................................................48 Figure 15 Weights and rankings of overall .....................................................................50 Figure 16 Rankings of criteria from faculties’ view .......................................................51 Figure 17 Rankings of criteria from TLO members’ view..............................................52 Figure 18 Ratio of criterion by faculty............................................................................55 Figure 19 Ratio of criterion by TLO ...............................................................................56 Figure 20 Rankings from faculties..................................................................................58 Figure 21 Portfolio constructor role in TLO ...................................................................60 Figure 22 Rankings from TLO........................................................................................61. viii.
(11) CHAPTER 1 INTRODUCTION. The development of Taiwan IC industry has moved in a rapid pace from manufacturing to design, shift from the follower to become the leader in the industry. The strength in mass production has been utilized and more diversity demands of customization which weakens the strength of traditional mass production. Less time-spending for time-to-market, enterprises devote to cost-down and short producing period. More globalization and alliances, more competitions exist between businesses. Nowadays, enterprises pay more attention on intangible assets which can create higher profits. The patent is the most important intangible asset in the organizations. For universities, there are many outstanding faculty members and rich resource for developing the useful technology. Once the R&D results come out, the academia would like to patent it and transfer it to industry. This study tries to construct the strategies in how to market or promote the intellectual property in university to the industry. Through understanding weight of each criterion which affected successful technology transfer helps both university and industry realize the importance ranking of factors at university aspect. From an industrial aspect, it could help them find useful technology and get revenue through commercialization. It also benefits the university because of the more technology transferring; the more monetary income could fund the further research. That would be a win-win solution. This chapter consists of four sections. The first one introduces the development of IC industry. The second one covers the problem discussion. The third part illustrates research motivation and purpose. The last one forms the framework of this thesis.. 1.
(12) 1.1 Background In the past, enterprises depended on the tangible assets like land and machines as the competitive advantages. Those who had more tangible assets were more powerful in the marketplace. Along with knowledge economy age approaching, the value of intangible assets is more important than the early ages. Knowledge workers create high benefits to company because of their intelligence. The intelligence in the brain needs no big space for storing, but creates high profits to the company. The intelligence is called intellectual property (IP) which includes patents, copyrights, trade secrets and trademarks. Patent, one of these properties, is especially significant to the IC industry, it spurs researchers to innovate new technology and bring the progressive power for the entire industry.. 1.2 Problem Identification Inventors always want to market their technology to produce physical products in order to be used by costumers. The completed process results in a success of innovation. Either faculties of university or engineers of company would like to see their new ideas be used for manufacturing new products, and then they can gain additional profit from their innovation. Thus, the marketing process is important to each innovator since they want to market their innovation. Many inventions belong to National Chiao Tung University (NCTU), and hopefully they will be used by the industry through using effective marketing ways, which is the purpose of this study. As there is limited resource of Technology Licensing Office (TLO), the arrangement of the resource is a very important issue in order to boost the usage of inventions. According to the interviews, most of faculties think there is a lot work needed to be done to innovation promotion. It is not only a big issue for NCTU, but also for other universities. Marketing strategies are needed to promote goods and services, so do research results. 2.
(13) 1.3 Research Motivation and Research Purpose Since 1960s, Taiwan’s IC industry development has been moving in a rapid pace, transferring from the OEM role to self-brand made; the typical examples like Acer and ASUS. Enterprises focus on their intangible assets, to understand self-own assets value. Through the patent analysis could know the competitive ability of rival company will be discovered and infringement will also be avoided. The academia has many outstanding faculties and plenty resources. The prior strength of academic organizations is the devotion to study, to research and to contribute to the industry. But the problem is there is no effective mechanism for marketing these research results. National Chiao Tung University (NCTU) is one of the best research universities in Taiwan; it has been picked up as the case study sample. Interview and questionnaire are used to find out several ways to do the effective promotion of research result for NCTU. The sample is divided into two main groups, technology licensing officials and faculties. The quantitative data of questionnaire are used to find out the different thoughts between these two groups. The qualitative information, which consists of several open questions, is used to construct the marketing strategies. A preemptive strategic move is the pioneering implementation of a strategy into a business area. Because it is the first, generates an asset or competence that forms the basis of a sustainable competitive advantage. For a preemptive move to create “first-mover advantages,” competitors must inhibit or prevent from duplicating or countering it (Aaker, 2001). Intellectual property can be regarded as a “product” because it can be traded. So, the marketing concepts are important to intellectual property, too. Marketing stars with the fact of human needs and wants (Kotler, 1994). Among the process of technology transfer (can be regarded as transaction), the vender (university) should understand what the customer (industry) needs. This study would construct the IP marketing strategy for 3.
(14) NCTU, in order to transfer its-owned IP to the industry. Through this process, companies would get the new technology and build more convenient and useful product to customers. And the profit of school is the royalty or licensing fee or the fund for further research from the industry.. 1.4 Research Content Chapter 2 covers the literature reviews which conclude intellectual property, technology transfer and marketing strategy. That illustrates several terminology and concepts. It also lists key factors of technology transfer. Chapter 3 presents the research process and methodology. The algorithm used in this study is called Analytical Hierarchy Process approach. Chapter 4 shows the results, the analysis and the findings. This chapter also concludes the analysis of the results from the different aspects. And the last chapter, chapter 5 consists of discussions and conclusions, providing marketing strategies and recommendations.. 4.
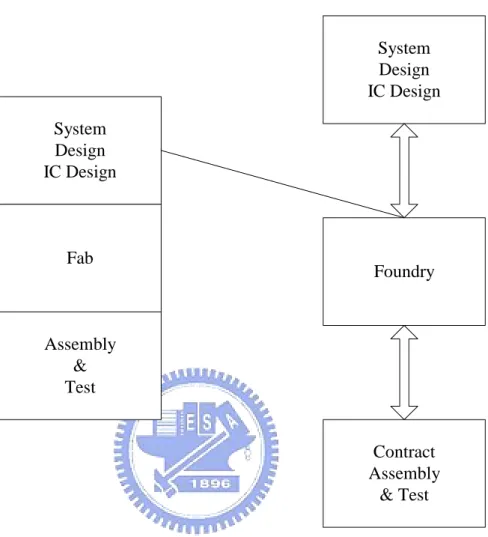
(15) CHAPTER 2 LITERATURE REVIEW. 2.1 The Development of Taiwan IC industry Taiwan’s IC industry began in the 1960s with IC packaging. Since Taiwan had little IC technology in the 1960s, packaging was used as a test case to demonstrate that there was a viable and sustainable market. By 1970, the government supported several laboratories to transfer the necessary technologies to build the fabrication and manufacturing facilities like the Industrial Technology Research Institute (ITRI) which is the fundamental institution of IC industry. In the industry, TSMC and UMC are the first two enterprises which are sponsored by the government to develop IC business, and as far as now, they are still the benchmarking enterprises in Taiwan IC industry. By the 1980’s, IC fabrication sites and IC design laboratories completed the supply chain, forming the first original IC industry in the Hsinchu Science Park (Lin and Trappey, 1997). During the 1990’s, Taiwan expanded the industry by adding several supportive industries to the supply chain aggressively. The end result was the creation of a comprehensive semiconductor manufacturing supply chain with an infrastructure which consisted of design houses, semiconductors and other component manufactures, masking process plants, testing companies, and a wide range of component packaging lines (Chen and Trappey, 2001). Figure 1 indicates that the focus was in the chip foundry development (Chang, 2001).. 5.
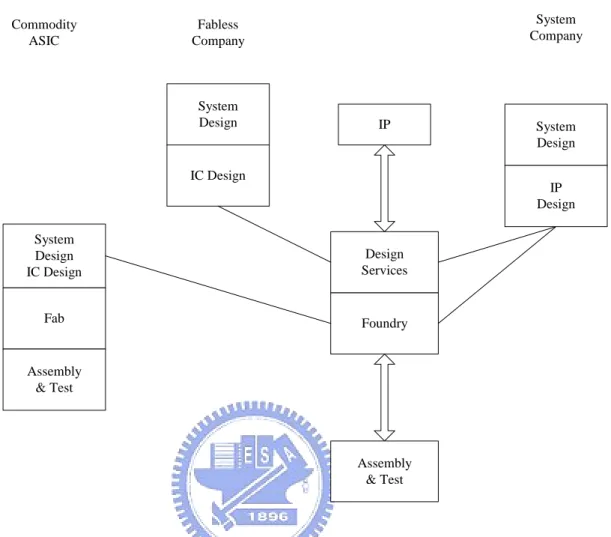
(16) Commodity/ ASIC Fabless Co. System Design IC Design System Design IC Design. Fab. Foundry. Assembly & Test. Contract Assembly & Test. Figure 1 The infrastructure for chip foundries Source: Chang, 2001. The current vision is to promote the creation of intellectual property across the supply chain. Taiwan’s traditional role as a manufacturing center is changing, businesses are facing new challenges, and entrepreneurs are recognizing new opportunities. The national initiative addresses this dynamic by using Taiwan’s manufacturing strength as an engine to drive new designs. Whereas the past emphasis has been on production, the new emphasis is on the creation of intellectual property, products and self-owned brands. The goal is to develop the Taiwan System-on-Chip (SoC) infrastructure. The infrastructure will better enable the global supply chain to source regional designs, mix-and-match intellectual property, manufacture, and test integrated circuits. Figure 2 indicates the change from chip foundries with OEM manufacturing to the System-on-Chip design supporting the view that Taiwan IC industry is entering a new 6.
(17) era in its industrial history (Chang, 2001). Commodity ASIC. System Company. Fabless Company. System Design. IP. IC Design. System Design IP Design. System Design IC Design. Design Services. Fab. Foundry. Assembly & Test. Assembly & Test. Figure 2 The shift to System-on-Chip design infrastructure Source: Chang, 2001. 2.2 Intellectual Property Intellectual property refers to creations of the mind: inventions, literary and artistic works, and symbols, names, images, and designs used in commerce (extracted from WIPO website). Intellectual Property usually refers to patents, trademarks, copyrights and trade secrets or know-how.. Intellectual property is divided into two categories: Industrial property, which includes inventions (patents), trademarks, industrial designs, and geographic indications of source; and Copyright, which includes literary and artistic works such as novels,. 7.
(18) poems and plays, films, musical works, artistic works such as drawings, paintings, photographs and sculptures, and architectural designs. Rights related to copyright include those of performing artists in their performances, producers of phonograms in their recordings, and those of broadcasters in their radio and television programs (Megantz, 2002).. 2.2.1 Patents A patent is a legal exclusive right for a limited term granted for an invention, which is a product or a process that provides a new way of doing something, or offers a new technical solution to a problem. A patent provides legal protection for the invention as described in the patent claims. The protection is granted for a limited period, depends on which patent it is, usually 20 years (extracted from USPTO website). A patent is the grant of a property right by a government to the inventor and the right given by the patent grant is the right to exclude others of making, selling or using the invention without authorization from the owner. Patent protection means that the invention cannot be commercially made, used, distributed or sold without the patent owner's consent. These patent rights are usually enforced in a court, holds the authority to prohibit infringement. Conversely, a court can also declare a patent invalid upon a successful challenge by a third party. There are three types of patent: invention patents, utility patents, and new design patents, which are categorized by the degree of the innovation, the first one represents the most innovative one. Patentability means three characteristics of patent granted, which includes usefulness, novelty, and non-obviousness. Usefulness means it is practicable to the legal industrial or commercial use. Novelty means it is new, differs in something form the publicly known or existing knowledge in the field. Persons work in the field would not consider the invention obviously could be regard as the. 8.
(19) non-obviousness.. 2.2.2 Trademarks A trademark is a word, name, symbol or device which is used in trade with goods to indicate the source of the goods and to distinguish them from the goods of others. It is the powerful distinctions for business let consumers differentiate the various goods. A service mark is the same as a trademark except that it identifies and distinguishes the source of a service rather than a product. The terms “trademark” and “mark” are commonly used to refer to both trademarks and service mark. The owner of a trademark can exclude others from using the similar trademark on similar or related goods or services if it is possibly make consumers feel confused (Stim, 2001). Trademark protection is granted to the first people selling or providing goods and services using the mark. If there is no commercial use, the owner could not keep the right. 2.2.3 Copyrights Copyright is a form of protection provided to the authors of “original works of authorship” including literary, dramatic, musical, artistic, and certain other intellectual works, both published and unpublished. The Copyright Act generally gives the owner of copyright the exclusive right to reproduce the copyrighted work, to prepare derivative works, to distribute copies or phone records of the copyrighted work, to perform the copyrighted work publicly, or to display the copyrighted work publicly. Copyright protection is acquired once an original work is finished in a certain perceptible form. The copyright protects the form of expression rather than the subject matter of the writing. The originality is required for copyright granted, it means the author did not copy something from others. It would not provide the exclusive right for the idea concern, this is the difference from patent right (Stim, 2001). 9.
(20) 2.2.4 Trade Secrets A trade secret is any type of business information that gives the company owns competitive advantage over the others who do not have this. Trade secret protection is acquired if the information is unknown to competitors and the information must be confidential and treated like a secret. The owner has the obligation to protect it, not show it publicly and be sure has some process to keep it. The protection of trade secret could last forever as long as the secret is kept confidential (Stim, 2001). The most famous one people always talking about is the Coca-Cola recipe. The choice for patent or trade secret protection is a trade-off. Patent filing needs to be disclosed the information of invention. However, the confidentiality to trade secret is the essentiality. Some invention could not meet the patentability instead of seeking the protection of trade secret is the usual way for business. The protected periods are also different for patent and trade secret. There is a limited time for patent protection, no more than 20 years; on the contrary, there is no time limit for trade secret as long as it is kept by certain confidential way.. 2.3 The Value of Intellectual Property Rights A basic knowledge of intellectual property rights allows innovators to protect their business, by applying of patents, or trade marks, or design registrations, by keeping records which prove ownership of design right or copyright and by proper handling of confidential information. Knight (1996) noted that once the rights have been secured, they can be used in three ways. Firstly, if your product is being copied, you can consider legal action. Secondly, if you can not supply all markets, for example, one having incompatible specialized requirements to your own, or overseas, you can grant a license to another company in return for a royalty payment. And the last, intellectual property. 10.
(21) rights (IPRs) also provide a way of controlling business associates, such as use of confidential information by a supplier of maintenance services for your product.. Overall, IPRs allow an innovative company to control and benefit from its ideas, even in other countries. Finally, avoid being sued yourself for infringement of someone else’s intellectual property without permission (Smith and Parr, 1994, 1995).. 2.4 The Development and Trend of Technology Transfer The concept of technology transfer is transferred form advanced countries like US, Germany and Japan. There are many factors which affect the success of technology transfer process, and these will be mentioned at 2.6. This section will present the development and trend of technology transfer of USA and Taiwan. 2.4.1 The Development of USA Technology Transfer In 1980, the US Congress attempted to remove potential obstacles to university/industry technology transfer (UITT) by passing the Bayh-Dole Act. Bayh-Dole removed many restrictions on licensing, allowed universities own its research results which sponsored by federal grants. This legislation asserted that the ownership and intellectual property management of university would accelerate the commercialization of new technology and promote economic development. After this legislation, many universities established the technology transfer offices (TTOs) to manage, protect and promote the intellectual property. The role of the TTO is to facilitate technology to industry and gain the licensing fee or/and royalty to assist in doing the further research. 2.4.2 The Development of Taiwan Technology Transfer Taiwan was affected by the Bayh-Dole Act also legislates for the university could own its intellectual property which was subsidized by the government. The Science and Technology fundamental Law claimed that:” The investment of science and technology 11.
(22) development which were subsidized by the government, should be depended on the evaluation or the examination for objects. The intellectual property and the achievement could be completely or partially owned by the research organization, it is not limited by the government-owned property law.” As the same effect as in USA, many technology transfer organizations were started. In NCTU, it was called Technology Licensing Office. It consisted of technology consultant, legal consultant and other managers. The three main functions of the TLO are: manage and protect the research results; promote the research results and technology transfer and licensing TLO plays an indispensable role of the university. Financial support by government has declined; universities have been advised to earn part of their research and development expenditure through technology transfer. That is the main reason of more and more technology transfer. 2.4.3 Current Trend Innovation can be regarded as a continuum process, from the radical to incremental (Mohr, Sengupta, and Slater, 2005). Most radical innovations are developed by R&D groups, maybe in companies, universities or research laboratories. These R&D groups had not thought about the particular commercial application in the market during the development process. In this situation, it is the supply-side market, revolutionary process. This market is referred to as “technology-push” situation. On the other hand, incremental innovations are the continuations of existing methods or practices and may involve extension of products which are already on the market. They are evolutionary as opposed to revolutionary. Incremental innovations occur in demand-side, customer pull markets, in which product characteristics are well defined and customers can realize their needs.. 12.
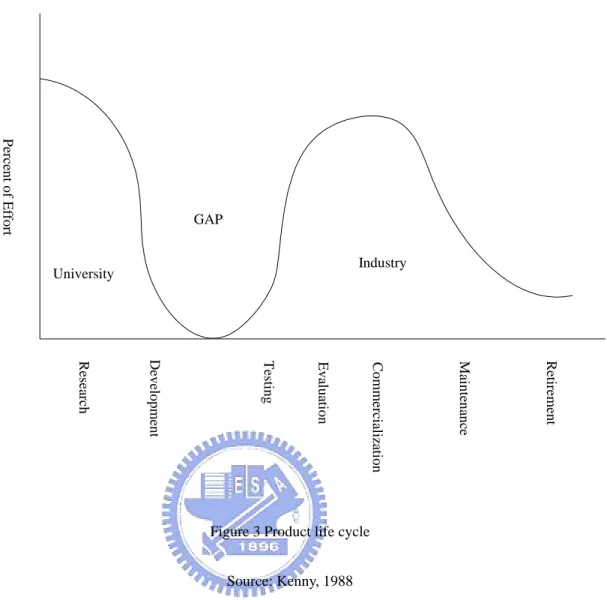
(23) The product life cycle has been depicted at Figure 3 (Kenny, 1988). This model can be applied to almost every mass-produce products. Typically, research expenditure at the beginning of the cycle is greatest. Universities are the most common sites for the research and development. At the testing, evaluation and commercialization phases, the industry has taken the responsibility to do. There are less and less time and money expenditures of industry toward the end of the product life cycle, as the phase maintenance and retirement. Form the figure 3, the gap between university and industry is clear to see. What needs to do is to incorporate with a technological push from universities and a marketing pull from industry. Universities are culturally, economically and technologically oriented departmental structure. As the joint of state and federal initiatives, the academic response could be the establishment of multidiscipline centers. The funding sources have instituted block grants that require close interaction among various university departments and colleges to encourage the establishment of multidiscipline centers.. 13.
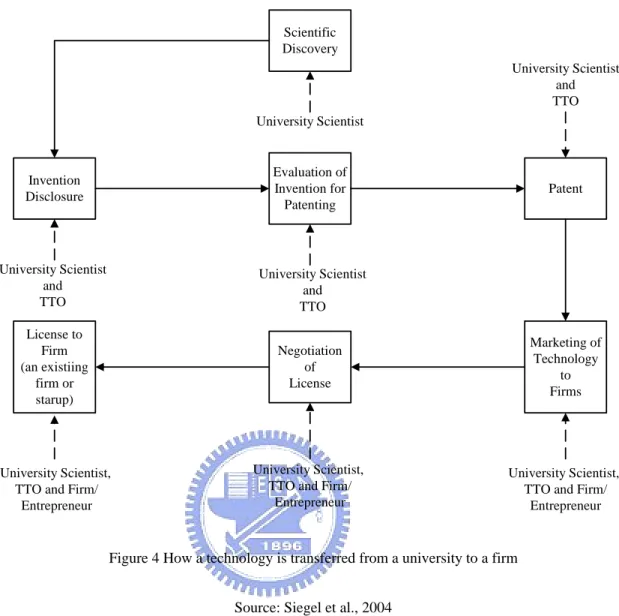
(24) Percent of Effort. GAP Industry. University. Retirement. Maintenance. Commercialization. Evaluation. Testing. Development. Research. Figure 3 Product life cycle Source: Kenny, 1988. The current trend is to recognize technology is the power as important as capital, labor and materials. From the international viewpoint, the strength of military has been changed to economic strength.. 2.4.3 How to Do Technology Transfer According to theory, there are several procedures of technology transfer process from the initial scientific discovery to the licensing to firms. It is regard as a continuous activity among university, TTO and firm. Figure 4 illustrates a series of the process which begins with the scientific discovery that refers to R&D results of researchers (Siegel et al., 2004). The dotted line means members are involved in the stage. 14.
(25) Scientific Discovery University Scientist and TTO University Scientist. Invention Disclosure. Evaluation of Invention for Patenting. University Scientist and TTO. University Scientist and TTO. License to Firm (an existiing firm or starup). Negotiation of License. Marketing of Technology to Firms. University Scientist, TTO and Firm/ Entrepreneur. University Scientist, TTO and Firm/ Entrepreneur. University Scientist, TTO and Firm/ Entrepreneur. Patent. Figure 4 How a technology is transferred from a university to a firm Source: Siegel et al., 2004. After discovering the scientific findings, disclosure the invention is the next step in order to evaluate for patenting or not. At this time, TTO begins involved in this activity and provided professional advice and suggestions for technical and legal consultation, TTO officials will help academic to decide which one is the mechanism to protect intellectual property. In other cases, the TTO must make a judgment regarding commercialization potential prior to interest being expressed by industry. The main job for TTO is the marketing and promotion of technology. Sometimes, faculty members can help identify potential corporate licensees; it is the reason why academics would involve in this stage. The potential licensees were found, the next motion is the negotiation with these members. The licensing agreement consisted of 15.
(26) several issues; this agreement could include such benefits to the university as royalties, licensing fee or an equity stake in a startup. At the final stage, the technology is converted into a commercialized product. The university may continue its involvement with the firm, for instance, by devoting resources to the maintenance of licensing agreements. Moreover, in the case of startups, faculty members may serve as technical advisors or on boards of directors, and may also have an equity stake in the startup.. 2.5 Terminology of Technology Transfer Technology accumulated knowledge, knowledge created technology. The accumulation of know-how is significant to high-tech development. Especially the Bayh-Dole Act and other advanced nations legislation effect, the Science and Technology fundamental Law asserted to release the ownership of the R&D achievement to the university. The R&D results could be transferred from university to industry (Donald et al., 2004). Universities receive the monetary reward and the industry gets the technology, it is the win-win approach to both university and industry. Technology transfer is the most popular way for university to do promote their research results. The following sections will be illustrated several definitions for the clear explanation: 2.5.1 Definition of Technology One approach to define technology is to derive the concept from the Greek root. The classical Greek origins of the technology are τεχηνε (‘techne’) and. λογοσ (‘logos’). The word τεχηνε can be interpreted as skills or technique. The word λογοσ can be interpreted as knowledge or science. Accordingly, technology can be viewed as knowledge of skills or techniques or a science of skills or techniques. Webster’s dictionary defined the word technology in several ways: 1. knowledge that deals with industrial arts, applied science or engineering; 2. terminology of art or 16.
(27) science; or 3. a technological process, invention, method or some of ways a social group provides themselves the material objects (Narayanan, 2001). Sharif and Ramanathan (1987) defined technology from the point of view of developing country oriented technology transfer research. They divided technology into four main components: ‘technoware’, ‘infoware’, ‘humanware’ and ‘orgaware’. ‘Technoware’ refers to technology substance. ‘Infoware’ means all information related technology. ‘Humanware’ refers to human resource. And ‘Orgaware’ means organizational culture. In defining technology, it is also important to identify various external factors which focus on the relationships between technology and the economy affecting technological development. The knowledge component of technology can be transferred through social interactions. This aspect makes it necessary to combine the component approach and the social approach to define technology. Technology comprises the ability to recognize technical problems, the ability to develop new concepts and tangible solutions to technical problems, and the ability to exploit the concepts and tangibles in an effective way ( Autio and Leamanen, 1995). Min Chen (1995) noted that the concept of technology and technology transfer has been defined in different ways and evaluated against a variety of criteria. In spite of these differences, many researchers and specialists tend to agree that technology can best be defined specifically as a new and more efficient way of achieving economic gains that facilitate or even revolutionize economic development. It is a process by which expertise and technological know-how could pass from owner to another user because of the economic benefits it could generate. 2.5.2 Definition of Technology Transfer A general definition of technology transfer can be constructed by taking a look at the Latin origins of the ‘transfer’. In Latin, trans means over, or across the border, and 17.
(28) ferre means to carry. The word trans suggests that during the process of carrying. Accordingly, technology transfer can be viewed as an active process, during which technology is carried across of two entities. These entities can be countries, companies, or even individuals. Most definitions of technology transfer did not take the time dimension into account. It is typical for the traditional definitions of technology transfer to regard technology as something which does not change during the transfer process. However, things could be changed over time, even the technology could. If the time dimension is not taken into account, many important technology transfer mechanisms are excluded from the range of possible technology transfer mechanisms. The interaction aspect needs to be emphasized in defining innovation-oriented technology transfer. In brief, the definition of technology transfer is intentional, goal-oriented interaction between two or more social entities (Autio and Leamanen, 1995). Hameri (1996) noted that technology transfer is an active and intentional process (it included licensing, foreign investments and buying motions) to spread or acquire knowledge, experience and the related works. Cutler (1991) pointed out that a series of steps to acquire and implement technology from outside is usually referred to as technology transfer. These steps consisted of recognition, evaluation, acquisition, enhancement, and implementation. 2.5.3 Definition of Technology Transfer Mechanism A definition for technology transfer mechanism can be based on the definition of technology transfer. Autio and Leamanen (1995) defined technology transfer mechanism as any specific form of interaction between two or more social entities during which technology is transferred. The range of technology transfer mechanism covers all possible forms of interaction during which technology transfer occurs. Kedia and Bhagat (1988) pointed out the process of technology transfer is 18.
(29) composed of the transfer of a systematically developed set of organized information, skills, rights and services from a supplier organization to a recipient organization. 2.5.4 Definition of Technology Transfer Channel The definition of technology transfer channel can be based on the definitions of technology transfer and technology transfer mechanism. However, Autio and Leamanen (1995) pointed out that the distinction between the technology transfer mechanism and the technology transfer channel is not always clear. Depending on the scope of view, some technology transfer channel can be viewed as technology transfer mechanism, and vice versa. From the point of view of technological development, technology transfer is often such an integrated activity that it is very difficult to distinguish transfer phenomena from the other phenomena under evaluation. The various technological development activities within the transfer process can be viewed as technology transfer channels or mechanisms. Their study classified technology transfer channels into three types: contract research, R&D consortia and spin-off companies. 2.5.5 Definition of Technology Transfer Approach According to Kedia and Bhagat (1988), there are basically three major approaches towards technology transfer. The first approach examines the process by which a technology is transferred, the types of technology that are likely to be absorbed more smoothly by recipients, and the continuing relationships of the two parties as contracted by initial negotiations. This approach tends to put an emphasis on process, for example, the way in which person-involved, product-involved and process-involved technologies are transferred. The second approach tends to concentrate on the absorptive capacities of the recipients. Absorptive capacity is often defined as a kind of perceived ‘fit’ between the supplier and the recipient. This usually refers to the ability of a recipient to operate the technology, to generate new productive capacity and to make technological innovations. 19.
(30) The third approach studies the effectiveness of transfer by looking at a whole range of factors, such as governmental policies, industry characteristics, technological maturity, technological sophistication of supplier and recipient organizations, cultural type, etc. It is worthy mentioned the success of technology transfer is unique to each case. Generally speaking, technology transfer can take various forms; including licensing or cross-licensing of patents and know-how, contribution of technology to non-equity and equity joint ventures and counter-trade.. 2.6 Key Factors of Technology Transfer Autio and Laamanen (1995) did the research about measurement and evaluation of technology transfer. They reviewed the mechanisms and indicators and classified indicators into three categories: inputs indicators, process indicators and outputs indicators. The input indicators precede the development phase; the process indicators focus on the development phase; and the outputs indicators focus on the results of the development phase. Baranson (1966) proposed the difficulties involved in international technology transfer are a function of: the quantum and complexity of the technology components; the engineering gap between transferor and transferee; the economic gap between advanced and developing countries; and the policy of economic autarky in force deny importing products to offset the domestic deficiencies. Davidson and Mcfetridge (1984) noted the determinants of the mode of technology transfer. They pointed out the newer, less widely used and no substituted technology and less experiences of technology transfer are likely burdened by high measurement costs, uncertainty and the need to make transaction-specific investments. The advantages of inner technology transfer will decline its costs for the outer technology transfer. The numbers of transfers are expected in the future will increase the amount of new 20.
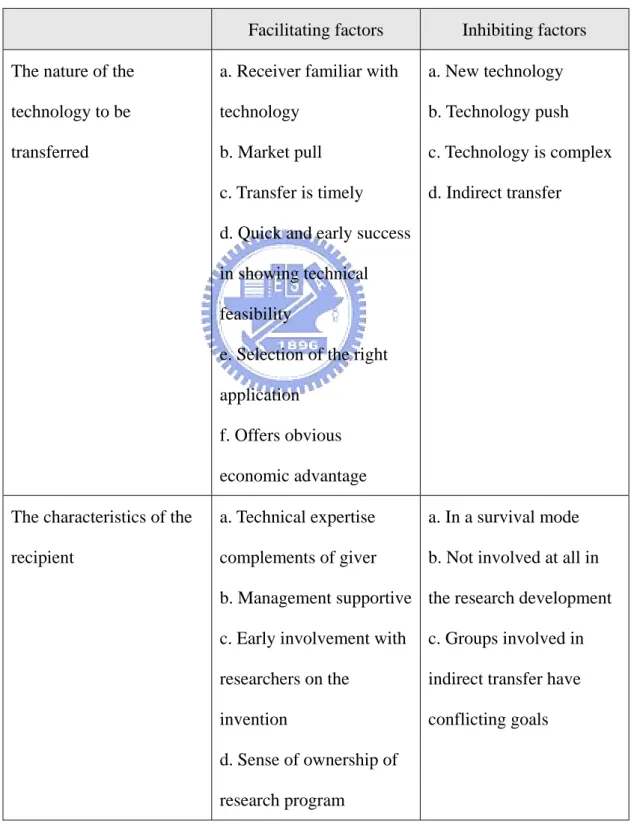
(31) invention that the transferor produced. Ounjian and Carne (1987) classified the factors that facilitate technology transfer and factors that inhibit it into four categories, table 1 put in it. Table 1 Factors that facilitate or inhibit technology transfer Source: Ounjian and Carne (1987). Facilitating factors. Inhibiting factors. The nature of the. a. Receiver familiar with. a. New technology. technology to be. technology. b. Technology push. transferred. b. Market pull. c. Technology is complex. c. Transfer is timely. d. Indirect transfer. d. Quick and early success in showing technical feasibility e. Selection of the right application f. Offers obvious economic advantage The characteristics of the. a. Technical expertise. a. In a survival mode. recipient. complements of giver. b. Not involved at all in. b. Management supportive the research development c. Early involvement with. c. Groups involved in. researchers on the. indirect transfer have. invention. conflicting goals. d. Sense of ownership of research program. 21.
(32) e. Adequate resources to receive and develop f. Willing to exchange staff to make transfer work g. Product champion h. Geographically or better culturally close to giver The characteristics of the. a. Management supportive a. More interested in. technology giver. b. Adequate resources to. research than in solving. research. business unit’s problems. c. Adequate resources to. b. Does not offer range of. transfer. technical options to. d. Provide adequate. receiver. documentation of results and/or training e. Willing to exchange staff to make transfer work f. Research champion The nature of the. a. History of positive. a. Lack of respect for each. communications between. relationships. other. the two organizations. b. Common goals. b. Responsibilities not. established. clear. 22.
(33) c. Sense of a team exists. c. Does not know. between giver and. customers’ needs. receiver. d. Potential benefits the technology offers are not understood. Madu (1989) pointed out the critical factors for successful technology transfer to developing countries. Table 2 is the summarized content. Table 2 Critical factors for successful technology transfer. Factors Needs and Objectives. Explanations The participants must identify the agreeable needs and objectives. The objectives have to be realistic and achievable.. Capabilities. Capabilities can be in terms of human resources, capital, natural resources, land and others.. Education, Training,. The appropriate education system will enhance the. Research and. capabilities to technology transfer.. Development Identification and. The core of technology transfer process is technology.. implementation of. Identified and implemented the appropriate technology. appropriate technology will promote the success. Management process. In order for the implementation of new technology to be effective, managers must be innovation-oriented. The dynamic organizational culture will enable innovators to implement change in an orderly manner.. 23.
(34) The role of public Stable foreign exchange and flexible joint venture policy policy. will enable the large foreign investments to be benefit to technology transfer.. Smilor and Gibson (1991) used in-depth interviews, archival, and survey data collected in the Microelectronics and Computer Technology Corporation (MCC), suggested that communication, distance, equivocalness and motivation are the four central to technology transfer processes within and between organizations. Therefore, the higher or more active the communication links, the more likely the chance of technology transfer. The more consortium researchers and personnel understand the values, attitudes and ways of doing things means the shorter is the distance, the greater the chance of technology transfer. Technology that is low in equivocalness means it is easy to be understood and demonstrated. The lower the level of equivocalness, the more likely the technology will be transferred. Motivation refers to incentives and recognition of the technology transfer. The greater the degree of incentives, the higher the motivation for those engaged in the process. Cutler (1991) pointed out several reasons exist for successful technology transfer from the Herrick Laboratories: a. Faculty and research staff are familiar with industrial needs. b. Have specialized facilities that do not exist in many laboratories. c. Monthly reports and regular meetings with industrial sponsors. d. A desire to increase productivity, reliability and world-wide competitiveness. e. An Industrial Advisory Committee which could help keeps the laboratories attuned to industry’s needs. f. An atmosphere of cooperation and synergy among the laboratories. Chen (1995) pointed out the technology transfer has been defined in different ways and evaluated against a variety of criteria. The effectiveness of transfer by looking at a whole range of factors, such as governmental policies, industry characteristics, technological maturity, technological sophistication of supplier and receiver 24.
(35) organizations, cultural constraints, etc. However, the success of technology transfer is unique to each case. Teece (1977) researched the costs of transferring technology from two categories: technology/transfer characteristics and, technology receiver and host country characteristics. The model he made is consisted of seven variables and one random error. Each variable will be illustrated as the following table: Technology/transfer characteristics. Receiver and host country characteristics. The number of previous applications or The number of years of manufacturing start-ups that the technology of the experience that the recipient of transfer transfer has undergone. has accumulated. The age of the technology in years. The ratio of R&D to sales for the recipient of the transfer The volume of sales of the recipient of the transfer The number of firms identified by the giver as having the identical and competitive technology The level of GNP per capita of the host country. 25.
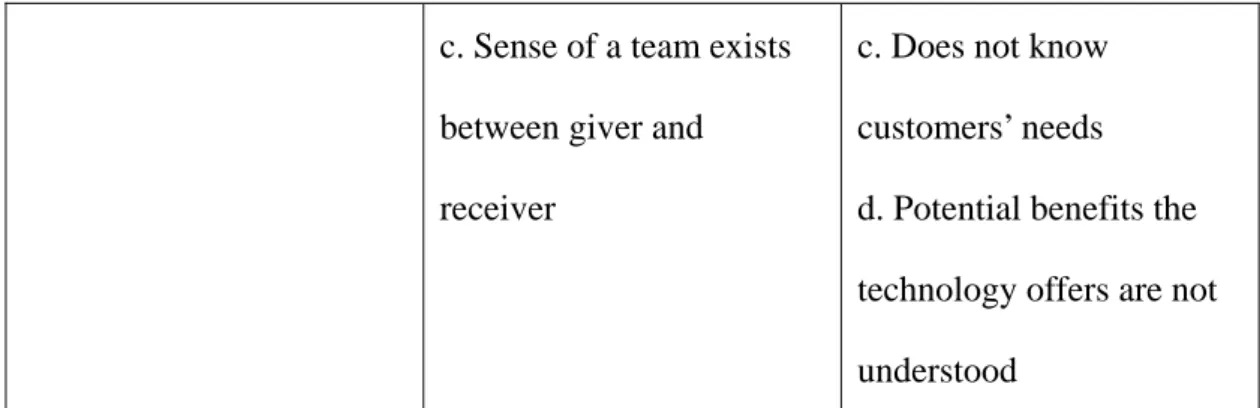
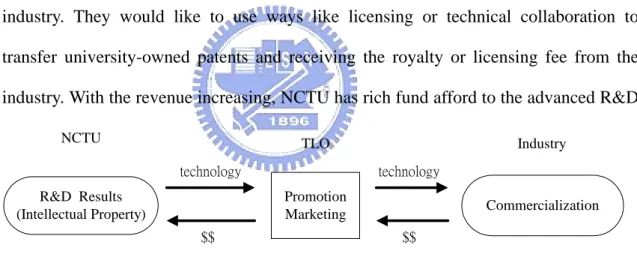
(36) CHAPTER 3 RESEARCH METHODOLOGY. 3.1 Research Issue and Framework The purpose of this study is to develop the effective IP marketing strategies for NCTU. As the limited resources of TLO are the critical factors to limit the success, new ways of working have to be developed. How to arrange these resources to promote R&D results that could save the time used and improve effectiveness is the purpose of this study. NCTU technology transferring process has been illustrated as figure 5. There are patent creations (or technology innovations) from the faculties in NCTU. Technology Licensing Office plays the role to promote these research results to the industry. They would like to use ways like licensing or technical collaboration to transfer university-owned patents and receiving the royalty or licensing fee from the industry. With the revenue increasing, NCTU has rich fund afford to the advanced R&D. NCTU. TLO technology. R&D Results (Intellectual Property). Industry technology. Promotion Marketing $$. Commercialization $$. Figure 5 NCTU technology transferring process. The result of data analysis is to prioritize the ranking of each indicator which affect the technology transfer. Figure 6 shows the process and structure of the methodology that begins with the research issue identification then methods of investigations through literature reviews. Experts’ opinions are the essential information of the survey design, sample selection and data collection. AHP is the core calculation approach to generate the rankings and weights of criteria in this study.. 26.
(37) Identify Research Issue. Literature Review. Methods of Investigations. Interviews and Survey Design. Sample Selection. AHP Approach. Data Collection. Consistency. Criteria Priority. Figure 6 The process and structure of the methodology. 27. Experts Opinions.
(38) 3.2 Research Method 3.2.1 Interview and Questionnaire The choice of research method is strongly depended on time, cost, and the purpose of research. Many choices of research methods can be classified based on how much knowledge is possessed in the problem area (Cox, et al. 1995). Experts’ opinions are very important to this study. It can be regarded as the core of this study. Because of all the samples are professional people and the questionnaire is different from the usual form. One by one face to face interview is the good way to ensure the validity and correctness (Kerlinger and Lee, 2000). The questionnaire form is attached at the appendix A and B, English version and Chinese version respectively. Before the interview, use phone call to contact these experts firstly. Through the short introduction let them know the purpose of this study and ask them to do the interviews. After making sure time and place, usually in their research room in university, the 20 to 30 minutes interview will be started. Within the face to face interview, explaining each criteria of this study is the essential step. The purpose of this procedure is to let them understand each meaning of criteria and eliminating the vagueness and ambiguity. If the respondent had any question, he or she can ask immediately. These steps can ensure each interview is correct and valid. 3.2.2 Algorithm This study is a multi-criteria problem. Decision makers could use several MCDM methods to solve this kind of issue. MCDM refers to Multi-Criteria Decision Making; it means the decision maker must consider all of the criteria that would affect his goal (Saaty, 1990). Infer to this study, the goal is how to transfer technology successfully, and the decision maker has to think about all criteria which could generate effectiveness.. 28.
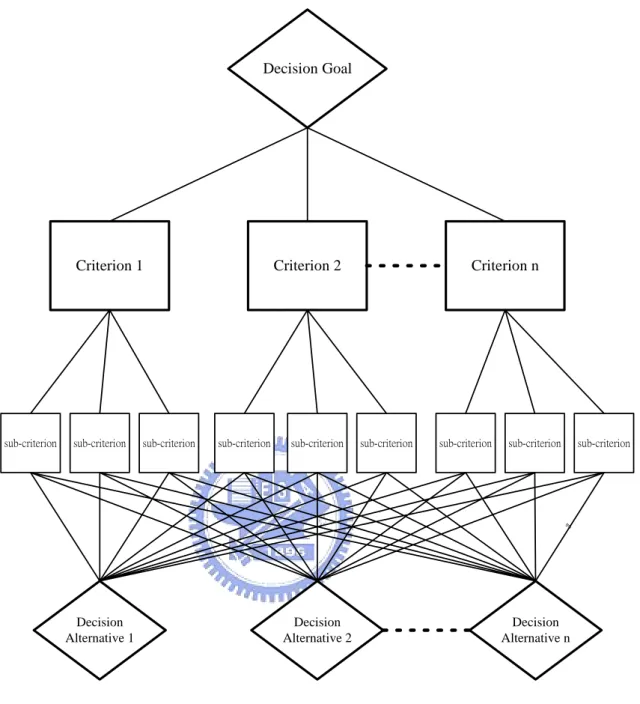
(39) The decision making process of human beings is very complicated. There are many factors of the single goal. Thus, the MCDM methods are more and more important to nowadays the world vary from minute to minute. AHP (Analytic Hierarchy Process) is one method of MCDM. Its core concept is the hierarchical analysis. A question more complex decision maker more needs the hierarchy structure the analysis. Hierarchy process could help decision makers analyze their problems systematically. The problem is divided into several hierarchies or levels, and decision makers could solve the problem step by step (Saaty, 1990). Figure 7 illustrated the structure of AHP. Decision goal is the mission that executives want to achieve or the problem they would like to solve. In order to simplify the problem, it is divided into several criteria. These criteria represent categories which affect the decision. They are classified according to the demand of executives. And the sub-criteria represent the detailed factors of the preceding level.. 29.
(40) Decision Goal. Criterion 1. sub-criterion. sub-criterion. sub-criterion. Criterion 2. sub-criterion. sub-criterion. Criterion n. sub-criterion. sub-criterion. sub-criterion. sub-criterion. g. Decision Alternative 1. Decision Alternative 2. Decision Alternative n. Figure 7 The structure of AHP Source: Saaty, 1990. AHP technique helps decision maker to calculate the weight of each criterion and sub-criterion, let the decision makers know which indicator is more important (or influential) than the other. It also means the most influential factor would be considered firstly when arranging resources (Saaty, 1990). Infer to this study, decision maker would understand which indicator is more influential and how influential to the successful technology transfer and put more resources to the important part of the 30.
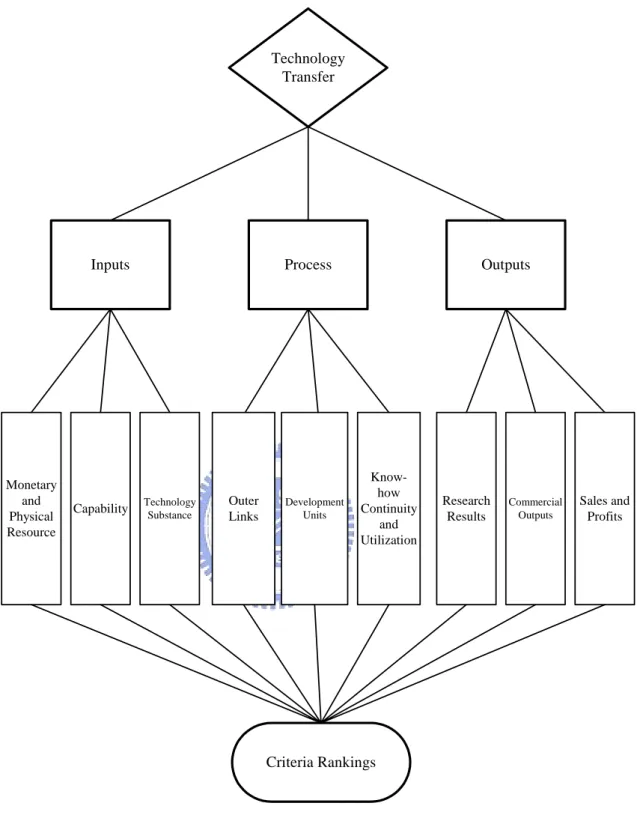
(41) whole process. Madu (1989) proposed several techniques for technology transfer; and AHP is one of these methods. It requires the priorities for the different technologies which are based on the experts’ judgments, and then the better alternative is selected according to this quantitative solution of these rankings. Survey is the effective and efficient method to collect data. Similarly, it also uses survey to get the pairwise comparison data of AHP approach in this study.. 3.3 Thesis Hierarchy According to the above illustrations, the hierarchy of this study is represented in figure 8, and figure 9 is the revised model which is clear for looking. It is derived from Autio and Laamanen’s reaearch (1995), who did literature reviews of technology transfer mechanisms and indicators and proposed a systematic structure of these indicators. Considering more specific identification of each criterion and sub-criterion, several identifications had been revised for this study. Table 3 illustrated the explanation of each criterion. The goal of this study is how to transfer technology successfully. Three criteria are represented as inputs, process and outputs respectively. And the sub-criteria are derived from these three categories respectively.. 31.
(42) Technology Transfer. Inputs. Monetary and Physical Resource. Capability. Process. Technology Substance. Outer Links. Development Units. Outputs. Knowhow Continuity and Utilization. Research Results. Criteria Rankings. Figure 8 Thesis hierarchy of AHP Revise of Autio and Laamanen’s model (1995). 32. Commercial Outputs. Sales and Profits.
(43) Monetary and Physical Resource. Inputs. Capability. Technology Substance. Outer Links. Technology Transfer. Process. Development Units. Know-how Continuity and Utilization. Research Results. Outputs. Commercial Outputs. Sales and Profits. Figure 9 The revised model of thesis hierarchy. 33.
(44) Table 3 Explanation of each criterion. Criteria. Sub-criteria Monetary and Physical Resource: refer to the R&D expenditures, the cost of applying patents, purchasing and maintenance of the facilities. Capability: refers to human resource, especially for R&D. Inputs engineers. Legal consultants and other administrative members are the secondary considerations. Technology Substance: refers to the type of technology, how innovative the technology is, related information and mechanism. Outer Links: refer to the resource utilization of outer organizations. For example, the resource of spin-offs and incubators. Development Process. Units:. refer. to. the. establishment. of. new. development or promotion unit inside organization to exploit the research results. Know-how Continuity and Utilization: refer to the transfer and utilization of development capabilities during the process of technology transfer. Research Results: refer to the ‘raw’, or pre-competitive outputs,. Outputs. for instance, articles published, reports submitted, the granted patents, number of licenses, etc. Commercial Outputs: refer to the commercialization outcome of the research results, such as royalties, new products or new processes.. 34.
(45) Sales and Profits: refer to the accumulation of financial and physical resources during the transfer process. For example, annual and cumulative sales and profits generated by the spin-offs, the amount of venture capital, etc.. 3.4 Calculations of AHP Step 1: Generate the hierarchy This thesis hierarchy of AHP was shown at figure 8 and figure 9 above. Step 2: Survey (nine-point scale) The nine-point scale is used for AHP pairwise comparisons. Pairwise comparisons refer to compare one by one to represent the preference (or importance) of judgments. Table 4 shows intensity of importance of AHP pairwise comparisons. It illustrates the meanings, definitions and detailed explanations for number 1 to 9.. Table 4 Intensity of importance of AHP pairwise comparisons Source: Saaty, 1990. Intensity of Definition. Explanation. importance Equally 1. Equal importance of both. Two elements contribute. elements. equally to the property Experience and judgment. Moderately. Weak importance of one slightly favor one element. 3. element over another over another Essential or strong. Experience and judgment. importance of one. strongly favor one. element over another. element over another. Strongly 5. 35.
(46) An element is strongly Demonstrated importance Very Strongly. favored and its dominance of one element over. 7. is demonstrated in another practice The evidence favoring one. Extremely Preferred 9. Absolute importance of. element over another is of. one element over another. the highest possible order of confirmation. Intermediate values Compromise is needed 2,4,6,8. between two near between two judgments judgments. Saaty(1990) proposed several reasons to illustrate why nine-point scale is used. First, the qualitative distinctions are meaningful when the items are compared with the same order of magnitude. Second, human ability to make qualitative distinctions is well represented by five attributes: equal, weak, strong, very strong, and absolute. When we need the greater precision, we can make compromises between two attributes, it means that is total nine attributes. Last, the psychological limit is suggested to be 7 ± 2 items in a simultaneous comparison. Thus, if the nine attributes are all slightly different from each other, then we need up to 9 points to distinguish these differences. Table 5 showed the form of AHP questionnaire. Here is the example for total three criteria are used to pair compare, and it is generated 3 pairwise comparisons. If the expert regards the inputs criteria as weak important than process criteria, he will make a mark at the left side 3:1 box, and so on.. 36.
(47) Table 5 The form of AHP questionnaire Source: Saaty, 1990 Prefer the left criteria than right 9. 8. 7. 6. 5. 4. 3. 2. Prefer the right criteria than left 1. 1. 1. 1. 1. 1. 1. 1. 1 Criteria. Criteria :. :. :. :. :. :. :. :. :. :. :. :. :. :. :. :. :. 1. 1. 1. 1. 1. 1. 1. 1. 1. 2. 3. 4. 5. 6. 7. 8. 9. Inputs. Process. Inputs. Outputs. Process. Outputs. The original AHP nine-point scale questionnaire is difficult to answer for respondents. That is because the ratio is easy to confuse people; it means respondents are not easily to distinguish the slight difference between 2 items; the difference is usually not up to 7:1 even 9:1. Based on the above reasons, the questionnaire is modified to the following pattern to clear and easy to answer for respondents; in addition, it does not lose the nine-point scale meaning. Table 6 shows the importance ratio for inputs: process: outputs are 4:7:9, in the other word, outputs is 9/7 times important to process and is 9/4 times important to inputs. This modified table is not only easy to answer for respondents but also clear to calculate the pair comparison for researcher.. 37.
(48) Table 6 The modified nine-point scale comparisons. Criterion. Importance (bigger number, more important). Inputs. 1. 2. 3. 4. 5. 6. 7. 8. 9. Process. 1. 2. 3. 4. 5. 6. 7. 8. 9. Outputs. 1. 2. 3. 4. 5. 6. 7. 8. 9. Step 3: Show the results of pairwise comparisons as a matrix. According to table 6, pairwise comparison of three criteria is finished. The positive reciprocal matrix is used to represent the results. Positive reciprocal matrix refers to the element a ji is the reciprocal value of the element aij ; a ji =. 1 . Figure 10 shows aij. the matrix of table 6.. Inputs Pr ocess Outputs Inputs 1 4/7 4/9 Pr ocess 7 / 4 1 7/9 Outputs 9 / 4 9/7 1 Figure 10 Matrix form of 3 × 3 comparisons. Step 4: Calculate the eigenvalue ( λ max ), CI, CR. Use MATLAB to calculate the eigenvalue of matrix is efficient. CI and CR are two indexes to measure the consistency of experts’ judgments, for example, as the logic A > B, B > C, then A > C. CI (Consistency Index) =. λ max − m m −1. , λmax refers to the biggest. eigenvalue of the matrix; m refers to the numbers of criteria. CR (Consistency Ratio) = CI / RI, RI (Random Index) refers to the consistency index of a randomly generated reciprocal matrix form the 1 to 9. Table 7 shows the RI range from Saaty’s book. The lower case n refers to n × n matrix form. In this study, it infer to 3 × 3 matrix form. CR equal or less to 0.1 is considered acceptable (Saaty, 1990). 38.
(49) Table 7 The mean consistency index of randomly generated matrices Source: Saaty, 1990. The Mean Consistency Index of Randomly Generated Matrices n. 1. 2. 3. 4. 5. 6. 7. 8. 9. 10. 11. 12. 13. 14. 15. RI. 0.00. 0.00. 0.58. 0.90. 1.12. 1.24. 1.32. 1.41. 1.45. 1.49. 1.51. 1.48. 1.56. 1.57. 1.59. Step 5: Calculate the weights. Weights are calculated by using EXCEL; it is also could be verified by the software named “Expert Choice”, which could calculate both weights and consistency index. The results have integrated several experts’ judgments; it also means there is one matrix at the end of calculation. This matrix represents the integrated weights of experts. Geometric Mean (GM) is used to represent the entries of the last matrix. The following table showed the information about calculating weights. Aij refers to the ratio of criterion i and criterion j of integrated all experts’ judgments. s. Aij = ∏ aij s. t =1. ,. t = 1 ~ s , t refers to the numbers of experts; in this case, s. = 18 persons. m. GM n = m ∏ Ani i =1. ,. n = 1 ~ m , n refers to the numbers of criteria; in this. case, n = 3 criteria. 3. SGM =. ∑ GM n =1. n. The last column, Weight, which is normalized for the sum of Wn is 1. Wn refers to the weight of criterion n.. 39.
(50) Criterion. Criterion 1. Criterion 2. Criterion 3. GM. Weight. Criterion 1. A11. A12. A13. GM1. W1=GM1/SGM. Criterion 2. A21. A22. A23. GM2. W2=GM2/SGM. Criterion 3. A31. A32. A33. GM3. W3=GM3/SGM. SGM. 1. SUM. 3.5 Sample Selection According to Lin (2003), in common, 10 to 15 persons were selected for the experts investigated. The expert questionnaire is used for this study. The respondent called as expert means he or she is familiar with technology transfer and the mechanism of university. The faculties or researchers, technical and legal consultants of TLO and Incubator are the samples of this thesis. It is because these members will provide opinions from the university aspect. The most of faculties and researchers are from NCTU; this is representative because NCTU is one of the best research universities in Taiwan. It is located near the Hsin Chu Science Park, has both plenty of physical and software resources. The most important reason for choosing NCTU as a base of evaluation is the variety of research results and experiences of technology transfer. 3.5.1 Data Collection. Both of qualitative and quantitative data are important to decision making. Qualitative data consist of words which provide the whole view of issue. Quantitative data consist of numbers which could be calculated with mathematic approach. Quantitative data are clearer than qualitative data because it is understood easily. Formulas and calculation steps could be used to make people understand each characteristic of variable.. 40.
(51) 3.5.2 Pre-test. There are two purposes of pre-test. First, it is used to test the validity and reliability. Second, is also the purpose of this pre-test, to reduce the ambiguity and vagueness of the description of questionnaire. The experts’ opinions are used in this study. Before asking for experts’ opinions, several related person who are found to be the pre-test samples because finding results is not the purpose of pre-test in this thesis. The pre-test is conducted by two TLO members consist of one legal consultant and one technical consultant, one former patent engineer who is a master major in technology management, one PHD student who’s major in EE and one master student is also major in EE. After pre-test, the questionnaire is modified to be clear and easy to answer.. 41.
(52) CHAPTER 4 RESEARCH RESULTS. 4.1 Background of Respondents There are eighteen respondents of the questionnaire; some of them not only offered the quantitative data but also the qualitative response. The main respondents are from NCTU except for one person who is the manager of IP at NTHU. Our faculties or researchers are more than a half of samples, counted as 10, consisted of seven from Institution of EE, one from the Institution of Engineering, two belong the Institution of Management. Figure 11 is the bar chart of workplace status. There are seven TLO members; they are samples most understanding about technology transfer process. One person belongs to “others” is the Project Manager of Incubator. Workplace of Respondents 7. numbers. 8. 7. 6 4. 2. 1. 2. 1. 0 EE. Engineering. Manage. TLO. others. Workplace. EE:. Institution of Electronic and Engineering. Engineering:. Institution of Engineering. Manage:. Institution of Management. TLO:. Technology Licensing Office. Others:. Incubator of NCTU. 42.
(53) Figure 11 Bar chart of respondents’ workplace. Figure 12 is the bar chart of respondents’ title status. It consisted of researchers, technical consultants, legal consultants IP manager, and administrative officials who are classified in others. Researchers are the maximum of respondents because they research and develop the raw materials for technology transfer. These research results are the essential materials to the whole process of technology transfer. These people provided the different aspects of technology transfer from TLO officials. And this is the essential content will be shown in this study. It also means these opinions could be constructed as a synthetic view of this thesis. Respondents' Title 9. 10 numbers. 8 5. 6 4. 2. 2. LegalCon. others. 2 0 Research. TechCon Title. Research:. Researchers (or faculties). TechCon:. Technological Consultant. LegalCon:. Legal Consultant. Others:. One IP manager, one financial official. Figure 12 Bar chart of respondents’ title. 43.
(54) Figure 13 shows the status of respondents’ seniority. On average, researchers have more seniority than TLO members, this result can be understood that is because they have done research many years since they are faculties. And one research result has been cost several years until it has been finished. The status of TLO members and faculties are shown at table 8 and 9 respectively to figure out the differences between them. Basically, the experts of this study are chosen with the rule of experience for technology transfer. Only two samples had not experienced at technology transfer. One is the administrative official of TLO. She is responsible for the financial and administrative matters in the office. Although she chose had not experienced at technology transfer, she understands the process of technology transfer is the fact. That is the reason to add her opinions into this study. In table 8, TT means the experience of technology transfer. The question was asked to respondents is: “Have you ever had experience of technology transfer?” This question is used to ensure the experts understand technology transfer and they did it before. The other one chose no experience of technology transfer is the vice-president, Mr. Chen, of NCTU. This is the unique sample. He is the vice-president, understands the procedure of university. He had more than 16 year’s seniority at his research and he is willing to provide suggestions, so his opinion is added into this study.. 44.
(55) Seniority of Respondents 7. numbers. 8. 5. 6 3. 3. 6~10y. 11~15y. 4 2 0 1~5y. 16andMore. Seniority. Figure 13 Bar chart of respondents’ seniority. Table 8 Information of TLO members. Technical. Legal. Title. Others. SUM. 2. 8. Consultant Consultant 4. 2. Seniority 1~5years 6~10years. TT. 7. 1. Yes. No. 7. 1. 45. 8. 8.
數據
+7
相關文件
This kind of algorithm has also been a powerful tool for solving many other optimization problems, including symmetric cone complementarity problems [15, 16, 20–22], symmetric
• About 14% of jobs in OECD countries participating in Survey of Adult Skills (PIAAC) are highly automatable (i.e., probability of automation of over 70%). ..
By University students of the Chung Hua University for objects, to make use of the descriptive statistics, the reliability analysis, and the factor analysis, considers the
The purposes of this research are to find the factors of raising pets and to study whether the gender, age, identity, marital status, children status, educational level and
To improve the operating performance, the companies should pay attention to critical success factors of “support and participation of employees”, “employee training and
This study therefore aimed at Key Success Factors for Taiwan's Fiber Active components Industry initiative cases analysis to explore in order to provide for enterprises and
This study focuses on the need of walking to school for middle-grades students and designs related teaching plans.This study firstly conducts a questionnaire
For the next nitrogen delivery system, In this study, the high-tech industry, nitrogen supply, for example, to explore in depth the relationship between
