1
TAO, Y.-H., THE GENERALIZATION AND SPECIALIZATION OFTECHNOLOGYACCEPTANCE
MODEL, 14THANNUALMEETING OFASIAPACIFICREGION OFDECISIONSCIENCESINSTITUTE, SHANGHAI, JULY4-8, 2009.
The Generalization and Specialization of Technology Acceptance Model
Yu-Hui Tao
National University of Kaohsiung Taiwan, R.O.C.
ABSTRACT
Although recent meta analyses of Technology Acceptance Model (TAM) have appeared in the literature, practitioners, students and unseasoned scholars may still encounter difficulties in applying this TAM++ knowledge to real-world technology implementations, or rationalizing TAM++ for possible theory development or in-depth investigation. Therefore, this research addresses the issues by generalizing TAM++ into a higher-level formalism for ease of understanding, as well as for developing a tool to enable an interactive aggregation of the empirical TAM studies for customized meta analyses.
Keywords: technology acceptance model, formalism, abstraction, specialization INTRODUCTION
Since its first appearance in 1989, the Technology Acceptance Model (TAM) has been cited 700++ times (Davis, 2007) in journal articles. While it is popular in IS/IT research and practice, it has grown to a certain point where more TAM studies may only provide marginal increment and may even diminish its original contribution and role in the IS/IT field (Straub and Burton-Jones, 2007; Benbasat and Barki, 2007). In recent years, some quantitative meta analyses of TAM began to appear in the literature (Ma and Liu, 2004; King and He, 2006). While these meta analyses came out strong in supporting the original two components of usefulness and ease of use, practitioners still remained in a quandary in interpreting TAM for technology implementation in industry, culture, domain, and regions. Straub and Burton-Jones (2007) concluded that no one has yet conducted a comprehensive meta-analysis that accounts for all of TAM relationships, associated external variables, and moderating factors.
Orlikowaski and Iacono (2001) classified papers in Information Systems Research into five clusters, each with different conceptualizations of technology. The proxy-view cluster containing perception, diffusion and capital conceptualizations was criticized as undertaking a risk that the proxy is ambiguous with what is intended to be represented or measured. Specifically, this type of study requires more careful theorizing about the differences in IT artifacts and their role and function in different contexts and over time, Thus, there is a need for communicating these results for researchers to quickly understand and apply TAM++ in their own studies.
This study first addresses the issue of the confusing and sometimes conflicting TAM studies by abstracting the TAM into a mathematical formalism easily understood by the audience who may be new or inexperienced in this domain. Meanwhile, unlike the existing static meta-analyses that has collected a certain number of studies studying relationships via quantitative methods, this study proposes a dynamic meta-analysis environment for users to explore the relationships of TAM variables under different parameters.
TAM FORMALIZATION
From the assumption of this study, we know that the set-theory based mathematical expression can be more accurately enhanced by text semantics expression. In addition to thesetF’containing TAM constructs,anothersetP’isalso needed forrepresenting the path relationship between two elements in F’.Forinstance,therelationship between any two elements fi and fjin set F is the elements of set P.
The abstract concept of TAM formulism is shown in Figure 1. In theory, there exists a comprehensive but unknown TAM factor set F and its corresponding path relationship set P, and the empirically inferred TAM factor set F’and path relationship P’. Assuming F can be represented as a collection of factors influencing technology acceptance F = {fi, where fi denotes any theoretically TAM related factor and i a positive integer set}. When any assumed TAM research model obtains an empirical result, it merely reflects a subset of F and the relationships of any two factors that present a significant path casual consequence. Therefore, by retrieving the factors collected from the existing TAM related empirical research literature, there exists a set F’, which can be assumed to be the most representative set for the unknown F as defined by F’= {f’i, where f’idenotes any TAM related factor found in any TAM study and ipositive integer set}。
F F’
P P’
F : theoretical TAM Factor set F’:empiricalTAM Factorset P : theoretical TAM Path set P’:empiricalTAM Factorset
Figure 1 Concept of TAM formulism
Meanwhile, with the set F and TAM model, there also exists a theoretical set P containing all the path relationships in the TAM model, where P = {fi fj, which denotes fi influences fj, and fi, fjF}. Similar to the existence of F’, set P’represents the empirical path relationship from the literature, such as the consequence of any two elements of f’i and f’j in F’as denoted by pij. The set P’is defined by P’= {f’i f’j, which denotes f’i influence f’j, and f’i, f’jF’}.
In the TAM research models, there usually exist some moderating variables that influence certain relationships of paired variables, which can be represented by set M and M’, as follows: M = {mi, where mi denotes any theoretically TAM related factor that influences
Twenty Eighth International Conference on Information Systems, Montreal 2007 3
one or more relationships in P, where ipositive integer set} and M’= { m’i, where m’i denotes any empirically TAM related factor that influences one or more relationships in P’, where ipositive integer set}. Since M and M’are collections of variables, it can be considered as part of F and F’without further distinguishing in Figure 1, and in the following discussion of this paper.
Based on the concept of enumeration, if we can collect major academic research results, sets F’and P’may approximate the theoretical sets F and P. In other words, F’F and P’ F, and when the TAM research studies have accumulated to a certain critical volume, F’ F and P’P . Although this critical volume is unknown and may also depend on the context of research studies, this is a feasible approach to approximate the theoretical unknown sets F and P.
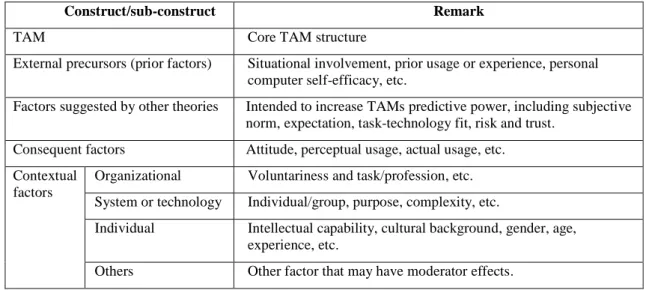
Table 1 Categories of TAM formalism
Construct/sub-construct Remark
TAM Core TAM structure
External precursors (prior factors) Situational involvement, prior usage or experience, personal computer self-efficacy, etc.
Factors suggested by other theories Intended to increase TAMs predictive power, including subjective norm, expectation, task-technology fit, risk and trust.
Consequent factors Attitude, perceptual usage, actual usage, etc. Organizational Voluntariness and task/profession, etc. System or technology Individual/group, purpose, complexity, etc.
Individual Intellectual capability, cultural background, gender, age, experience, etc.
Contextual factors
Others Other factor that may have moderator effects.
TAM has its basic structure, but some meta analyses have tried to generalize the components of the TAM structure to conduct more generalized analyses and interpretations. Much of the meta-analyses, such as Ma and Liu (2004), have a similar conceptual model as specific as the original TAM model (Davis, 1989). King and He (2006) proposed a TAM component structure that is closed to the objective of this study. Their model dissects TAM into core TAM and four other categories, where category 1 contains prior factors to the TAM component, category 2 contains factors suggested from other theories, category 3 contains contextual factors to the TAM component, and consequent factors such as attitude, perceptual usage and actual usage. The contextual factors can further be classified into subcategories, such as what Sun and Zhang (2006) did, including organizational factors, system or technology factors, individual factors, and other factors. The combined details and definition of the TAM categories and sub categories are explained in Table 1. The path model of Table 1 constructs a graphical representation of the above mathematical formalism.
DESIGN OF DYNAMIC TAM SPECIALIZATION
To bridge the higher-level understanding of the mathematical formalism to future TAM-related research, an interactive meta-analysis based on an ad-hoc query is critically important. In other words, the paradigm shift of a higher-level TAM mathematical formalism can prevent researchers from being confused by the diverse results of TAM++ empirical studies. Nonetheless, to further conduct TAM studies, researchers still need a convenient tool to analyze past TAM studies to connect to the design of future TAM studies. This section describes the design and implementation of such an interactive tool for an on-demand basis of specialized representation of the above TAM mathematical formalism.
The initial targeted paper collection is based on the following TAM meta analyses: King and He (2006) screened 140 papers from the social science citation index (SSCI) in the fall of 2004 and the Business Source Premier (EBSCO Host database) from 22 journals, which are empirical studies with direct statistical tests of TAM. These papers have data for correlations, path coefficients and possible multiple effects. Sun and Zhang (2006) systematically selected 55 published papers from the primary IS journals and databases such as ABI/INFORM, WilsonSelect, JSTOR and ACM Digital Library, and SSCI articles from January 1986 to September 2003. Similar to King and He (2006), these papers contain empirical studies for further meta-analysis.
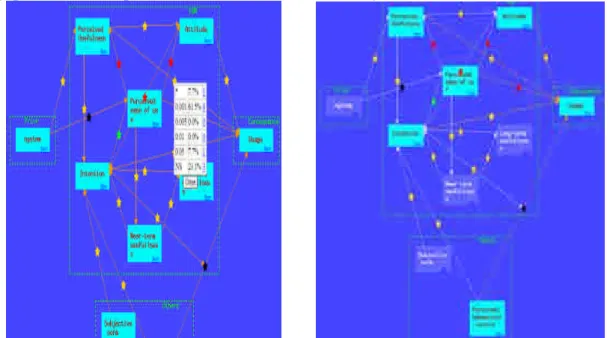
Figure 2 TAM graphical formulism with popup window (left) & highlighted relationships (right).
Due to the limitations of space, only a few screenshots helpful in illustrating the important features of this research are captured and explained next. The graphical TAM formalism is as shown in Figure 2, which is based on Table 1. Only the contextual factors are not shown on top of the figure due to a technical issue. There is a need to automatically display the unknown numbers of contextual factors from the many related TAM studies, which has an easy resolution by popping up a new window to display as
Twenty Eighth International Conference on Information Systems, Montreal 2007 5
many subcategories as possible. The different colors of the star icons represent different significant statistical levels, i.e., yellow, red, green and black for above 75%, above 50%, above 25% and under 25% significance in collected research studies. Different from calculating the joint correlation in these quantitative meta analyses, this study uses percentages to help the user roughly gauge the range of significant relationships in the TAM formalism. To further view the distribution of the significant levels, the user can click the start shape for a small popup window containing the significant levels of *(significant but unknown level), 0.001, 0.005, 0.01, 0.05, 0.01 and NS (not significant) and their corresponding percentages and number of studies shown on the left side of Figure 2. When a user clicks any of the number of studies in the popup window, a large popup window displays the listed references from the database. If the variables are too many to be clearly seen from the screen, the user can click the small link indicated by “show”at the right bottom location of each variable box. The screen changes to highlight only the selected variable and its relationships with other variables, as seen on the right side of Figure 2; the usage variable in the consequence category on the right hand side and related variables and the relationships stand out from the whole graph.
CONCLUSION AND FUTURE WORK
This study is in the belief that the mathematical formalism, including Figure 1, the graphical representation of TAM constructs in Table 1, and the corresponding definitions and explanations, will help practitioners, graduate students and unfamiliar scholars to grasp the high-level understanding of TAM++ studies. Furthermore, although the criteria setting function and its screen shot are not shown due to space limitations. The above illustration of the graphical TAM formalism tool should be clear to see that through such an interactive TAM graphical formalism, such that a user can easily build his or her own mental model by bringing out a specialized TAM graphical formalism matching the given criteria. The next step is to complete the input of all the empirical studies from the listed data sources, and then conducting an unconventional visual meta analyses such that some insightful observations not easily seen from the quantitative meta analyses may come out. More importantly, any interested user can do the customized TAM meta analyses though this interactive tool alone with the understanding of the TAM mathematical formalism.
REFERENCES
Davis, F. D. (1989), Perceived usefulness, perceived ease of use, & user acceptance of information technology, MIS Quarterly, 13(3), 319-339.
Davis, F. D., Bagozzi, R. P. & Warshaw, P. R. (1989), User acceptance of computer technology: A comparison of two theoretical models, Management Science, 35(8), 982-1002.
Davis, F. D. (2007). User acceptance of information technology: research progress, current controversies, and emerging paradigms, Keynote Speech at the 7th International Conference of Electronic Commerce, December 2-6, The Grand Hotel, Taipei, Taiwan, R.O.C.
King, R. R. and He, J. (2007), A meta-analysis of the technology acceptance model, Information & Management, 43, 740-755.
empirical findings, Journal of Organizational and End User Computing, 16(1), 59-72. Straub Jr., D. W. and Burton-Jones, A., Veni, vidi, vici: Breaking the TAM logjam, Journal of the Association for Information Systems, 8(4), 2007, 223-229.