行政院國家科學委員會專題研究計畫 成果報告
知識創新之研究:探討組織知識文化與Goal-free、Goal-driven
創新模式之關聯
個別型計畫-計畫編號:
NSC 96-2416-H-390 -005執行期間:96 年 8 月 1 日至 97 年 7 月 31 日
主
持
人:吳建興
國立高雄大學資訊管理學系
AbstractThis research project conducted an empirical investigation to disclose impact of knowledge creation mode and organizational culture on knowledge creation performance, based on the survey of 153 manufacturing companies having received at least 20 patents in the previous 10 years (1997-2006), There were research results indicating that (1) both goal-free and goal-framed creation modes are more likely to support knowledge creation, (2) the goal-driven mode is not likely favorable for knowledge creation, (3) manufacturing companies who are looking frequently for new ideas for product design and manufacturing technologies are more likely to adopt the goal-free creation mode, (4) adhocracy culture is more likely a predicator of product and manufacturing creation, and (5) manufacturing companies with a single or multiple culture types are more likely to adopt the goal-framed creation mode. Discussion and implications are also presented.
Keywords: Knowledge creation, goal-driven mode, goal-free mode, organizational culture
Introduction
Over the past few years, knowledge management (KM) has become one of the most important organizational strategies. It has been widely studied with various topics, such as what type of creation mechanism an organization should adopt to set up KM, what characteristics an organization culture should have to better help deliver KM programs, and how should information and communication technology be utilized to ease KM implementation? With respect to knowledge creation performance, whether or not a goal is defined may have a substantial impact on the final achievements. For example, idea generation about product design may be affected by the creation mode (a goal has been pre-defined or not pre-defined). In addition, studies have shown that organizational culture could have an impact on the performance of knowledge creation (Tushman and O'Reilly 1997; Mauriel et al. 2000; Martins and Terblanche 2003; Chou and Wang 2003). In general, the nature of organizational culture tends to lead to regulative behaviors that individuals or groups should obey. It can form regulations and behaviors an organization approves of, such as organizational structure formulation, idea generation, policy establishment, procedural controls, and management practices. It is believed that a specific characteristic of organizational culture could be formulating a creation mode that would then influence how creation is performed.
creation performance? If so, which mode is better: goal-free, goal-driven,orothers?” and “Will a specific organizational culture type affect the implementation of knowledgecreation mode? Ifso,which typehasastrongeraffinity forwhich mode?” Therefore, the main concern in the current research is that there would be connections among organizational culture, knowledge creation mode, and knowledge creation performance. Furthermore, there has been an increasing need of knowledge creation in high-tech manufacturing industry. Therefore, by focusing on companies that have received at least 20 patents in the previous 10 years (1997-2006), this current research statistically examines (a) the relationship between organizational culture and knowledge creation mode, (b) the relationship between organizational culture and knowledge creation performance, and (c) the relationship between knowledge creation mode and knowledge creation performance.
Literature Review
Generally, an organizational culture can be a critical factor in the way members of an organization behave (Tushman and O'Reilly 1997; Syrett and Lammiman 1997). By learning and socialization through the interaction of multiple elements, a culture can be formed. Van Maanen and Schein (1979) indicated that organizational culture is a common value, a belief, or a perspective model shared by members of organization. It resultsin socialregulationsthatmay explicitly shapeorcontrolmembers’behavior, or even the way they think of things. Therefore, the cultural characteristics can be identified first by the phenomena that an organization presents, secondly by the value driven by the organizational strategy, and thirdly by the deepest belief, thought, and feeling that an organization creates (Schein 1984; DiBella 1996). Thus, the characteristics of organizational culture may influence both the employee’screative behaviorand theorganization’screativepolicy,and then on thecreation performance. Knowledge creation is basically a process that produces new knowledge by accumulating and integrating existing knowledge. Nonaka (1994) introduced a knowledge creation model, indicating that organizational knowledge creation is derived by the transformation from tacit knowledge to explicit knowledge. By doing so, tacit and explicit knowledge can be concurrently enhanced in both quantity and quality. In support of this, Yeh (2004) argued that knowledge creation is not only a process of knowledge stimulation, but a model for deriving behavior that results from existing knowledge. Therefore, knowledge creation is not only the changes of knowledge gradients, but also the new activities and behaviors derived by combining existing knowledge or by learning new knowledge. Accordingly, there are two main modes on which knowledge creation can rely, including goal-driven and goal-free. The goal-driven mode focuses primarily on knowledge of the goals, persons, and/or products. Scriven (1977) indicated that the goal-driven mode has the following features: (1) does not question the merit of goals, (2) often does not look at cost-effectiveness, (3) often fails to search for or locate the appropriate critical competitor, (4) often does not search for side-effects, and (5) often does not include a number of important and necessary components of an evaluation. However, even it does include these features, they are based on the program (or personal) goals, and there are further tasks that need to be done, such as identifying these goals, handling inconsistencies between them and their changes over time, dealing with shortfall and overrun results and avoiding the perceptual bias of knowing about them. For example, a product manager may propose a goal as “improving the front faceplate of cell
phones,”which clearly indicatesthattheproductmanagerwantsto elicitideasforthis. According to Scriven (1977), from the evaluation viewpoint a goal-free technique should not be told about the purpose of the program but directly enters into the evaluation with the purpose of finding out what the program actually is doing, without detailed cues as to what it is trying to do. Furthermore, if the program is performing according to the stated goals and it follows the objective(s), then these achievements should appear; if not, it is argued, they are irrelevant. Patton (1987) indicated that the goal-free technique requires the evaluator to suspend judgment on what the program is trying to do, and instead to focus on trying to find what is happening in the program at the moment. Therefore, there are two aspects that need to be carefully considered when adopting the goal-free technique: (1) the evaluator has to investigate the consequence for any proposed alternative, such as the stakeholders and their impacts (James and Roffe, 2000), and (2) the evaluator has to create multidimensional requirements (Scriven, 1977).
Method
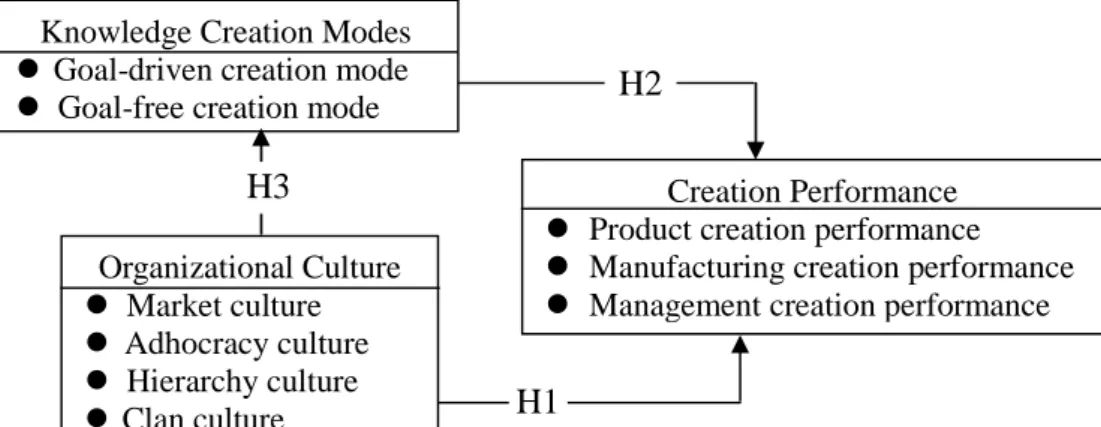
The conceptual model for the research problem is illustrated in Figure 1. It contains three components: (1) knowledge creation modes (KCM), (2) organizational culture (OC), and (3) creation performance (CP). The independent variable, OC, is described by four types: market, adhocracy, hierarchy, and clan; while the dependent variable, CP, is by product, manufacturing (process), and management. Another variable, KCM, is described by goal-free mode and goal-driven mode. Connections between OC and KCM are also shown to indicate which culture type has stronger impacts on which mode of knowledge creation. The current research targeted the population of the industries who could show better creation performance. The reason for doing so is because these companies may have relevant experience on the creation of products, processes, and management. This study then selected the manufacturing industry as the sample population. To derive the sample size, this study considered the first 5000 companies, ranked by total sales, as collected by China Credit Information Service, Taiwan (2006). Moreover, in order to select samples that were relatively knowledgeable about knowledge creation, only those having at least 20 patents in the previous 10 years (1997-2006) were chosen, according to data from the Asia Pacific Intellectual Property Association (2007). There were 2611 companies for the manufacturing industry in the database. Of these, 423 were qualified to be our subjects.Ofthe423 questionnairesmailed to company’sadministrativeoffice,atotal of 181 were returned after four weeks, of which 153 were valid, indicating a 36.17% valid response rate.
Results
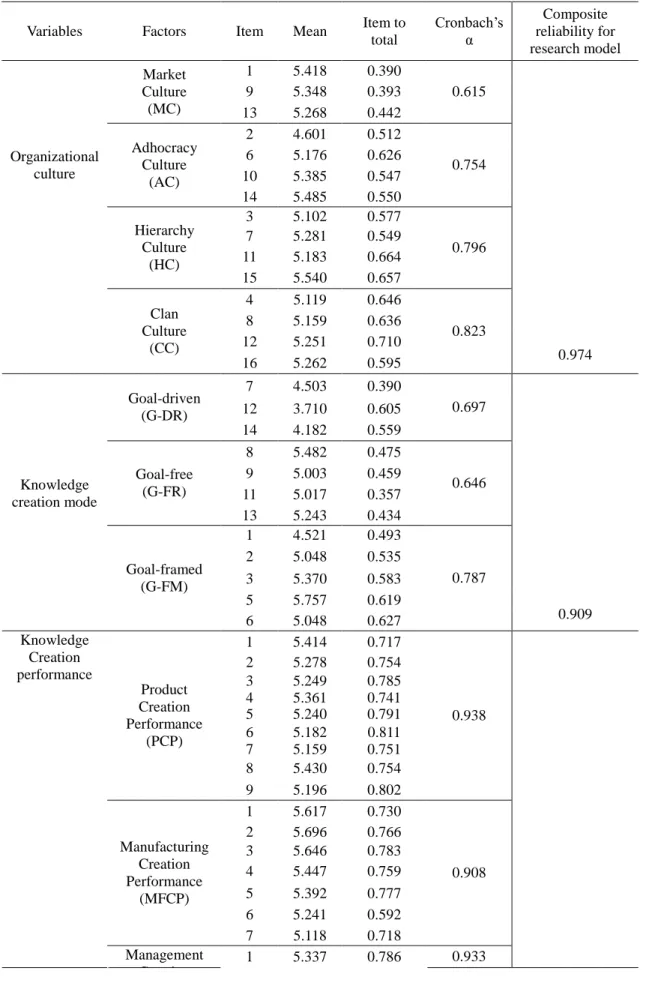
The results are listed in Table 1. An absolute fit measure is used to directly evaluate how well a priori theoretical model fits the sample data (Hu and Bentler, 1995). Measured indicators are as follows: χ2 /d.f., goodness of fit index (GFI), and root mean square residual (RMR).Bollen (1989)suggested aχ2/d.f. value less than 3.00 for a good fit of a model. Gefen et al. (2000) suggested an acceptable model has GFI larger than 0.90 and RMR between 0.05 and 0.08. Accordingly, both internal consistency reliability of the research variables and composite reliability of the research model was acceptable.
In addition, the results of factor analysis also indicated that the number of factors for the variables was according to our expectation, except for the knowledge creation mode (see Table 1). For this, it was noted that there is no evidence to date that this research could rely on to measure the knowledge creation mode. Therefore, this research conducted factor analysis and obtained three factors, namely goal-free, goal-framed, and goal-driven. In fact, item deletion was used to increase the internal consistency reliability. Although, the final result did not follow the presumed factors in theresearch model,itwasfound thatthe Cronbach’sα foreach factorwasbetween 0.65 and 0.79. Moreover, the total variance explanation for these factors was 58.22%. Since the G-FM factor was somehow between G-FR and G-DR, we therefore made further contacts with our subjects. The responses indicated that for some needs, a company may on the one hand take on the G-DR mode to effectively frame their strategy and on the other hand take on the G-FR to allow employees to freely generate ideas. Therefore, the G-FM creation mode was defined explicitly that managers may adopt the goal-driven creation mode for strategic decisions and the goal-free creation mode for lower- level decisions. This can maintain the balance between constraint (e.g. defined goal) and freedom (e.g. innovative ideas to reach the defined goal). In addition, the research model fitness was also tested. It was found that the value of χ2
/df was 2.255, indicating acceptability because it was less than the ideal value. Other parameters were all acceptable. By this, it was found that the overall research model fitness was acceptable.
Findings
The structural equation model (SEM) was built for path analysis to examine whether or not the defined hypotheses were supported. The two test criteria used were (1) standardized path coefficient, which showed causal relationship (direction) between independent variables and dependent variable; and (2) multiple regression analysis, which indicated the relationships between factors of one variable and those of another. It can be seen from Figure 2 that all path directions matched those defined in the research model. In addition, parameters of the path from knowledge creation modes to creation performance indicated insignificance (standardized path coefficient = 0.308, t = 1.33) whereas organizational culture to knowledge creation modes and to creation performance showed significant (standardized path coefficient = 0.612 and 0.880, t = 2.552 and 4.05, respectively). These results supported H1 and H3, but rejected H2, indicating that (1) organizational culture was significantly related to creation performance, 2) organizational culture showed a significant impact on knowledge creation modes, and 3) knowledge creation mode was not significantly related to creation performance.
Moreover, the multiple regression analysis was employed for in-depth examination of relationships between factors of each variable, including (1) the effect of organizational culture on creation performance (H1), (2) the effect of knowledge creation mode on knowledge creation performance (H2), and (3) the effect of organizational culture on the knowledge creation mode (H3). The test results varied widely, as shown by Table 2. For H1, it was first found that the marketculture(β= 0.176, p-value=0.073) did not present a significant impact on any type of knowledge creation performance. Second, the adhocracy culture had a significant impact both on productcreation performance(β= 0.604,p-value=0.000) and manufacturing creation
cultureweresignificantly related only to managementcreation performance (β= 0.236,
p-value=0.028 and β=0.389, p-value=0.000, respectively). However, although not
significant, the clan culture showed negative impact on the knowledge creation performance. For H2, it was first found that the goal-free (β=0.387,p-value=0.000)
and the goal-framed creation mode (β=0.164,p-value=0.050) showed a positive and
significant impact on all types of creation performance. The goal-driven mode had negative influence on all types of creation performance (β=-0.017, β=-0.173, β=-0.135, respectively), of which significant impacts on manufacturing and management creation performance were observed. For H3, the results indicated that the adhocracy culture had a positive and significant influence on goal-free creation modes (β=0.182, p-value=0.072). All types of organizational culture showed a positive and significant impact only on the goal-framed knowledge creation mode (β=0.032,p-value=0.032, β=0.166,p-value=0.041, β=0.247,p-value=0.024,β=0.213, p-value=0.035, respectively). Managerial implications are addressed below.
Conclusion
In this paper, we have highlighted the context of knowledge management, the importance of knowledge creation mode, the areas of knowledge creation performance, and the role that organizational culture plays in knowledge creation performance. We identified the research hypotheses via a review of literature. The research method was comprised of a research model, sampling plan, measure, and subjects; and data analysis results were described. The research findings in this study statistically confirmed the impact of culture on knowledge creation mode (significant) and knowledge creation performance (significant), and the impact of knowledge creation mode on knowledge creation performance as well (not significant). Based on the research results, we suggest to KM researchers - in particular knowledge creation researchers, venders, consultants, and government agencies - that (1) adhocracy culture is more likely a predicator of product and manufacturing creation, (2) both goal-free and goal-framed creation modes are more likely to support knowledge creation of product, manufacturing and management, (3) goal-driven is not likely to be a considerable mode of knowledge creation, and (4) culture types are more likely to be consistent with the goal-framed creation mode, particularly in the manufacturing industry.
References
Angle, H.L., Van de Ven, A.H., & Poole, M.S. (1989), Research on the Management ofInnovation:The MinnesotaStudies,Managing the“S”curvesofinnovation, New York: Harper and Row.
Asia Pacific intellectual Property Association, The number of patent. Available at: http://twp.apipa.org.tw/Default.asp (accessed 25 March 2007).
Atuaheme-Gima, K. (1996), “Differential potency of factors affecting innovation performance in manufacturing and services firms in Australia,” Journal of Product Innovation Management, 13(1), 35-52.
Ayres, P., & Sweller, J. (1990), “Locus of difficulty in multi-stage mathematics problems,”American JournalofPsychology,103,167-193.
Ayres, P.L.(1999),“Why goal-freeproblemscan facilitatelearning,”Contemporary Educational Psychology, 18(3), 187-207.
analysisofcovariancestructures,”Psychological Bulletin, 88, 588-606.
Bollen K.A. (1989), Structural Equations with Latent Variables, New York: John Wiley and Sons.
Cameron, K.S., & Freeman, S.L.(1991),“Culturalcongruence,strength, and type: relationships to effectiveness,” Research in Organizational Change and Development, 5, 23-58.
Chandler, G.N., Keller, C., & Lyon, D.W. (2000), “Unraveling thedeterminantsand consequences of an innovation-supportive organizational culture,” Entrepreneurship Theory and Practice, 25, 59-76.
Chatman, J.A. (1991), “Matching people and organizations: selection and socialization in public accounting firms,”Administrative Science Quarterly, 36(3), 459-484.
Chou, S.W., & Wang, S.J.(2003),“Quantifying ‘ba’:an investigation ofthevariables thatare pertinentto knowledgecreation,”JournalofInformation Science,29(3), 167–180.
Cuieford J.P. (1965), Fundamental Statistics in Psychology and Education, NY: McGraw-Hill.
Damanpour F. (1991), “Organizational innovation: a meta-analysis of effects of determinants and moderators,” Academy of Management Journal, 34(3), 555-590.
Deshpandé, R., Farley, J.U., & Webster, F.E. (1993), “Corporateculture,customer orientation, and innovativeness in Japanese firms:aquadrad analysis,”Journal of Marketing, 57, 23-37.
DiBella, A.J.(1996),“Cultureand planned changein an internationalorganization:a multi-levelpredicament,”The International Journal of Organizational Analysis, 3, 29-49.
Drucker, P.F. (1964), Managing for Results: Economic Task and Risk-taking Decisions, NY: Harper and Row.
Gagné, M., & Zuckerman, M.(1999),“Performanceand learning goalorientationsas moderators of social loafing and social facilitation,” Small Group Research, 30(5), 524-541.
Gefen D., Straub, D.W., & Boudreau, M.C.(2000),“Structuralequation modeling and regression:guidelineforresearch practice,”Communications of the Association for Information Systems, 4, 1-70.
Hauser, M.(1998),“Organizationalcultureand innovativeness of firms: an integrated view,”InternationalJournalofTechnology Management,16(1),239-255.
Hellström, T., & Jacob, M. (2003), “Knowledge without goals? Evaluation of knowledgemanagementprograms,”Evaluation,9(1),55-72.
Hill, W.(2001),“Thegoalformation processin complex organizations,”Journal of Management Studies, 6(2), 198-208.
Hu L., & Bentler, P.M. (1995), “Evaluating Model Fit,” in Structural Equation Modeling: Concepts, Issues and Application, eds. R. Hoyle, CA: Sage, 76-99. James, C., & Roffe, I. (2000), “The evaluation of goal and goal-free training
innovation,”Journal of European Industrial Training, 24(1), 12-20.
Jamrog, J., Vickers, M., & Bear, D.(2006),“Building and sustaining a culturethat supportsinnovation,”Human Resource Planning, 29(3), 9-19.
Judge, W.Q., Fryxell, G.E., & Dooley R.S. (1997), “The new task of R&D management: creating goal directed communities for innovation,” California Management Review, 39(3), 72-85.
ofmanufacturing strategy,”Omega, 18, 109-122.
Lock, E.A., & Kirkpatrick, S.A.(1995),“Promoting Creativity in Organization,”in Creative Action in Organizations: Ivory Tower Visions and Real World Voices, eds. C.M. Ford & D.A. Gioia, London: Sage, 115-120.
Louis, M.R. (1980), “Surprise and sense making: what newcomers experience in entering unfamiliarorganizationalsettings,”Administrative Science Quarterly, 25(2), 226-251.
Mauriel, J.J., Detert J.R., & Schroeder, R.G.(2000),“A framework forlinking culture and improvementinitiativesin organizations,”Academy ofManagementReview, 25(4), 850-863.
Martins, E.C., & Terblanche, F. (2003), “Building organizational culture that stimulates creativity and innovation,” European Journal of Innovation Management, 6(1), 64-74.
Nonaka, I. (1994), “A dynamic theory of organizational knowledge creation,” Organization Science, 5(1), 14-37.
Ogbonna, E., & Harris, L. (2000), “Leadership style, organizational culture and performance:empiricalevidencefrom UK companies,”TheInternationalJournal of Human Resource Management, 11(4), 766-788.
Ouchi, W.G. (1980), “Markets, bureaucracies, and clans,” Administrative Science Quarterly, 25, 129-141.
Patton, M.Q. (1987), How to Use Qualitative Methods in Evaluation, Calif: Sage. Popper, K.R. (1976), Unended Quest: An Intellectual Autobiography, Fontana: Glasgow.
Quinn, R.E. (1988), Beyond Rational Management, San Francisco: Jossey-Bass.
Schein, E.H.(1984),“Coming to anew awarenessoforganizationalculture,”Sloan Management Review, 12, 3-16.
Schroeder R.G., Benson P.G., & Saraph J.V.(1989),“An instrumentformeasuring the criticalfactorsofquality management,”Decision Sciences,20,810-829.
Scriven, M.(1977),“Goal-Free Evaluation,”in Beyond the NumbersGame,eds.D. Hamilton, B. MacDonald, C. King, D. Jenkins, and M. Parlett, CA: Berkeley, 134-138.
Simon, H. (1964), “On the concept of organization goal,” Administrative Science Quarterly, 9(1), 1-22.
Souder, W.E. (1987), Managing New Product Innovations, MA: Lexington Books. Sweller, J., & Levine, M.(1982),“Effectsofgoalspecificity on means-end analysis
and learning,” Journal of Experimental Psychology: Learning, Memory and Cognition, 8, 463-474.
Sweller, J.(1988),“Cognitiveload during problem solving,” CognitiveScience,12, 257-285.
Syrett, M., & Lammiman, J.(1997),“Theartofconjuring ideas,” Director,50(9), 48-54.
Tesluk, P.E., Farr, J.L., & Klein, S.A. (1997), “Influencesoforganizationalculture and climate on individualcreativity,”JournalofCreativeBehavior,31(1),27-41. The Largest Corporations in Taiwan: Top 5000, Taipei: China Credit Information,
2006.
Tushman, M.L., & O'Reilly, C.A. Ⅲ. (1997), Winning through Innovation: A Practical Guide to Leading Organizational Change and Renewal, Boston: Harvard Business School.
Van Maanen, J.E., & Schein, E.H. (1979), “Toward a theory of organization socialization,”Research on Organization Behavior, 1, 209-264.
Venkatraman, N.(1986),“Measurementofbusinessperformance in strategy research: a comparison of approaches,”The Academy of Management Review, 11(4), 801-814.
Vonderembse, M.A., & Tracey, M.(1999),“The Impactofsupplierselection criteria and supplier involvement on manufacturing performance,” Journal ofSupply Chain Management, 35(3), 33-39.
Walker, O.C., & Ruekert, R.W.(1987),“Marketing'srole in theimplementation of business strategies: a critical review and conceptual framework,” Journal of Marketing, 51, 15-33.
Wu, S.H. (2000), The Nature of the Strategy, Taipei: Faces. Yeh, N.C. (2004), Knowledge Management, Taipei: OpenTech.
Yeh, Y.C.(2005),“TheEffectsofOrganizationalStructure,Leadership,Strategy,and Creativity Mechanism on the Innovation Performance,” unpublished Masters Thesis, National Cheng Kung University.
Table 1: Factor analysis and reliability test for variables Variables Factors Item Mean Item to
total Cronbach’s α Composite reliability for research model 1 5.418 0.390 9 5.348 0.393 Market Culture (MC) 13 5.268 0.442 0.615 2 4.601 0.512 6 5.176 0.626 10 5.385 0.547 Adhocracy Culture (AC) 14 5.485 0.550 0.754 3 5.102 0.577 7 5.281 0.549 11 5.183 0.664 Hierarchy Culture (HC) 15 5.540 0.657 0.796 4 5.119 0.646 8 5.159 0.636 12 5.251 0.710 Organizational culture Clan Culture (CC) 16 5.262 0.595 0.823 0.974 7 4.503 0.390 12 3.710 0.605 Goal-driven (G-DR) 14 4.182 0.559 0.697 8 5.482 0.475 9 5.003 0.459 11 5.017 0.357 Goal-free (G-FR) 13 5.243 0.434 0.646 1 4.521 0.493 2 5.048 0.535 3 5.370 0.583 5 5.757 0.619 Knowledge creation mode Goal-framed (G-FM) 6 5.048 0.627 0.787 0.909 1 5.414 0.717 2 5.278 0.754 3 5.249 0.785 4 5.361 0.741 5 5.240 0.791 6 5.182 0.811 7 5.159 0.751 8 5.430 0.754 Product Creation Performance (PCP) 9 5.196 0.802 0.938 1 5.617 0.730 2 5.696 0.766 3 5.646 0.783 4 5.447 0.759 5 5.392 0.777 6 5.241 0.592 Manufacturing Creation Performance (MFCP) 7 5.118 0.718 0.908 Knowledge Creation performance Management Creation 1 5.337 0.786 0.933
2 5.405 0.732 3 5.220 0.793 4 5.130 0.844 5 5.025 0.819 6 5.019 0.713
Research model fitness: χ2
/df= 2.255<3.00;
GFI (goodness of fit index)= 0.922>0.90; RMR (root mean square residual)=0.0558<0.08
Table 2: Regression analysis results for research variables KCP Variables Factors PCP MFCP MGCP MC 0.019 0.176* 0.052 AC 0.604*** 0.375*** 0.126 HC 0.116 0.201 0.236* OC CC - 0.082 - 0.075 0.389*** Adjusted R2 0.397 0.351 0.512 G-DR -0.017 -0.173* -0.135* G-FR 0.387*** 0.427*** 0.279*** KCM G-FM 0.164* 0.290*** 0.505*** Adjusted R2 0.217 0.337 0.417 KCM G-DR G-FR G-FM MC 0.184 0.139 0.186* AC -0.057 0.182 0.166* HC -0.049 0.050 0.247* OC CC 0.133 0.196 0.213* Adjusted R2 0.022 0.222 0.495
1. N=153 (The number of samples) 2. *: p < 0.05; ***: p < 0.001
3. OC= Organizational Culture; MC= Market Culture; AC= Adhocracy Culture; HC= Hierarchy Culture; CC= Clan Culture; KCP= Knowledge Creation Performance; PCP= Product Creation Performance; MFCP= Manufacturing Creation Performance; MGCP= Management Creation Performance
Knowledge Creation Modes Goal-driven creation mode Goal-free creation mode
Organizational Culture Market culture Adhocracy culture Hierarchy culture Clan culture Creation Performance Product creation performance Manufacturing creation performance Management creation performance
H2
H1 H3
Figure 1: Conceptual model
Hierarchy culture Product creation performance Manufacturing creation performance Management creation performance Goal-framed Goal-driven Goal-free Market culture Adhocracy culture Clan culture Knowledge Creation Mode Knowledge Creation Performance Organizational Culture 0.880*** (4.05) 0.443*** (4.374) 0.765*** (4.369) 0.287** (2.667) 0.668*** (11.250) 0.679*** (10.622) 0.835*** (13.962) 0.826*** (13.310) 0.308 (1.33) 0.612* (2.552) 0.794 (4.919) 0.576*** (4.958) 0.525*** (4.705)