補償程度與客製化補救對顧客滿意度與再購意願的影響
80
0
0
全文
(2) 補償程度與客製化補救對顧客滿意度與再購意願的影響 The Effects of Compensation Level and Recovery Customization after a Service Failure on Customer Satisfaction and Repurchase Intention 研 究 生:趙培真. Student: Pei-Chen Chao. 指導教授:張家齊博士. Advisor: Dr. Chia-Chi Chang. 國 立 交 通 大 學 管 理 科 學 系 碩 士 論 文 A Thesis Submitted to Department of Management Science College of Management National Chiao Tung University in Partial Fulfillment of the Requirements for the Degree of Master in Management Science June 2008 Hsinchu, Taiwan, Republic of China 中 華 民 國 九 十 七 年 六 月.
(3) 補償程度與客製化補救對顧客滿意度與再購意願的影響 補償程度與客製化補救對顧客滿意度與再購意願的影響. 研究生: 研究生:趙培真. 指導教授: 指導教授:張家齊 教授. 國立交通大學管理科學系碩士班. 中文摘要 中文摘要 服務補救為當讓顧客感到不公平與不滿意的服務失敗發生時,服務提供者為補救服 務失敗所採取的行動。由於人類的弱點,服務失敗於服務業中是無可避免的,因此有效 的服務補救策略便顯得格外重要。大部分服務失敗的研究多著墨於正義理論的影響,並 指出分配正義對於顧客滿意度有最大的影響。然而,在高度競爭的市場中,如何透過新 的服務補救策略使得服務企業與其他企業產生差異化越顯得格外重要,而客製化是一個 較佳的選擇。因此,此份研究將探討補償程度與補償客製化兩者對顧客滿意度與再購意 願的主效果,以及補償程度與補償客製化之間的交互關係;此外,此篇研究也將探討顧 客性別差異是否在補償程度與補償客製化之間是否具有調節的效果。研究結果指出,補 償程度與補償客製化兩者皆對顧客滿意度與再購意願有正向的影響,而補償程度與補償 客製化只對補救滿意度有交互作用,對整體企業滿意度以及再購意願並沒有交互作用。 此外,顧客性別差異的確有調節的效果,其結果指出男性對於補償結果較為重視,而女 性則對於客製化概念較為重視。. 關鍵字: 關鍵字:服務失敗、服務補救、補償程度、補救客製化、顧客滿意度、再購意願. i.
(4) The Effects of Compensation Level and Recovery Customization after a Service Failure on Customer Satisfaction and Repurchase Intention. Student: Pei-Chen Chao. Advisor: Dr. Chia-Chi Chang. Department﹙ ﹙Institute﹚ ﹚of Management Science National Chiao Tung University. ABSTRACT Due to human frailties, service failure is inevitable for service firms from time to time. Effective service recovery strategies thus become more important. Most studies about service recovery focused on justice theory and indicated that distributive justice has the most significant effect on customer satisfaction. However, in a highly competitive market, it is vital to add new element into service recovery strategies for service firms to differentiate them from others, and customization appears to be a great alternative. This study thus investigated the main effects of compensation level and recovery customization on customer satisfaction and repurchase intention, and the interaction between compensation level and recovery customization. Furthermore, it also investigated the moderating effect of gender differences between compensation level and recovery customization. The results showed that both compensation level and recovery customization has positive effect on customer satisfaction and repurchase intention. The interaction between compensation level and recovery customization only exists on satisfaction with recovery, not on overall firm satisfaction and repurchase intention. Moreover, gender differences have moderating effects, which shows that males emphasize more on compensation outcome, and females emphasize more on customization concept. Key Words: Service failure, service recovery, compensation level, recovery customization, customer satisfaction, repurchase intention ii.
(5) 致 謝 辭 歷經一年來的時間,終於在這鳳凰花開的六月完成我的碩士論文,心情相當激動、 內心滿懷感謝。 首先,要誠摯地感謝我的指導教授—張家齊老師,感謝老師這一年來對我的指導, 以及持續在學術研究上給予協助與指點,讓我從一開始對浩瀚的學術領域感到手足無 措,到最後對服務失敗以及服務補救的研究領域有更深入的了解與看法;此外,老師對 於學術研究所抱持積極、嚴謹的態度以及滿懷的熱忱,更是值得我所學習的。 感謝佳誼學長、德祥學長、愛華學姊、淑慧學姊的大力協助,在這一年來你們持續 不斷地協助我,當我在研究的路上遭遇到困難時,感謝你們立即給予我協助與鼓勵,幫 助我解決問題、走出低潮。特別感謝佳誼學長,感謝學長總是不時地提供豐富的相關資 料給我參考、指導我在統計分析上的問題、更在我面臨研究困惑時為我指點迷津、給予 寶貴意見。 感謝美倫、毓玫、涵琄、欣穎、黃河、宏國、冠州以及其他好朋友們,感謝你們不 辭辛勞地為我發放問卷,給予我許多寶貴的建議,同時也感謝所有認真參與本研究的受 試者,正因為有你們的大力支持與協助,使得本論文有相當多豐富的資料進行分析,我 的論文才得以順利完成 感謝張門的夥伴,艾芸、慧妤、柏源、雅君,感謝你們這一年來的陪伴,我會記得 ,可愛慧妤的無厘頭以及艾芸的貼心,我 邱 Q 搞笑與吵架的功力,雅君的口頭禪「ok!」 們之間可貴的革命情感,我永遠也不會忘記!特別感謝艾芸,除了在碩一時建立起堅定 的室友情誼,更是在碩二時攜手一同研究,總是在我緊張時給我鼓勵、在我困惑時給我 意見,謝謝你的陪伴,讓我的研究生涯過得多采多姿。 感謝紹懷,總是在我面臨研究困境與心情低潮時伴我左右,給予我莫大的鼓勵與支 持,陪伴我每個來回奔波台北、新竹的日子,你的默默付出一直是我前進的最大動力。 最後,要特別感謝我的家人們,感謝你們在我求學過程中一路的栽培與鼓勵,因為有你 們的付出,才成就今日的我,非常感謝你們。. iii.
(6) Index 中文摘要.................................................................................................................................... i ABSTRACT.............................................................................................................................. ii 致 謝 辭….............................................................................................................................. iii Index……… ............................................................................................................................ iv Table Index............................................................................................................................... vi Figure Index ............................................................................................................................ vii Chapter 1 Introduction........................................................................................................... 1 1.1 Background...........................................................................................................1 1.2 Research Motivation and Purpose ........................................................................2 1.3 Research Process ..................................................................................................5 Chapter 2 Literature Review.................................................................................................. 7 2.1 Service Recovery..................................................................................................7 2.2 Perceived Justice...................................................................................................8 2.3 Distributive Justice (Compensation Level) ........................................................10 2.4 Recovery Customization .................................................................................... 11 2.5 Gender ................................................................................................................13 2.6 Customer Satisfaction.........................................................................................15 2.7 Two Types of Satisfaction ..................................................................................16 2.8 Repurchase Intention ..........................................................................................17 2.9 Hypotheses .........................................................................................................18 2.10 Research Framework ..........................................................................................23 Chapter 3 Methodology ....................................................................................................... 24 3.1 Conceptual Research Framework.......................................................................24 3.2 Scenario Design..................................................................................................25 3.3 Sampling Plan.....................................................................................................25 3.4 Measurement ......................................................................................................27 3.4.1 Compensation Level ..................................................................................27 3.4.2 Recovery Customization ...........................................................................27 3.4.3 Overall Firm Satisfaction and Satisfaction with Recovery .......................28 3.4.4 Repurchase Intention .................................................................................29 3.5 Data Collection ...................................................................................................29 3.6 Manipulation Check ...........................................................................................29 3.7 Pretest .................................................................................................................30 Chapter 4 Research Analysis and Results............................................................................ 33 4.1 Background of Participants ................................................................................33 4.2 Reliabilities.........................................................................................................34 4.3 Manipulation Checks..........................................................................................35 4.4 Analysis of Results .............................................................................................35 iv.
(7) 4.4.1. Effects of Compensation Level on Overall Firm Satisfaction, Satisfaction with Recovery, and Repurchase Intention.................................................36 4.4.2 Effects of Recovery Customization on Overall Firm Satisfaction, Satisfaction with Recovery, and Repurchase Intention.............................39 4.4.3 Interaction between Compensation Level and Recovery Customization..39 4.4.4 Effects of Different Genders .....................................................................44 Chapter 5 Discussion and Future Research ......................................................................... 51 5.1 Discussion for Results ........................................................................................51 5.1.1 Compensation Level, Recovery Customization, Customer Satisfaction, and Repurchase Intention. ................................................................................51 5.1.2 Interaction between Compensation Level and Recovery Customization..52 5.1.3 Gender .......................................................................................................53 5.2 Managerial Implications .....................................................................................54 5.3 Limitations and Future Research........................................................................57 Reference… ............................................................................................................................ 59 Appendix A Scenarios............................................................................................................. 63 Appendix B Questionnaires .................................................................................................... 67. v.
(8) Table Index Table 1 Reliability Statistics of Pretest.................................................................................32 Table 2 Demographics of Participants..................................................................................33 Table 3 Reliability Statistics .................................................................................................34 Table 4 Manipulation Check of Compensation Level ..........................................................35 Table 5 Manipulation Check of Recovery Customization....................................................35 Table 6 Descriptive Statistics ...............................................................................................36 Table 7 Overall MANOVA: Overall Firm Satisfaction, Satisfaction with Recovery, and Repurchase Intention ..............................................................................................37 Table 8 Tests of Compensation Level and Recovery Customization ...................................37 Table 9 Tests of Compensation Level and Recovery Customization ...................................38 Table 10 Tests of Compensation Level and Recovery Customization .................................38 Table 11 Multiple Comparisons (LSD) ................................................................................42 Table 12 Multiple Comparisons (LSD) ................................................................................43 Table 13 Multiple Comparisons (LSD) ................................................................................44 Table 14 Overall MANOVA: Overall Firm Satisfaction, Satisfaction with Recovery, and Repurchase Intention ..............................................................................................45 Table 15 Tests of Compensation Level, Recovery Customization, and Gender...................46 Table 16 Tests of Compensation Level, Recovery Customization, and Gender...................47 Table 17 Tests of Compensation Level, Recovery Customization, and Gender...................47. vi.
(9) Figure Index Figure 1 Research Flow.............................................................................................................6 Figure 2 Research Framework.................................................................................................23 Figure 3 Conceptual Research Frameworks............................................................................24 Figure 4 The Interaction between Compensation Level and Recovery Customization on Overall Firm Satisfaction .......................................................................................40 Figure 5 The Interaction between Compensation Level and Recovery Customization on Satisfaction with Recovery.....................................................................................41 Figure 6 The Interaction between Compensation Level and Recovery Customization on Repurchase Intention ..............................................................................................41 Figure 7 The Interaction between Compensation Level and Gender on Overall Firm Satisfaction .............................................................................................................48 Figure 8 The Interaction between Compensation Level and Gender on Satisfaction with Recovery.................................................................................................................48 Figure 9 The Interaction between Compensation Level and Gender on Repurchase Intention ................................................................................................................................49 Figure 10 The Interaction between Recovery Customization and Gender on Overall Firm Satisfaction .............................................................................................................49 Figure 11 The Interaction between Recovery Customization and Gender on Satisfaction with Recovery.................................................................................................................50 Figure 12 The Interaction between Recovery Customization and Gender on Repurchase Intention..................................................................................................................50. vii.
(10) Chapter 1 Introduction 1.1 Background There is considerable evidence to support the view that customer satisfaction is vital to the success of organizations, and that customer satisfaction is linked to profits (Sparks & McColl-Kennedy, 2001). Although service firms seek to deliver flawless service performance, service failures, which make customers dissatisfied, are inevitable from time to time due to human frailties and the unique characteristics of services. Two factors complicate the management of service failure. First, production and consumption occur simultaneously during service delivery which implies that when service failures do occur, it is impossible for service providers to correct the mistake without customer awareness. Second, providing a satisfactory recovery promptly is difficult. Due to simultaneous production and consumption, undoing or re-doing a service is difficult and impossible (Boshoff & Leong, 1998). Given that service failures are common and inevitable, effective service recovery strategies become more important. There is considerable evidence to support the view that service failure and poor service recovery result in high customer dissatisfactions and defections (Forbes, Kelley, & Hoffman, 2005; Kau & Loh, 2006). It may also lead customers to actively engage in activities against an organization, such as spreading negative word-of-mouth and/or complaining directly to the organization. In order to turn dissatisfied customers into satisfied ones, service firms should design an appropriate recovery process based on research-based knowledge to. 1.
(11) avoid the harmful impact of service failure. Many studies of service management have addressed the role of justice in service recovery. Customers evaluate service recovery in terms of distributive justice, procedural justice, and interactional justice (Blodgett, Hill, & Tax, 1997; Tax, Brown, & Chandrashekaran, 1998). Another area of service recovery research focused on the outcome of service recovery. Research has empirically demonstrated that effective service recovery will result in greater satisfaction (Conlon & Murray, 1996; Harris, Grewal, Mohr, & Bernhardt, 2006; Kau & Loh, 2006; Tax et al., 1998), repurchasing intention (Harris et al., 2006; Kau & Loh, 2006), commitment(Tax et al., 1998), trust (Kau & Loh, 2006; Tax et al., 1998), and word-of-mouth (Kau & Loh, 2006; Tax et al., 1998). 1.2 Research Motivation and Purpose Most studies about service recovery has focused on the effects of justice theory, and has been demonstrated that all three dimensions of justice have a positive relationship with customer satisfaction (Cho, Im, & Hiltz, 2003; Kau & Loh, 2006; Tax et al., 1998). Tax et al. (1998) also demonstrated that two-way interactions between the three justice components will affect customer satisfaction. In most cases, distributive justice has the most significant effect on customers satisfactions (Kau & Loh, 2006; Mattila & Patterson, 2004; Weun, Beatty, & Jones, 2004). In general, distributive justice focuses on the actual objective outcome of the service recovery, such as financial compensation, which can be presented in the form of a. 2.
(12) refund or discount off the service that was defective, or replacement (Sparks & McColl-Kennedy, 2001). Most service companies usually provide compensation. When people received a higher level of compensation, such as a big discount, they register higher satisfaction. Hence, compensation level, the focus, will be treated as the dimension of distributive justice in this study. In a highly competitive market, customization appears to be an alternative to differentiate companies. No matter in which product or service industry, customized products and services are much more likely to meet customers’ exact needs and desire (Johnson, Herrmann, & Gustafsson, 2002; Pine, 1993). In addition, customization would further make customers perceive higher value (Flynn, 1999) and result in higher satisfaction (Bitner, Booms, & Tetreault, 1990). However, although there are considerable issues about customization in the marketing area, no research has to date examined customization in the area of service recovery. Since service customization would have a positive impact on customer evaluations of service experience (Bettencourt & Gwinner, 1996; Bitner et al., 1990), it is assumed that customized recoveries would also have a positive impact on satisfaction with recovery and repurchase intention. In the research on service recovery, the level of compensation would have more significant effect on the evaluation of satisfaction, which means that a higher compensation level is assumed to result in high satisfaction. In recent years, however, customization has. 3.
(13) become popular because customers place more emphases on the feeling of being treated as “distinctive” during a service encounter. It is assumed that customers would experience higher satisfaction if they receive customized recoveries after a service failure. It would therefore be interesting to examine whether or not recovery customization increases the effect of compensation level on recovery evaluation. Gender is a further issue this study examines since different genders may put different emphases on recovery outcome. Research has indicated that women tend to be “communal goals”, while men, “agentic goals” (Archer, 1996). It is also pointed out that women tend to be socially oriented while men tend to be task oriented (Oakley, 2000). Based on gender differences, it was assumed that men might put more emphases on the compensation level of recovery outcome during evaluating service recovery, whereas women would put more emphases on the customization issue. This research thus examines whether the interaction exists between gender differences and compensation level and between gender differences and recovery customization. Based on the above, the following research questions are raised. 1.. What are the effects of compensation level and recovery customization on customer satisfaction/repurchase intention?. 2.. What is the interaction between compensation level and recovery customization?. 3.. How do customer gender differences affect the influence of compensation level/recovery. 4.
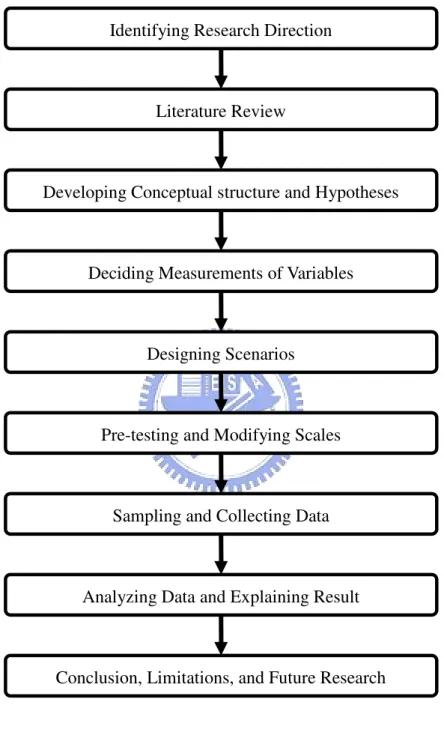
(14) customization on customer satisfaction/repurchase intention? 1.3 Research Process The basic structure of this paper is organized as follows: first, the research framework is outlined. Second, literature related to service recovery, justice theory, recovery customization, gender issue, and recovery evaluation is reviewed and integrated into the framework. Hypotheses are presented following the literature review. Third, the methodology is set out, including a short description of scenarios, experimental manipulation, and the statistic methods used to test the hypotheses. After reporting the results, conclusions and key managerial and research implications are presented. The specific research flow is presented as follows.. 5.
(15) Identifying Research Direction. Literature Review. Developing Conceptual structure and Hypotheses. Deciding Measurements of Variables. Designing Scenarios. Pre-testing and Modifying Scales. Sampling and Collecting Data. Analyzing Data and Explaining Result. Conclusion, Limitations, and Future Research. Figure 1 Research Flow. 6.
(16) Chapter 2 Literature Review 2.1 Service Recovery Service recovery is defined as “the actions of a service provider to mitigate and/or repair the damage to a customer that results from the provider’s failure to deliver a service as is designed” (Johnston & Hewa, 1997, p. 467). It is the action taken by a service provider to redress service failure which makes customers feel unfairly treated and dissatisfied. Recovery management is important since inadequate or inappropriate company responses to service failures will significantly increase the defection rate from a firm. Moreover, mishandling customer complaints not only results in customer dissatisfaction and defection, but also negative word-of-mouth publicity which affected customers spread to other friends and family. It has been reported that as many as 75 percent of restaurant customers share information with others about their poor service experiences (Becker & Wellins, 1990). The benefits of managing effective service recovery strategies are comprehensible. Increasingly competitive markets point to the importance of preserving customer loyalty and developing long-term relationships with them (Blodgett et al., 1997). Furthermore, customers with long-term relationships with service firms are more profitable because customers tend to be less sensitive to price premiums (Mattila, 2001) and price competition (Reichheld & Sasser, 1990), more receptive to firm’s marketing efforts (Hoffman & Kelley, 2000), and purchase in greater quantity and more frequently than new customers (Reichheld & Sasser, 1990). In short,. 7.
(17) the costs of obtaining a new customer are three to five times greater than those associated with keeping an existing customer (Hoffman & Kelley, 2000). Hence, implementing effective and appropriate service recovery to avoid the harmful impact on the firm and make more profits makes good business sense. 2.2 Perceived Justice In the context of service recovery, customers often use equity theory to evaluate service recovery efforts (Adams, 1965). Adams (1965) first proposed that people felt fairly treated in social exchange relationship when they perceived that their own economic outcomes relative to their inputs were in balance. On the contrary, inequity existed when the perceived inputs and outputs in an exchange relationship were not in balance or were deemed unfair. As such, the presence of equity is postulated to yield equitable states associated with feelings of satisfaction, whereas inequity was expected to be associated with dissatisfaction. In a service marketing situation, a customer weighs his inputs against outputs received, and compares these inputs and outputs with those of others experiencing similar situations (Greenberg, 1990). Within a service recovery context, a customer’s inputs could be determined by the costs associated with a service failure such as time, energy, economic and psychic costs (Hoffman & Kelley, 2000), and outcomes could include the specific recovery tactic used such as cash refund, apology, replacement, and so on (Kau & Loh, 2006). The perceived justice component of equity theory would then lead customers to determine whether the recovery. 8.
(18) strategy offered was fair or just (Sheppard, Lewicki, & Minton, 1992). Hoffman & Kelley (2000) pointed out that perceived justice proposes that “recovery process itself; the outcomes connected to the recovery strategy; and the interpersonal behaviors enacted during the recovery process and the delivery of outcomes are all critical” in service recovery assessment (p. 420). Accordingly, Tax et al. (Tax et al., 1998) proposed that perceived justice consists of three dimensions: distributive justice, procedural justice, and interactional justice. Distributive justice is defined as “the extent to which customers feel they have been treated fairly with respect to the final recovery outcome” (Maxham & Netemeyer, 2002, p. 240). Procedural justice refers to the perceived fairness of the policies and means involving the recovery efforts (Maxham, 2001; Tax et al., 1998). Interactional justice refers to the fairness of the interpersonal treatment people receive during the resolution process of conflict (Bies & Shapiro, 1987; Tax et al., 1998). It has been indicated that all three dimensions of justice have positive effects on satisfaction (Harris et al., 2006; Tax et al., 1998) and repurchase intention (Blodgett et al., 1997; Maxham & Netemeyer, 2002). Among three dimensions of justice, since procedural justice is a rather complex concept (Blodgett et al., 1997), its definition is too broad to reach a common conclusion. In addition, the effects of procedural justice in service recovery are not apparent, as Blodgett et al. (1997) found that procedural justice did not have a significant effect on customers’ repatronage intentions nor negative word-of-mouth. Therefore, this study did not examine procedural justice further. On. 9.
(19) the other hand, distributive and interactional justice both have significant effects on satisfaction and repurchase intentions (Blodgett et al., 1997; Weun et al., 2004). But, it has been found that distributive justice has more significant effects on satisfaction than interactional justice (Kau & Loh, 2006; Mattila & Patterson, 2004; Weun et al., 2004). This study thus focused on distributive justice rather than interactional. 2.3 Distributive Justice (Compensation Level) Distributive justice refers to “the perceived fairness of the tangible outcome of a dispute, negotiation, or decision involving two or more parties” (Blodgett et al., 1997, p. 188) . It is concerned primarily with the specific outcome of the firm’s recovery efforts, i.e. what did the offending service provider offer the customer to recover service failure, and whether the outcomes offset the cost incurred by service failure (Gilliland, 1993; Greenberg, 1990). There are three notable principles associated with distributive justice: equity, equality, and need (Tax et al., 1998). Of these, the role of equity principle, which is identified as the ratio of outcomes proportional to inputs to an exchange (Sparks & McColl-Kennedy, 2001), enjoys the greatest emphasis. Typical distributive justice is applied in many ways, such as compensation (e.g. gratis, discounts, coupons, and free upgrades), corrections of charges, refunds, repairs, credit, replacements and apologies (Blodgett et al., 1997; Forbes et al., 2005; Goodwin & Ross, 1992; Kelley, Hoffman, & Davis, 1993; Tax et al., 1998). Since tangible compensation is the most common means of distributive justice, this study focused on. 10.
(20) compensation levels as the dimensions of distributive justice. 2.4 Recovery Customization There are considerable issues around customization in marketing area. In a highly competitive market, customization appears to be an alternative to differentiate companies. Definitions of mass customization as visionary and practical are abundant in the literature. Davis (1989) first coined the term and promoted mass customization in a broad way. For a broad and visionary definition, mass customization is described as, “the ability to provide your customers with anything they want profitably, any time they want it, anywhere they want it, any way they want it” (Hart, 1995, p. 36) . Mass customization is the ability to provide every customer individually designed products and services through high process agility, flexibility and integration (Silveira, Borenstein, & Fogliatto, 2001). Since the visionary definition of mass customization is an ideal that rarely achieved by companies, other researchers defined mass customization in a narrower and more practical way, as the ability to produce varied and individually customized products and services by the use of flexible processes and organizational structures at the low costs of a standardized, mass production system (Hart, 1995). In the narrow definition, products and services are customized within a predetermined “envelop of variety” rather than “anything-at-any-time”, which make customization more practical rather than the pie in the sky (Hart, 1995). In the product industry, research has indicated that customized products are much likely. 11.
(21) to meet customers’ exact needs and desires (Pine, 1993). Moreover, customers also perceived higher value in customized products (Flynn, 1999) and were willing to pay a premium for them (Piller, Moeslein, & Stotko, 2004). Over and above the product industry, researchers also began to pay increasing attention to the service industry. A service encounter is the dynamic interaction between a customer and a service provider (Surprenant & Solomon, 1987). A service encounter affords the greatest opportunity for a firm to customize the delivery of its services because a service provider interacts with individual customers, which allows the service provider to provide intensely personal and customized services to suit a very heterogeneous set of needs (Bettencourt & Gwinner, 1996; Johnson et al., 2002; Surprenant & Solomon, 1987). Given that the nature of the interaction has been recognized as the critical determinant of satisfaction with the service (Surprenant & Solomon, 1987), higher levels of service customization during personal interaction could result in higher satisfaction and a memorable service experience from a customer’s perspective (Bettencourt & Gwinner, 1996; Bitner et al., 1990). Evaluating product production differs from evaluating service not only of the outcome, but also of the manner customers are served. Since employees are directly involved with customers, employee customization can be divided into two behavioral dimensions: interpersonal adaptive behavior and service offering adaptation (Bettencourt & Gwinner, 1996). Interpersonal adaptive behavior refers to, “an employee altering various interpersonal. 12.
(22) communication elements to meet what they perceive to be the unique needs of individual consumers” (Bettencourt & Gwinner, 1996, p. 3). Surprenant & Solomon (Surprenant & Solomon, 1987) used the phrase “programmed personalization” in service encounters to describe a similar perspective. It has been found that this type of personalization had positive effects on evaluations of an employee and satisfaction with employee friendliness (Surprenant & Solomon, 1987). Service offering adaptation refers to, “tailoring or creating a unique bundle of service attributes or benefits based on an individual consumer’s needs” (Bettencourt & Gwinner, 1996, p. 3). Surprenant & Solomon (1987) used the phrase “customized personalization” and described it as, “assisting the customer in attaining the best possible form of the service offering for his or her needs”, (p.89) with the similar perspective. They found that this type of personalization had positive effects on customer evaluations of employee helpfulness and satisfaction with employee friendliness. 2.5 Gender Various factors may influence the evaluations of recovery, and one of these is gender. Most service recovery research assumed that all customers are alike. However, Smith, Bolton, & Wagner (1999) warned that customers may not be homogeneous in their evaluation of the effectiveness of service recovery attempts made by frontline employees. To date, individual consumer differences, such as gender, have been minimally included in research as variables worthy of examination in their own right. Although it seems common to include gender. 13.
(23) variable to observe their influences on the research, there are few experimental studies that have specifically examined gender differences in customer satisfaction or service recovery. The only exception appears to be Lacobucci & Ostrom (1993), who found significant differences in the way men and women perceived services, and that there were significant gender differences in terms of the importance placed on core and peripheral services (McColl-Kennedy, Daus, & Sparks, 2003). It is expected that customer of different genders would evaluate service recovery based on different criteria. Gender has a long history of categorization generally, and specifically, within consumer behavior and marketing (Darley & Smith, 1995; Holbrook, 1986; Meyers-Levy & Sternthal, 1991). To date, much research has consistently demonstrated certain differences between men and women and much discussion has centered on social role theory to account for much of the observed differences both among marketing researchers and researchers from other related disciplines (Saad & Gill, 2000). In the research related to leadership behavior, women tend to put more emphases on process, whereas men tend to be more task-focused and thus place more emphases on outcomes (Kiran, Vincent, & Leona, 2007; Lacobucci & Ostrom, 1993; Oakley, 2000). These differences can be identified as socially or process oriented, and task oriented (Kiran et al., 2007; McColl-Kennedy et al., 2003). In related research, Carlson (1971) pointed out that women value social relationships more than men. And women tend to be more interested than. 14.
(24) men in how they are treated by service providers (Kiran et al., 2007). Since customization is the process which focuses more on the process than the final outcome, it is assumed that recovery customization would have a stronger effect on women. Compensation level can thus be assumed to have a stronger effect on men because they are more task oriented, which focuses on the final outcome and not on the process. Due to the differences of gender characteristic, it is expected that customer of different genders would evaluate service recovery based on different criteria. 2.6 Customer Satisfaction There is considerable evidence which shows that service recovery will influence customer satisfaction (Conlon & Murray, 1996; Harris et al., 2006; Kau & Loh, 2006; Tax et al., 1998). In the field of marketing research, customer satisfaction is also an important affective construct that numerous researchers have paid attention to (Fournier & Mick, 1999; Oliver, 1999). Oliver (1997) claimed that “satisfaction is derived from the Latin satis (enough) and facere (to do or make)” (p.11). Satisfaction is also a kind of emotional evaluation (Andreassen, 2000). From the perspective of the disconfirmation paradigm, “customer satisfaction is a summary psychological state resulting from the combination of the emotional evaluation of disconfirmed expectations during the service encounter and the feelings prior to the service encounter” (Oliver, 1981, p. 27). Oliver (1981) claimed that satisfaction will. 15.
(25) gradually “decay” into an overall attitude towards a product or service, and the attitude customers hold will influence their following behaviors, such as repeat purchase and word-of-mouth intent, and will shape their expectations toward the specific objects or firm (Boshoff, 1997). In short, satisfaction is the customer’s fulfillment response which is a judgment that a product or service itself provided a favorable or pleasurable level of consumption-related fulfillment (Oliver, 1997). Since satisfaction is a summary affective response in service encounters which can directly influence post-service behavior, such as repurchase intention and word-of-mouth, it is also important in service recovery situation. Research has indicated that effective service recovery will lead to higher customer satisfaction (Kau & Loh, 2006; Maxham & Netemeyer, 2002). Customer satisfaction has also been shown to have a critical positive impact on customer retention and profitability, especially in competitive markets (Terri & Jennifer, 2006). Hence, it will be the dependent variable in this study. 2.7 Two Types of Satisfaction Although most service recovery research has measured satisfaction with a particular recovery experience, Maxham & Netemeyer (2002) examined satisfaction as two distinct types: satisfaction with recovery and overall firm satisfaction. Satisfaction with recovery was defined as satisfaction with a particular service encounters involving a failure and recovery, while overall firm satisfaction refers to a customer’s cumulative satisfaction with multiple. 16.
(26) experiences, transactions, and encounters with a service organization (Maxham & Netemeyer, 2002; Smith & Bolton, 1998). It indicated that satisfaction with recovery positively affects overall firm satisfaction (Maxham & Netemeyer, 2002; Smith & Bolton, 1998). Since some customers may view a service failure and recovery as a single specific experience, which may result in a slight difference in overall firm satisfaction, this research examined the two types of satisfaction as outlined above. 2.8 Repurchase Intention Satisfaction literature strongly supports the idea that increased satisfaction with a service encounter leads to an increased repurchase intention, which is the propensity to return to the same service provider (Harris et al., 2006). Holloway, Wang, & Parish (2005) identify repurchase intentions as the likelihood of future purchase behavior from a specific retailer and is often treated as a key indicator of loyalty. In the context of service failure and recovery, Kau & Loh (2006) have showed that effective recovery strategies results high satisfaction and repurchase intentions. Satisfaction with recovery evaluation is also positively related to repurchase intention (Boshoff, 1997). Smith & Bolton (1998) explain the relationship between service recovery, satisfaction, and repurchase intention by showing that satisfaction after a service recovery affects positively repurchase intentions and word-of-mouth behavior. Repurchase intention is a key element of service recovery (Thomas, Blattberg, & Fox, 2004). Reichheld & Sasser (1990) record that a service firm can boost profits by as much as. 17.
(27) 100 percent just by increasing customer retention rate by a mere 5 percent. Furthermore, other studies have also showed that a firm has a 60 to 70 percent chance of successfully reselling to an“active” customer, compared to only a 5 to 20 per cent chance of successfully selling to a new customer (Bhandari, Tsarenko, & Polonsky, 2007). It suggests that repatronage increases profitability by reducing the expense of attracting new customers (Mittal & Lassar, 1998). Although prior research has showed that satisfaction with recovery directly and indirectly affects repurchase intention (Smith & Bolton, 1998), other constructs might still have substantial influences on it (Holloway & Beatty, 2003), such as switching cost (Harris et al., 2006) and cumulative prior experience (Holloway et al., 2005; Tax et al., 1998). On the whole, repurchase intention is the focus in this study. A further aim of this study was to ascertain whether effective recovery which consists of different level of compensation and recovery customization is positively related to repurchase intention or not. 2.9 Hypotheses It has been indicated in section 2.3 above that much marketing research has examined the effects of distributive justice. There is considerable evidence that supports equity evaluations’ influence on customer satisfaction (Harris et al., 2006; Oliver & DeSarbo, 1988; Oliver & Swan, 1989), repurchase intentions. (Blodgett et al., 1997; Harris et al., 2006), and. word-of-mouth (Blodgett et al., 1997). This suggests that distributive justice is positively related to customer satisfaction with recovery efforts. In other words, when customers receive. 18.
(28) more compensation or a higher level of compensation, customers will be more satisfied with the outcome. Therefore, it was hypothesized that compensation level is positively related to satisfaction with service recovery evaluation and repurchase intention. In addition, since satisfaction with recovery is positively related to overall firm satisfaction (Maxham & Netemeyer, 2002), it was assumed that compensation level would also be positively related to overall firm satisfaction. H1: Distributive justice (compensation level) will have a positive effect on (a) overall firm satisfaction, (b) satisfaction with recovery, and (c) repurchase intention. About recovery customization, prior research has showed that higher levels of service customization during personal interaction could result in higher satisfaction and a memorable service experience from a customer’s perspective (Bettencourt & Gwinner, 1996; Bitner et al., 1990). Moreover, Surprenant & Solomon (1987) also indicated that service offering adaptation had positive effects on customer evaluations of employee helpfulness and satisfaction with employee friendliness. Although increasing attention has been paid to service encounters, no research examines customization issues in the area of service recovery. Since service customization has positive impact on customer evaluation of a service experience, it is assumed that recovery customization also has positive impact on recovery evaluation of satisfaction. Since customers perceived higher value for customized products, it has also been assumed that customers who received customized recovery would perceive higher value and. 19.
(29) have higher repurchase intention. H2: Recovery customization will have a positive effect on (a) overall firm satisfaction, (b) satisfaction with recovery, and (c) repurchase intention. It was indicated in section 2.3 above that distributive justice, often represented as compensation, is positively related to satisfaction (Kau & Loh, 2006; Maxham & Netemeyer, 2002; Tax et al., 1998) and repurchase intention (Blodgett et al., 1997; Tax et al., 1998). Furthermore, customization related studies also show that higher levels of service customization during personal interaction could result in higher satisfaction and a memorable service experience from a customer’s perspective (Bettencourt & Gwinner, 1996; Bitner et al., 1990). Hence, it is expected that when customer evaluates the process of service recovery, there is interaction between compensation level and recovery customization. It is hypothesized that recovery customization would enhance the positive effect of compensation level on recovery evaluation, satisfaction and repurchase intention.. H3: The effect of compensation level on (a) overall firm satisfaction, (b) satisfaction with recovery, (c) repurchase intention will be moderated by recovery customization. When a customized recovery is offered, the compensation level of the recovery will have. greater. impact. on. overall. recovery/repurchase intention.. 20. firm. satisfaction/satisfaction. with.
(30) A further interesting issue is whether recovery customization offsets the negative effect of low compensation level on customer satisfaction and repurchase intention. Although low compensation level is assumed to result in lower satisfaction and repurchase intention, customized recovery might increase customer satisfaction and repurchase intention to a higher level. Similarly, even though high compensation level could induce higher customer satisfaction and repurchase intention, a lack of customization might reduce customer satisfaction and repurchase intentions to a lower level, which might be almost the same as the recovery which was customized with low compensation level. It is therefore suggested that there will be no significant differences of customer satisfaction and repurchase intentions between a recovery which was not customized with high compensation level and a recovery which was customized with low compensation level. H4: When a recovery is customized with low level of compensation, (a) overall firm satisfaction, (b) satisfaction with recovery, and (c) repurchase intention will not differ significantly from when a recovery is not customized with high level of compensation. Last, about the issue of gender in service recovery research, it has been indicated in section 2.5 that male tend to be more task oriented and female tend to be socially or process oriented. Furthermore, Kiran et al. (2007) found that women often assess service recovery qualitatively and evaluate satisfaction of service recovery in terms of process-based aspects of. 21.
(31) recovery. They care much more about whether service providers are concerned about what happen to them (McColl-Kennedy et al., 2003). On the other hand, men tend to asses service recovery quantitatively and evaluate satisfaction of service recovery in terms of outcome-based aspects of recovery (Kiran et al., 2007). Consequently, the poor handling of a recovery process will negatively affect women’s satisfaction of service recovery much more, whereas a poor recovery outcome will negatively affect men’s satisfaction of service recovery much more. Since customization is the process which shows greater concern about customers and also place more emphases on the customized process, it is expected that recovery customization would have stronger positive effects on female customer satisfaction and repurchase intention than on that of males, irrespective of the compensation level. On the other hand, since compensation level is one of the recovery forms which represents recovery outcome, it is assumed that compensation level would have stronger positive effects on male customer satisfaction and repurchase intention than on that of female customers, irrespective of whether the recovery is customized or not.. H5: For male customers, compensation level will have greater positive effect on (a) overall firm satisfaction, (b) satisfaction with recovery, and (c) repurchase intention than female customers regardless of recovery customization.. 22.
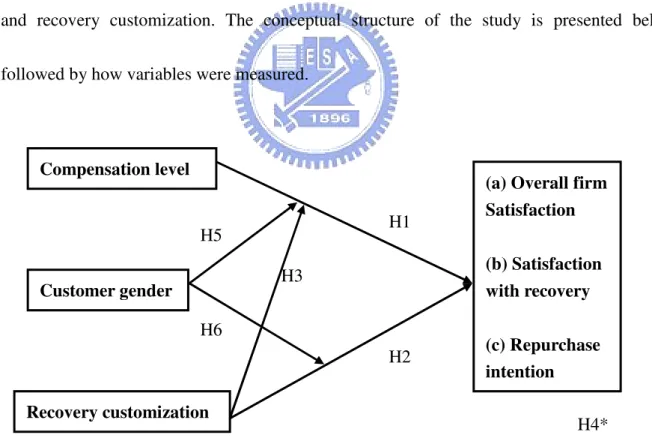
(32) H6: For female customers, recovery customization will have greater positive effect on (a) overall firm satisfaction, (b) satisfaction with recovery, and (c) repurchase intention than male customers regardless of compensation level. 2.10 Research Framework The major objectives of this study was to identify (1) the main effect of compensation level and customized recovery on satisfaction and repurchase intention, and (2) the interaction between compensation level and customization. The study also examines whether there is interaction between gender difference and compensation level and between gender difference and recovery customization. The conceptual structure of the study is presented below, followed by how variables were measured.. Compensation level H1. H5. (b) Satisfaction with recovery. H3. Customer gender. (a) Overall firm Satisfaction. H6 H2 Recovery customization. (c) Repurchase intention H4*. Figure 2 Research Framework. 23.
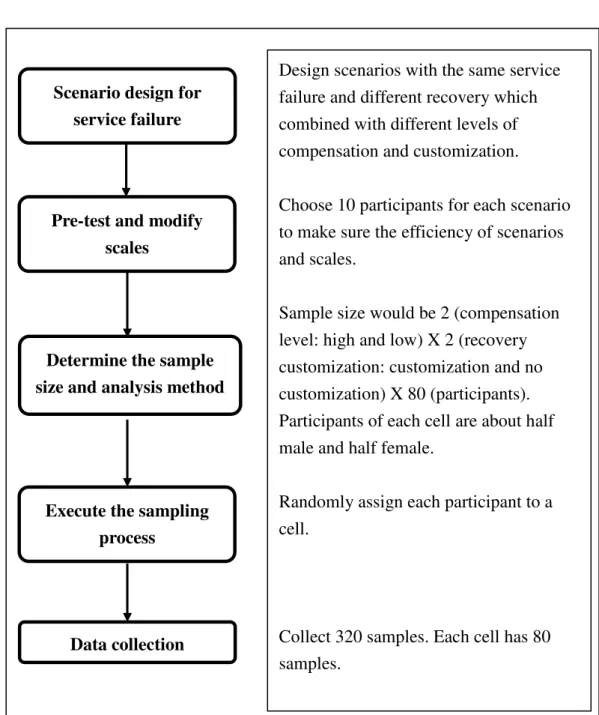
(33) Chapter 3 Methodology 3.1 Conceptual Research Framework. Scenario design for service failure. Design scenarios with the same service failure and different recovery which combined with different levels of compensation and customization.. Pre-test and modify scales. Choose 10 participants for each scenario to make sure the efficiency of scenarios and scales.. Determine the sample size and analysis method. Execute the sampling process. Data collection. Sample size would be 2 (compensation level: high and low) X 2 (recovery customization: customization and no customization) X 80 (participants). Participants of each cell are about half male and half female. Randomly assign each participant to a cell.. Collect 320 samples. Each cell has 80 samples.. Figure 3 Conceptual Research Frameworks. 24.
(34) 3.2 Scenario Design The following scenario was used in this study: an online bookstore experience was used as the context for the service failure. In the scenario, “dispatch of books ordered on the online bookstore was delayed” was described as service failure. An online bookstore was chosen as the scenario for three reasons. First, it is common for online bookstores to customize recovery outcome because they have a huge and perfect customer database. Second, delays in dispatching orders is a common failure in the online bookstore industry (Forbes et al., 2005). Third, ordering books from online bookstores has become more and more popular in Taiwan since e-commerce retail has boomed in the recent years. The use of scenarios has been justifiable for several reasons, and Smith et al. (1999) describes some of the justifications as follows: first, this method avoids the problems of intentionally imposing service failures on customers; second, it eliminates difficulties associated with observation of service failure and recovery in the field, such as time and expense involved, and third, it minimizes memory bias, which is common in self-reports of service failures. What’s more, it also allows the best theory testing by enabling the investigator to gather all the needed customer responses in service encounters (Harris et al., 2006). The differences between the experimental groups were analyzed by a multivariate analysis of variance (MANOVA). 3.3 Sampling Plan A 2 (compensation level: high and low) X 2 (recovery customization: customization and. 25.
(35) no customization) X 2 (gender: female and male) between-subjects experimental design was used to investigate the hypotheses: the influences of two recovery dimensions (compensation level and recovery customization) on overall firm satisfaction, satisfaction with recovery, and repurchase intention. In this study, two levels of compensation (high and low) were matched with two conditions of recovery customization (customization and no customization). Different participant genders (male and female) were viewed as a moderator which influenced the relationship between recovery, satisfaction, and repurchase intention. There were four kinds of scenarios in this study, since the gender of participants was not manipulated. Eighty participants were asked to participate in one of four independent scenarios independently, which meant the sample size would be 320 (80 × 4 = 320). Participants were exposed to a written scenario describing a service failure of an online bookstore. The scenarios are attached as Appendix A. Participants were told that it was a research study about consumer behavior and were given a questionnaire with four major parts. The first part participants read a short description of a service failure. In this case participants were asked to imagine that they were the fans of detective novels and had ordered two detective novels from the international online bookstore, Q-pei. However, the bookstore delayed sending the books for ten days, so participants made an enquiry by telephone. Next, participants read a scenario describing one of four recovery strategies which consisted of different levels of compensation and customization. The second and third parts contained. 26.
(36) questions which measured participants’ overall firm satisfaction (OS), satisfaction with recovery (SR), and their repurchase intentions (RI) after recovery. The fourth part contained demographic information. The questionnaire is attached as Appendix B. 3.4 Measurement 3.4.1 Compensation Level There were two compensation levels in this study, high and low. The specific definition of compensation level in this study was “the ratio of outcomes to inputs of an exchange.” As the high level of compensation, the online bookstore sent an additional book, worth about 50% of the total cost, but as low compensation level, the bookstore sent two more bookmarkers, which were worth about 3–4% of the total cost. Four items were constructed for this study. Two of them were Likert-type scales and the other two were checked on a 1–7 (highly low/highly high and highly valueless/highly valuable) scale, adapted from Sparks & McColl-Kennedy (2001) in order to fit the scenario constructed for this study. The Cronbach alpha value for this scale was 0.908. A sample item would be, “The price of the compensation I received was low (price of about NT$200–250/NT$10–15).” 3.4.2 Recovery Customization Two recovery customization conditions were used in this study, customization and no customization. The specific definition of recovery customization in this study was “creating a unique bundle of service offerings based on an individual consumer’s preferences and needs”. 27.
(37) (Bettencourt & Gwinner, 1996). In the customization condition, the online bookstore sent a product affiliated to detective novels, determined by looking into customers’ past transaction records to find the customers’ possible preferences and needs. In the no customization condition, the online bookstore just offered compensation without considering customers’ preferences and needs, yet at the appropriate compensation level. Three items were adapted from scales measuring service-offering adaptive behavior in Gwinner, Bitner, Brown, & Kumar (2005). In order to fit the scenario, the items were modified for this study and anchored by “strongly disagree” to “strongly agree.” The Cronbach alpha value for this scale was 0.966. A sample item would be “Q-pei online bookstore provided me customized compensation to meet my unique need.” 3.4.3 Overall Firm Satisfaction and Satisfaction with Recovery Overall firm satisfaction and satisfaction with recovery were measured using three-item scales adapted from prior research (Bitner et al., 1990; Maxham & Netemeyer, 2002) and were anchored by “strongly disagree” to “strongly agree.” Minor modifications were made to fit the current context. A sample item of overall firm satisfaction was “As a whole, I am satisfied with Q-pei online bookstore”, and the sample item of satisfaction with recovery was “I am not satisfied with Q-pei’s handling of the delayed dispatch (send one more book/two more bookmarkers).”. 28.
(38) 3.4.4 Repurchase Intention Repurchase intention was measured using a three-item scale adapted from Blodgett, Granbois, & Walters (1993). Cronbach’s alpha for this scale was 0.936, which meant it was reliable. Minor modifications were mad to fit the current context. “I would be willing to purchase from Q-pei online bookstore again” was a sample item. 3.5 Data Collection Data were gathered from 40 participants in the pilot study and 320 participants in the official study. To ensure the generalization of the study, the sample was composed of undergraduate students and general public. Data were collected through two major channels, one by distributing the questionnaires to the students of National Chiao Tung University (NCTU) and Taipei Municipal University of Education (TMUE), and the other to employees of Formosa Plastics Group by convenience sampling. Four questionnaires of different scenarios were mixed and were given to participants randomly. Participants were informed of the purpose of this study at the beginning and then were asked to react as thought the scenario had just happened to them. 3.6 Manipulation Check Realism in the scenario description was measured via a two-item, Likert-type scale (“This story reflects what might happen in the real world” and “This story reflects what might happen in the real world”). The mean rating was 5.43; a mean rating of above 4 meant the. 29.
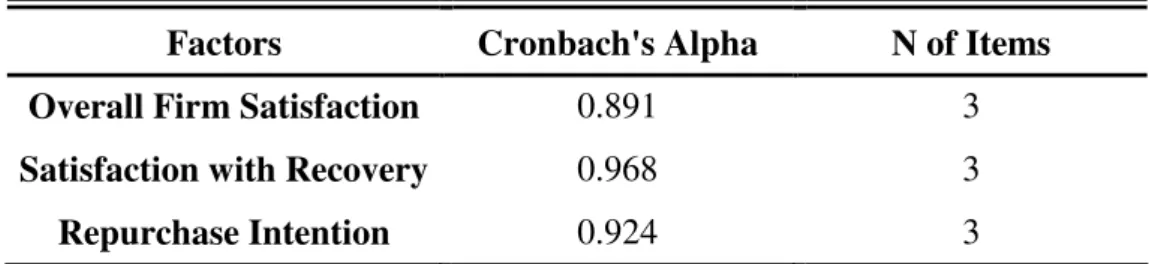
(39) scenarios were realistic. The effectiveness of the independent variable manipulations (high compensation level/low compensation level and customization/no customization) was assessed by comparing the means in each condition. The results of the manipulation are reported in Chapter 4. 3.7 Pretest A pilot study was conducted to test the realism of the scenario, and the validity and reliability of the questionnaire. By conducting a pilot study, any problems or the misunderstandings inherent in the experimental design could be modified before conducting the main study. There were five pilot studies. In the third pilot study, two recovery scenarios of low compensation level, which offered customers a pen, were added in order to examine the effectiveness of manipulating the compensation level (bookmarks and pens), and then choose the better one for the main study. Since participants responded that it was hard to imagine and decide on the quality and price of recovery after the third pilot study, the picture and specific price of recovery were showed in the scenario of the fourth pilot study. In this study too, the impact of compensation level and customization on customer satisfaction were not significant. Since the dependent variable in this study was recovery satisfaction, it was assumed that participants would confuse recovery satisfaction with overall firm satisfaction which was evaluated by multiple transaction experiences. Thus, in the fifth pilot study, customer satisfaction items were divided into two categories, overall firm satisfaction and. 30.
(40) satisfaction with recovery. After modifying the scenario and item descriptions, the result of the fifth pilot study was successful. In this study, 40 participants were randomly assigned to the four experimental conditions. Participants were informed of the purpose of this study at the beginning and then were reminded that they should assume the scenario had just happened to them. There were 19 male and 21 female participants, and 32 of 40 participants were students. As can be seen in Table 1, the reliability of the overall firm satisfaction scales was 0.891, the reliability of the satisfaction with recovery scales was 0.968, and the reliability of the repurchase intention scale was 0.924. All reliabilities of scales were higher than 0.7, and there was significant difference between high and low compensation level group (p<0.00). The difference between the groups for recovery customization and no recovery customization was also significant, too (p<0.00). When overall firm satisfaction (OS), satisfaction with recovery (SR), and repurchase intention (RI) served as the dependent variables, the result from MANOVA showed that compensation level and recovery customization both had a positive impact on all dependent variables. When satisfaction with recovery (SR) served as the dependent variable, the result from MANOVA showed that an interaction existed between compensation level and customization. Taken together, these results suggested that our manipulations for compensation level and recovery customization were effective.. 31.
(41) Table 1 Reliability Statistics of Pretest Factors. Cronbach's Alpha. N of Items. Overall Firm Satisfaction. 0.891. 3. Satisfaction with Recovery. 0.968. 3. Repurchase Intention. 0.924. 3. 32.
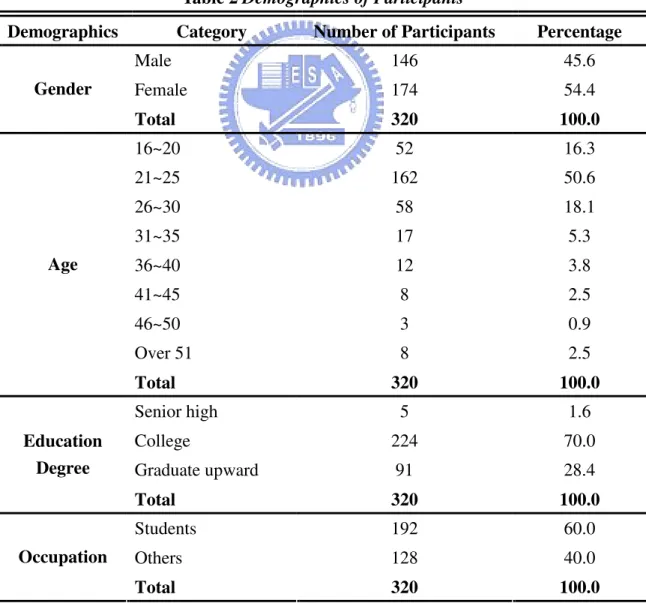
(42) Chapter 4 Research Analysis and Results 4.1 Background of Participants Of the total samples of 320 participants, 60.0% were students, 54.4% were female, 50.6.% were between 21 and 25 years old, 70.0% had college degree, 28.4% had graduate or higher degrees, and 52.5% had an income of less than NT10,000 per month. All the demographics of participants are listed in Table 2.. Table 2 Demographics of Participants Category. Number of Participants. Percentage. Male. 146. 45.6. Female. 174. 54.4. Total. 320. 100.0. 16~20. 52. 16.3. 21~25. 162. 50.6. 26~30. 58. 18.1. 31~35. 17. 5.3. 36~40. 12. 3.8. 41~45. 8. 2.5. 46~50. 3. 0.9. Over 51. 8. 2.5. 320. 100.0. 5. 1.6. College. 224. 70.0. Graduate upward. 91. 28.4. Total. 320. 100.0. Students. 192. 60.0. Others. 128. 40.0. Total. 320. 100.0. Demographics Gender. Age. Total Senior high Education Degree. Occupation. 33.
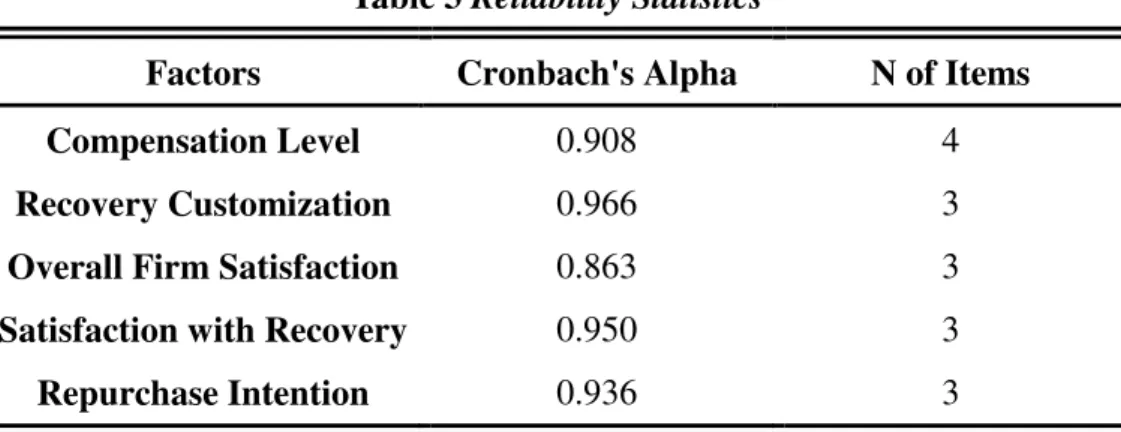
(43) Less than 10,000. 168. 52.5. 10,001~30,000. 57. 17.8. 30,001~50,000. 56. 17.5. 50,001~70,000. 20. 6.3. 70,001~90,000. 8. 2.5. More than 90,001. 11. 3.4. Total. 320. 100.0. Experience of Online Shopping. Yes. 283. 88.4. No. 37. 11.6. Total. 320. 100.0. Experience of Online Bookstore Shopping. Yes. 221. 69.1. No. 99. 30.9. Total. 320. 100.0. Income per Month. 4.2 Reliabilities The reliabilities of all constructs in this research were tested with Cronbach’s alpha. Table 3 shows that reliabilities were all above 0.7 across all factors which means the high internal consistency of each item of the same factor. Table 3 Reliability Statistics Factors. Cronbach's Alpha. N of Items. Compensation Level. 0.908. 4. Recovery Customization. 0.966. 3. Overall Firm Satisfaction. 0.863. 3. Satisfaction with Recovery. 0.950. 3. Repurchase Intention. 0.936. 3. 34.
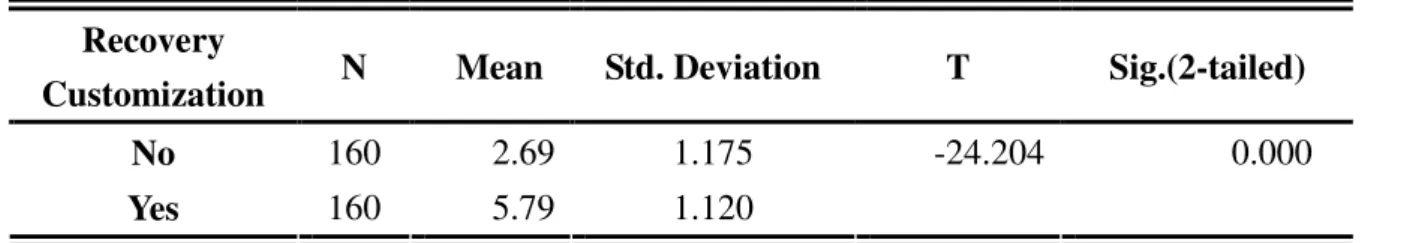
(44) 4.3 Manipulation Checks Manipulation checks were examined with an independent-samples T-test. The test showed that high compensation level was significant higher than low compensation level (p < 0.000), which meant that the manipulation of compensation level is successful. The results are shown in Table 4. Table 4 Manipulation Check of Compensation Level Compensation Level. N. Low. 160. 2.74. 0.961. High. 160. 4.88. 0.978. Mean. Std. Deviation. T -19.730. Sig.(2-tailed) 0.000. With recovery customization as the independent variable, the result of an independent samples T-test showed that customization was significant higher than no customization (p < 0.000), which meant that the manipulation of recovery customization was successful. The results are shown in Table 5. Table 5 Manipulation Check of Recovery Customization Recovery Customization. N. No. 160. 2.69. 1.175. Yes. 160. 5.79. 1.120. Mean. Std. Deviation. T -24.204. Sig.(2-tailed) 0.000. 4.4 Analysis of Results After assuring the manipulation, reliability of the analyzed data, the study proceeded to conduct ANOVA and MANOVA. 35.
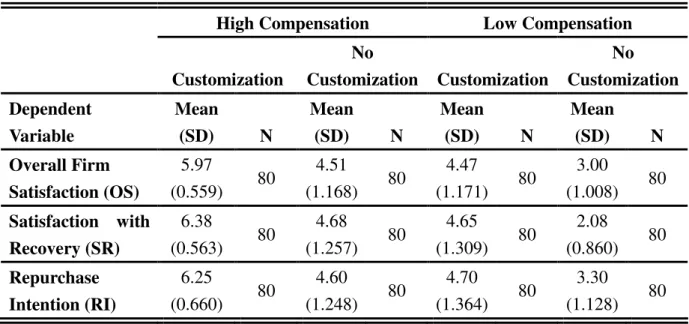
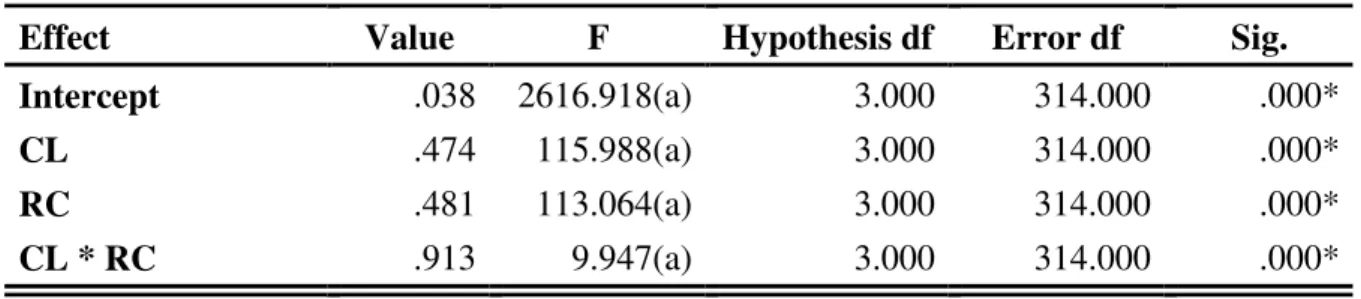
(45) 4.4.1 Effects of Compensation Level on Overall Firm Satisfaction, Satisfaction with Recovery, and Repurchase Intention To examine whether compensation level (CL) affected overall firm satisfaction (OS), satisfaction with recovery (SR), and repurchase intention (RI). In Chapter 2, H1a, H1b, and H1c assumed that compensation level (CL) was positively related to overall firm satisfaction (OS), satisfaction with recovery (SR), and repurchase intention (RI). Table 6 shows the descriptive statistics of compensation level and recovery customization. Table 7 shows the result of MANOVA: the main effect of compensation level (CL) and recovery customization (RC) and the interaction was significant. From Table 8, 9, and 10, the main effect of compensation level (CL) on overall firm satisfaction (OS), satisfaction with recovery (SR), and repurchase intention (RI) were significant (F = 177.070, 345.196 and 126.790, p < 0.000). Thus, H1a, H1b, and H1c were supported. Table 6 Descriptive Statistics High Compensation. Low Compensation. Customization. No Customization. Customization. No Customization. Dependent Variable. Mean (SD). Mean (SD). Mean (SD). Mean (SD). Overall Firm Satisfaction (OS). 5.97 (0.559). 80. 4.51 (1.168). 80. 4.47 (1.171). 80. 3.00 (1.008). 80. Satisfaction with Recovery (SR). 6.38 (0.563). 80. 4.68 (1.257). 80. 4.65 (1.309). 80. 2.08 (0.860). 80. Repurchase Intention (RI). 6.25 (0.660). 80. 4.60 (1.248). 80. 4.70 (1.364). 80. 3.30 (1.128). 80. N. 36. N. N. N.
(46) Table 7 Overall MANOVA: Overall Firm Satisfaction, Satisfaction with Recovery, and Repurchase Intention Effect. Value .038 .474 .481 .913. Intercept CL RC CL * RC. F. Hypothesis df. 2616.918(a) 115.988(a) 113.064(a) 9.947(a). Error df. 3.000 3.000 3.000 3.000. 314.000 314.000 314.000 314.000. Sig. .000* .000* .000* .000*. a Exact statistic b Design: Intercept + CL + RC + CL * RC Note: CL represents compensation level; RC represents recovery customization. Table 8 Tests of Compensation Level and Recovery Customization Source Corrected Model Intercept CL RC CL * RC Error Total Corrected Total. Type III Sum of Squares 353.124 6438.068 182.006 171.112 0.006 324.808 7116.000 677.932. df 3 1 1 1 1 316 320 319. Mean Square 117.708 6438.068 182.006 171.112 0.006 1.028. F 114.516 6263.477 177.070 166.472 0.005. Sig. 0.000* 0.000* 0.000* 0.000* 0.941. (Dependent Variable: Overall Firm Satisfaction) R Squared = .521 (Adjusted R Squared = .516) Note: CL represents compensation level; RC represents recovery customization. 37.
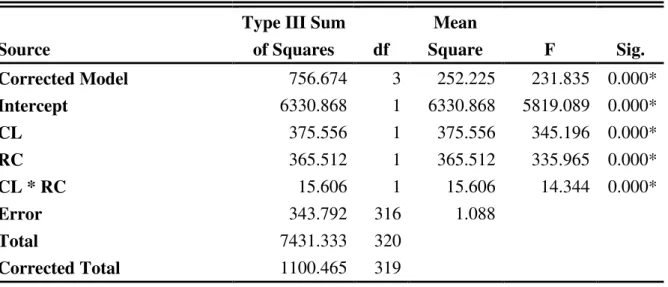
(47) Table 9 Tests of Compensation Level and Recovery Customization Type III Sum of Squares. Source Corrected Model Intercept CL RC CL * RC Error Total Corrected Total. 756.674 6330.868 375.556 365.512 15.606 343.792 7431.333 1100.465. df 3 1 1 1 1 316 320 319. Mean Square 252.225 6330.868 375.556 365.512 15.606 1.088. F 231.835 5819.089 345.196 335.965 14.344. Sig. 0.000* 0.000* 0.000* 0.000* 0.000*. (Dependent Variable: Satisfaction with Recovery) R Squared = .688 (Adjusted R Squared = .685) Note: CL represents compensation level; RC represents recovery customization. Table 10 Tests of Compensation Level and Recovery Customization Source Corrected Model Intercept CL RC CL * RC Error Total Corrected Total. Type III Sum of Squares 348.735 7100.168 162.450 185.035 1.250 404.875 7853.778 753.610. df 3 1 1 1 1 316 320 319. Mean Square 116.245 7100.168 162.450 185.035 1.250 1.281. F 90.728 5541.595 126.790 144.417 0.976. Sig. 0.000* 0.000* 0.000* 0.000* 0.324. (Dependent Variable: Repurchase Intention) R Squared = .463 (Adjusted R Squared = .458) Note: CL represents compensation level; RC represents recovery customization. 38.
(48) 4.4.2 Effects of Recovery Customization on Overall Firm Satisfaction, Satisfaction with Recovery, and Repurchase Intention To examine the effects of recovery customization (RC) on overall firm satisfaction (OS), satisfaction with recovery (SR), and repurchase intention (RI). In chapter 2, H2a, H2b, and H2c assumed that recovery customization (RC) was positively related to overall firm satisfaction (OS), satisfaction with recovery (SR), and repurchase intention (RI). From Tables 8, 9 and 10, the main effect of recovery customization (RC) on overall firm satisfaction (OS), satisfaction with recovery (SR), and repurchase intention (RI) were significant (F = 166.472, 333.965 and 144.417, p < 0.000). Thus, H2a, H2b, and H2c were supported. 4.4.3 Interaction between Compensation Level and Recovery Customization To examine whether there was any interaction between compensation level (CL) and recovery customization (RC) on overall firm satisfaction (OS), satisfaction with recovery (SR), and repurchase intention (RI), MANOVA and ANOVA was used to test H3a, H3b, and H3c. The results are given in Tables 8, 9 and 10, and show that there was an interaction between compensation level (CL) and recovery customization (RC) on satisfaction with recovery (SR) (F = 14.344, p < 0.000), but not on overall firm satisfaction (OS) and repurchase intention (RI) (F = 0.005 and 0.976, p < 0.941 and 0.324). Recovery customization (RC) increased the strength of the relationship between compensation level (CL) and. 39.
(49) satisfaction with recovery (SR). As Figures 4 and 6 show, although the recovery which was customized with high compensation level reached the highest overall firm satisfaction (OS) and repurchase intention (RI), the difference of overall firm satisfaction (OS) and repurchase intention (RI) that recovery customization increased was not significant. Nevertheless, as Figure 5 shows, the recovery which was customized with high compensation level reached the highest satisfaction with recovery (SR). In addition, the difference of satisfaction with recovery (SR) that recovery customization increased was significant. Thus, H3b was. Mean (Overall Firm Satisfaction). supported, but H3a and H3c were not supported.. 6. 5.97. No Customization Customization. 5 4.51. 4.47 4. 3. 3.00. 2 Low. High. Compensation Level Figure 4 The Interaction between Compensation Level and Recovery Customization on Overall Firm Satisfaction. 40.
(50) No Customization. Mean (Satisfaction with Recovery). 7. 6.38. Customization. 6 5. 4.65. 4.68. 4 3 2. 2.08 Low High Compensation Level. Figure 5 The Interaction between Compensation Level and Recovery Customization on Satisfaction with Recovery. Mean (Repurchase Intention). 7. No Customization 6.25. Customization. 6. 5. 4.70. 4.60. 4. 3.30 3. Low High Compensation Level Figure 6 The Interaction between Compensation Level and Recovery Customization on Repurchase Intention. 41.
(51) Table 11 Multiple Comparisons (LSD) (I) GROUP 1. 2. 3. 4. (J) GROUP. Mean Difference (I-J). 2 3 4 1 3 4 1 2 4 1 2 3. Std. Error. Sig.. 1.45* 1.50* 2.97* -1.45*. 0.160 0.160 0.160 0.160. 0.000 0.000 0.000 0.000. 0.05 1.52* -1.50*. 0.160 0.160 0.160. 0.775 0.000 0.000. -0.05 1.47* -2.97* -1.52* -1.47*. 0.160 0.160 0.160 0.160 0.160. 0.775 0.000 0.000 0.000 0.000. (Dependent Variable: Overall firm Satisfaction) Based on observed means. * The mean difference is significant at the .05 level. Note: 1 represents high compensation level and customization; 2 represents high compensation level and no customization; 3 represents low compensation level and customization; and 4 represents low compensation level and no customization.. To test overall firm satisfaction (OS), satisfaction with recovery (SR), and repurchase intention (RI) are insignificant different whether the recovery was not customized with high compensation level or was customized with low compensation level, which were hypothesized in H4a, H4b, and H4c, one-way ANOVA with four levels was conducted. Tables 11, 12, and 13 show that there were no significant differences of overall firm satisfaction (OS), satisfaction with recovery (SR), and repurchase intention (RI) between the recovery which was not customized with high compensation level, and the recovery which. 42.
(52) was customized with low compensation level. Thus, H4a, H4b, and H4c were supported.. Table 12 Multiple Comparisons (LSD) (I) GROUP 1. 2 ` 3. 4. (J) GROUP. Mean Difference (I-J). 2 3 4 1 3 4 1 2 4 1 2 3. Std. Error. Sig.. 1.70* 1.73* 4.30* -1.70*. 0.165 0.165 0.165 0.165. 0.000 0.000 0.000 0.000. 0.03 2.61* -1.73*. 0.165 0.165 0.165. 0.860 0.000 0.000. -0.03 2.58* -4.30* -2.61* -2.58*. 0.165 0.165 0.165 0.165 0.165. 0.860 0.000 0.000 0.000 0.000. (Dependent Variable: Satisfaction with Recovery) Based on observed means. * The mean difference is significant at the .05 level. Note: 1 represents high compensation level and customization; 2 represents high compensation level and no customization; 3 represents low compensation level and customization; and 4 represents low compensation level and no customization.. 43.
(53) Table 13 Multiple Comparisons (LSD) (I) GROUP 1. 2. 3. 4. (J) GROUP. Mean Difference (I-J). 2 3 4 1 3 4 1 2 4 1 2 3. Std. Error. Sig.. 1.65* 1.55* 2.95* -1.65*. 0.179 0.179 0.179 0.179. 0.000 0.000 0.000 0.000. -0.10 1.30* -1.55*. 0.179 0.179 0.179. 0.593 0.000 0.000. 0.10 1.40* -2.95* -1.30* -1.40*. 0.179 0.179 0.179 0.179 0.179. 0.593 0.000 0.000 0.000 0.000. (Dependent Variable: Repurchase Intention) Based on observed means. * The mean difference is significant at the .05 level. Note: 1 represents high compensation level and customization; 2 represents high compensation level and no customization; 3 represents low compensation level and customization; and 4 represents low compensation level and no customization.. 4.4.4 Effects of Different Genders In Chapter 2, H5a, H5b, and H5c suggested that for male customers, compensation level would have a greater positive effect on overall firm satisfaction (OS), satisfaction with recovery (SR), and repurchase intention (RI) than for female customers, regardless of whether recovery was customized or not. Nevertheless, it was suggested that recovery customization would have greater positive effect on female customers’ overall firm satisfaction (OS), satisfaction with recovery (SR), and repurchase intention (RI) than on male customers’ 44.
數據
+7
相關文件
所有被訪旅客對本澳的環境衛生及觀光點均有作出評價,今年第1季的旅客對環境衛生的 滿意程度較高,有62%表示滿意;
(1)滿意 滿意 滿意 滿意 (2) 普通 普通 普通 (3) 不滿意 普通 不滿意 不滿意 不滿意 (4) 沒意見 沒意見 沒意見 沒意見.. 開放式題型的優 開放式題型的優
Department of Mathematics, National Taiwan Normal University, Taiwan..
Department of Mathematics, National Taiwan Normal University, Taiwan..
The results indicated that packaging of products which reflects local cultural characteristics has a direct and positive influence on consumers’ purchase
有感於瑞典與美國顧客滿意指標的成功經驗,屬於歐洲的顧客滿意指標 (European Customer Satisfaction Index, ECSI) 乃在官方授意下由歐洲品質組織 (European Organization for
近年來世界各主要國家,莫不致力於顧客滿意指標,以作為產業競爭力的 評量指標。如:瑞典首先在 1989 年建立包含 31 項產業的瑞典顧客滿意度氣壓 計(Fornell,
The overall students’ math scores have high positive correlation with Type C in CEEC Interest Inventory whereas showing high negative correlation with Type A.. Male students’
