行政院國家科學委員會專題研究計畫 成果報告
公平價值會計之資訊品質-金融資產分類選擇及財務危機預
測能力之證據
研究成果報告(精簡版)
計 畫 類 別 : 個別型 計 畫 編 號 : NSC 98-2410-H-151-012- 執 行 期 間 : 98 年 08 月 01 日至 99 年 07 月 31 日 執 行 單 位 : 國立高雄應用科技大學財經與商務決策研究所 計 畫 主 持 人 : 李文智 共 同 主 持 人 : 華琪筠 計畫參與人員: 博士班研究生-兼任助理人員:許玲瑛 博士班研究生-兼任助理人員:楊媚靜 報 告 附 件 : 出席國際會議研究心得報告及發表論文 處 理 方 式 : 本計畫可公開查詢中 華 民 國 99 年 10 月 29 日
行政院國家科學委員會補助專題研究計畫
□ 成 果 報 告
□期中進度報告
公平價值會計之資訊品質-金融資產分類選擇
及財務危機預測能力之證據
計畫類別:□個別型計畫 □整合型計畫
計畫編號:NSC 98-2410-H-151-012
-
執行期間: 98 年 8 月 1 日至 99 年 7 月 31 日
執行機構及系所:國立高雄應用科技大學商務經營研究所
計畫主持人:李文智
共同主持人:華琪筠
計畫參與人員:楊媚靜、許玲瑛
成果報告類型(依經費核定清單規定繳交):□精簡報告□完整報告
本計畫除繳交成果報告外,另須繳交以下出國心得報告:
□赴國外出差或研習心得報告
□赴大陸地區出差或研習心得報告
□出席國際學術會議心得報告
□國際合作研究計畫國外研究報告
處理方式:
除列管計畫及下列情形者外,得立即公開查詢
□涉及專利或其他智慧財產權,□一年□二年後可公開查詢
中 華 民 國 99 年 10 月 29 日
計畫中文摘要 會計準則的制訂與修改一直以來以會計資訊品質及資訊的有用性最為最大 的標竿。自全球金融風暴以來,證券市場價格不斷下跌,在惡性循環下,曝險較 深的機構面臨步上破產的結局,因此金融機構及市場參與者認為公平價值會計將 加速經濟衰退,要求暫停適用或修改公平價值會計之規定,並呼籲對無活絡市場 之金融工具應回復以歷史成本法評價。美國財務會計準則及國際會計準則,對公 平價值會計作了一些緊急修改或澄清,允許在某些條件下,掛在「交易目的」項 下的金融資產,可重新分類到「非交易目的」(「備供出售」或「持有至到期日」)。 本研究針對公平價值會計 34 號公報二次修法後對於我國之政策性效果為 何,本研究將以投資人關心的資訊品質兩個面向著手進行討論,第一個研究目的 在探討從企業所面臨的風險角度來探討金融商品投資分類決策以及 34 號二修後 的重分類決策,第二個研究目的在分析 34 號公平價值會計的採用及現階段修法 下所提供的會計資訊如何影響財報資訊預測企業破產程度的能力。 迴歸結果分析顯示,研究結果支持管理當局利用此次機會以極小化資產流 動性風險或極小化會計波動,表示主管機關在制定會計準則時應考慮經理人員可 能的反應。此外,以會計資訊為基礎的預測破產能力,仍能有效預測公司的破產 危機,顯示會計資訊的有用性。 關鍵詞:公平價值會計、會計資訊、破產
Abstract
The main objective of continuous amendments to accounting standards is to let financial statements become more informative and more transparent. Because of the global financial crisis and the collapse of the securities market, corporations with high risk characters exposure to bankrupt. Thus, financial institutions and market participations blame fair value accounting for crisis, and lobby on cost basis accounting. The SFAS and the IAS issued a clarification of the rules to say that entities are permitted to reclassify securities out of the trading category to available-for-sale or held-to-maturity portfolios in specific circumstances.
The study investigates the following two problems: whether the fair value accounting is suitable for Taiwan, and what the political effect of the second amendment to No.34 could be. Therefore, our first objective is to test risk-based explanations for investment classification and reclassification decisions under No.34. The second objective is to examine secular change in the ability of financial information to predict bankruptcy under the continuous amendment to No.34.
Results show that management tradeoff between liquidity risk and accounting volatility risk when making classification decisions under the second amendment to No. 34 which increases in the degree of discretions. Besides, applying the Hazard Model by Shumway(2001)to our study, this study finds the predictive power from financial information. These two aspects of the study could give us the empirical evidence for clarifying standards amendments toward fair-value orientation let the information quality become well or not thing but worse.
Keywords: Fair value accounting, Accounting information, Bankruptcy
一、前 言 本研究主要的目的在探討會計資訊的攸關性是否隨著對公平價值導向的會 計準則制訂及修改逐漸消失中。會計準則的制訂與修改一直以來以會計資訊品質 及資訊的有用性最為最大的標竿。近幾十年來公平價值會計為導向的會計準則立 法及修法一直努力降低對資訊有用性之損害,然而金融市場之崩潰,使得一些金 融機構質疑是否公平價值提供了有用的資訊,以作投資及信用決策?自從房利美 及房地美的次級房貸風暴,以及 9 月雷曼(Lehman Brothers Holdings)及 AIG (American International Group)等金融機構相繼出事並引發全球金融海嘯後,按 市價入帳(Mark To Market)這個爭議已久的會計準則又浮上了檯面。 在歐美銀行業及政治的強大壓力下,美國財務會計準則及國際會計準則, 對公平價值會計作了一些緊急修改或澄清,允許在某些條件下,掛在「交易目的」 項下的金融資產,可重新分類到「非交易目的」(「備供出售」或「持有至到期日」)。 這將允許金融機構的資產評價損失可以暫時不必列入損益表,使得企業虧損壓力 將可大幅獲得紓解。而配合國際會計準則公報第39 號之修正,我國亦立刻跟進 修正金融商品重分類之會計處理。修正後規定,除原始指定以公平價值入帳者及 衍生性商品等外,若企業不再以短期內出售為目的,且符合下列所訂條件者,可 重分類為其他類別之金融資產:(一)債權性質之金融資產符合放款及應收款定義 (如無活絡市場之債券投資),且持有者有意圖及能力持有該金融資產至可預見之 未來或到期日,例如:改分類到持有至到期日之金融資產或無活絡市場之債券投 資;(二)至於股權類或有活絡市場之債權商品,於極少情況下(如不尋常及近期內 高度不可能再發生),可分類至其他類別之金融資產。 因此,綜上所述,針對公平價值會計是否適用於我國,以及34 號公報二次 修法對於我國之政策性效果為何,本研究將以投資人關心的資訊品質兩個面向著 手進行討論,一為從裁量權角度著手觀測企業的本身所面臨風險對公平價值會計 選擇影響,一為從公平價值會計之資訊攸關性切入探討不同階段會計資訊對正確 預測財務困難的有用性程度。 二、研究目的 本研究第一個研究目的在探討從企業所面臨的風險角度來探討金融商品投 資分類決策以及34 號二修後的重分類決策。當企業選擇將證券分類為以公平價 值入帳者或備供出售者時,公平價值會計被採用,未實現市價變動損益將列入損 益表或業主權益項下,將使得主要會計數字像是業主權益以及總資產金額,暴露 在高度的波動中(Beatty, Chamberlain, and Magliolo, 1996; Hodder, Kohlebeck, and McAnally, 2002)。而另一方面分類到持有至到期日或無活絡市場之其他分類,企 業將面臨持有該項金融資產的流動性風險。因為會計準則對於非採用公平價值會
計之其他分類做了某些出售交易限制。因此本研究認為當企業管理當局想要極小 化資產流動性風險時,便會選擇將大部分比例資產分類到採公平價值法之會計處 理,相反的當管理當局想要極小化會計波動時便會將大部分比例資產分類為持有 至到期日或無活絡市場之其他分類(Beatty, Chamberlain, and Magliolo, 1996; Godwin, Petroni, and Wahlen, 1998)。
本研究第二個研究目的在分析34 號公平價值會計的採用及現階段修法下所 提供的會計資訊如何影響財報資訊預測企業破產程度的能力。 本研究將以財務會計準則第27 號公報施行之年度 1997 年到 2009 年之年報 資料,輔以2006 年 34 號公報政策施行以及 2008 年 10 月 34 號公報二修前後為 臨界點分割成三個階段:歷史成本法、公平價值會計法及公平價值會計修正等三 階段分析,從分析會計波動容忍度以及流動性風險間的取捨(trade-off),對會計 分類之影響探討新制給予企業分類裁量度的政策效果,推估資訊品質在公平價值 為導向的會計準則修訂過程中,到底是獲得改善還是品質受到損害;此外,參考 Shumway(2001)的作法,利用 Hazard Model,分析會計資訊與破產預測能力間 關聯性效果之差異性。
三、文獻探討
1.影響金融資產會計分類之研究
美國自 1993 年發布 Statement of Financial Accounting Standards(SFAS) No.115 “Accounting for Certain Investments in Debt and Equity Securities”,要求公 司將其金融資產區分成以交易為目的、備供出售、以及持有至到期日等三類。此 公報施行後,公司需依公報規定將其金融資產分類,並依其會計處理入帳。
自SFAS No.115 施行後, Beatty, Chamberlain and Magliolo(1996)發現 SFAS No.115 早採行者(December 31, 1993)與晚採行者(January 1, 1994)行為並不 相同,其中早採行者係為增加其股東權益。此外,Beatty, Chamberlain and Magliolo 亦發現備供出售投資組合與減少股東權益變動性、維持流動性與利率風險彈性、 影響盈餘等有顯著相關。Hodder, Kohlebeck and McAnally(2002)則由管制成本 的角度檢視SFAS No.115 施行前後對公司管理當局決策的影響,研究結果發現, (1)若忽略採行的時點,銀行業分類過少的金融資產於備供出售證券,(2)較 早採用準則的銀行,分類過多的金融資產於備供出售證券,(3)隨著利率風險與 信用風險提升,證券投資組合的規模亦隨之改變,(4)採行 SFAS No.115 後,銀 行放款的利率風險亦隨之增加。整體而言,其結果顯示SFAS No.115 實行後對公 司會計及經濟結果產生影響。 一般認為,公平價值會計較能提供攸關的資訊。早在SFAS No.115 施行前,
SFAS No.107 就已要求公司揭露部分金融商品的市價資訊,Barth, Beaver and Wolfson(1990)檢視是否證券投資整體而言,除了盈餘之外,對公司的市值對 帳面價值比是否具有增額解釋能力。在以150 家銀行為樣本研究後發現,並不具 增額解釋能力。Barth(1994)探討所有證券的公平市價是否可以解釋銀行的股 價以及年度股價報酬,Barth 以 1990 年 Compustat 的銀行股為樣本後發現,公平 市價的確能解釋股價,但市價差異(即市價與帳面價值的差異)並無法解釋公司 股價報酬。
而Godwin, Petroni, and Wahlen(1998)以保險公司為研究對象,觀察保險 公司在SFAS No.115 公報施行後,分類至持有至到期日的證券是否與公司的流動 性風險與盈餘變動(volatility)風險有關。關於流動性風險,作者們以營業活動 現金流量的變異數、持有至到期日證券的週轉率做為替代變數;盈餘變動風險則 以總資產報酬率、總資產報酬率的變異數當作替代變數。研究結果顯示這些替代 變數得值愈高,則更不會將證券歸類為持有至到期日。 2.財務資訊與破產預測之關聯性研究 過去許多文獻探究預測公司財務破產的可能因素(Beaver, 1966; Altman, 1968; Pinches, Mingo and Caruthers, 1973; Zavgren, 1985)。早期的研究中,Beaver (1966)以分析破產公司與繼續經營公司的財務比率模式,進而找出預測公司財 務破產的財務比率;相類似地,Altman(1968)則是以財務比率的線性組合,訂 出一個標準,以判斷公司是否可能財務破產。他們的研究結果之後廣為實務界及 學術界所引用,而形成一股風潮。
之後Pinches, Mingo and Caruthers(1973)則自一群財務比率中,選出可能 的預測因素。他們就48 個可能因素中,以因素分析的方式,選取出 7 個有預測 力的比率,分別是:投資報酬率、資本密集度、存貨、應收帳款、財務槓桿、短 期流動性與現金部位等。Zavgren(1985)進一步以 Pinches et al.的研究結果,推 導出公司財務困難的機率模式,公司管理當局或財務分析人員則可據以推出公司 某項財務決策對公司破產機率的影響為何。例如某一決策使其中一個比率變好, 但不影響其他比率,則表示此決策對破產經率的影響。 四、研究設計 針對從企業所面臨的風險角度來探討金融商品投資分類決策以及34 號二修 後的重分類決策,本研究將透過跨期間的迴歸分析檢測企業證券投資被分類到持 有至到期日以及其他無流動性市場分類之證券占所有金融商品投資之比例與流 動性風險以及會計波動容忍度的關聯性,本研究修正Godwin, Petroni and Wahlen (1997)之研究模式,建立迴歸模型形成本研究設計如下:
%HTMt=a+b*VARCASHt - 1+c*AVGTURNt - 1+d*STRENGTHt
+e*AVGROAt - 1+f*VARROAt - 1+g*LOG(ASSETS)t+et
( 式 一 ) 其中%HTMt 指的是持有至到期日以及其他無活絡市場分類之證券者占所 有金融商品投資之比例,VARCASH 是營業活動現金流量以總資產平減後之比 率的變異數,AVGTURN 以出售金融商品投資除以前期總金融商品投資金額, STRENGTH 衡量的是企業的信用評等指數,數字愈低表示信用愈佳,AVGROA 是指平均資產報酬率,VARROA 是資產報酬率的變異數,LOG(ASSETS)以總資 產取自然對數衡量,INDUSTRY 指的則是企業產業別。本研究認為因為會計原 則對於持有至到期日以及其他無流動性市場分類之證券的交易限制,例如:如果 分類為持有至到期日者,任意出售則將限制於三年內相類似性質之金融資產將不 得再分類為持有至到期日,企業對資產流動性需求將影響投資分類。此外本研究 假設也推估會計波動將是影響投資分類或重分類的因素,因為會計波動將帶來資 本危機,當使用公平價值會計時股東權益和資產金額將隨之面對較高之波動性, 波動性的增加將使債權人提高資金成本要求,也將使得企業成為政策及政府管理 機構的監管對象而必須強制修改某些內部監督機制例如:紅利計畫、資金配置方 法及公司治理程序等,這都將付出額外之成本。 本研究以財務會計準則第27 號公報施行之年度 2005 年到 2008 年,其中以 2005 年 34 號公報政策施行前為第一階段,探究歷史成本法下會計資訊對破產之 預測能力;以34 號公報政策施行後至 2008 年 10 月 34 號公報二修前(2006-2007 年)為第二階段,探討改採公平價值會計法後對破產模型之影響,再以其後(2008 年)為第三階段,分析修正後公平價值法是否提高或減低破產模型之預測能力。 針對會計資訊比率與企業破產預測能力之關聯性,本研究採用參考 Beaver, McNichol and Rhie(2005)利用 Shumway(2001)所提出之 Hazard Model 來檢定:
lnhj(t) =α(t) +BXj (t) (式二)
此模型中hj(t)表示企業依然存活當年之破產風險,α(t) 表示財務危機發生 的基線值,B 表示模型之未知係數向量,Xj (t)代表本研究所觀測之財務比率變數 矩陣。破產風險機率定義為以概似機率表示(likelihood odds ratio),而危機發生 的基本機率為模型之截距項。模型以羅吉斯(logit)模型利用最大概似法估計。 自變數資料包含企業所有歷史年度至宣告破產前一年之所有資料,主要會 計比率變數包含槓桿比率(負債除以總資產)、獲利能力變數(以資產報酬率衡 量),此外現金流量變數則以稅前息前折舊攤銷前淨利除以總負債衡量。本研究 預期槓桿比率與破產機率呈現正相關,與企業獲利能力以及現金流量呈現負相 關。
本研究將比較34 號公號修訂後,利用破產預測模型計算出之機率值的是否 可準確區分出在各階段中實際上宣告破產公司之數量,來作為預測準確性之衡 量。 五、研究結論與建議 針對研究目的一:探討從企業所面臨的風險角度來探討金融商品投資分類 決策以及34 號二修後的重分類決策,由所有年度匯總之相關係數表中可知,持 有 至 到 期 日 以 及 其 他 無 活 絡 市 場 分 類 之 證 券 佔 所 有 金 融 商 品 投 資 之 比 例 (%HTM)與公司信用評等指數(STRENGTH)呈正相關,且達到 1%顯著水準, 初步支持企業信用評等指數愈高,表示公司信用評等等級低,越不能忍受會計波 動之假設;至於持有至到期日以及其他無活絡市場分類之證券佔所有金融商品投 資之比例(%HTM)與平均資產報酬率(AVGROA)則呈現負相關,並達到 1% 顯著水準,表示公司獲利能力愈高者,其會計波動的忍受程度高,支持本研究假 設;和總資產取自然對數(LOG(ASSETS))也呈現負相關,達到 5%顯著水準。 持有至到期日以及其他無活絡市場分類之證券佔所有金融商品投資之比例 (%HTM)與其他變數相關係數方面:與營業活動現金流量以總資產平減後之比 率變異數(VARCASH)為負相關;與已出售金融商品投資佔前期總金融商品投 資金額變異數(VARTURN)和資產報酬率變異數(VARROA)皆為正相關。在 各自變數相關係數方面,所有自變數間相關係數皆遠小於 0.7,因此不會存在嚴 重共線性問題。 迴歸結果分析顯示,企業流動性風險變數VARCASH 與 AVGTURN,在 2005 年、2006 年及 2007 年、2008 年等三個階段雖然皆未達 10%顯著水準,然而正負 號卻有所不同:2005 年、2006 年及 2007 年此兩個階段,VARCASH 與 AVGTURN 正負號夾雜,然而2008 年此兩個變數全為負號,表示與%HTM 關係為負向關係, 與假設相符後,支持在容許金融商品重分類後,企業現金流量波動性較高且企業 積極從事證券投資組合操作時流動性需求較高,因此分類至持有至到期日或無活 絡市場證券的比例則會降低。 會計波動容忍度方面則顯示,不論哪一個階段,企業信用評等越差則越無 法忍受會計波動,因此公司信用評等指數(STRENGTH)皆為正數,且皆達到 1%顯著水準,表示分類至持有至到期日或無活絡市場證券的比例增加。 而平均資產報酬(AVGROA)在這三個階段中,符號皆為負數,與 Godwin, Petroni and Wahlen (1997)研究結果相符,顯示平均資產報酬率若越高者獲利越 高,越能忍受會計波動,因此分類至持有至到期日或無活絡市場證券的比例則會 較少。
相關係數顯示企業破產變數(Bankrupt)與負債比率(LTA)呈正相關、企業破產 變數(Bankrupt)與企業現金流量變數(ETL)亦呈正相關;與企業資產報酬率 (ROA)呈負相關,且皆達到 1%顯著水準。 企業破產預測 Logistic 實證結果指出企業破產機率與企業現金流量(ETL)呈 現負相關,但未達 10%顯著水準;與企業獲利能力(ROA)呈現負相關,並達 1% 顯著水準;與槓桿比率(LTA)則為正相關,且具 1%顯著水準,上述皆與研究預期 假設相符。 本研究依據上述迴歸結果係數,計算破產預測值,並將所有破產與未破產 公司之預測值合計7817 個觀察值,依破產機率高低分成 10 等分,排序愈高代表 有破產預測能力愈高,隨著排序降低其破產危機也隨著降低。在最高破產預測能 力中,有57.31%的破產公司出現破產危機,而在非破產公司組裡,則僅有 5.35% 公司可能破產。加總最高與次高破產預測能力後發現,有 82.81%的破產公司出 現破產危機,僅有 13.82%的非破產公司出現破產危機。由結果可知,以會計資 訊為基礎的預測破產能力,仍能有效預測公司的破產危機。 配合國際會計準則公報第39 號之修正,我國亦立刻跟進修正金融商品重分 類之會計處理,允許在某些條件下,掛在「交易目的」項下的金融資產,可重新 分類到「非交易目的」(「備供出售」或「持有至到期日」)。研究結果支持管理當 局利用此次機會以極小化資產流動性風險或極小化會計波動,表示主管機關在制 定會計準則時應考慮經理人員可能的反應。 此外,以會計資訊為基礎的預測破產能力,仍能有效預測公司的破產危機, 顯示會計資訊的有用性。 參考文獻
Altman, E. 1968. Financial Ratios, Discriminant Analysis, and the Prediction of Corporate Bankruptcy. Journal of Finance, 23: 589-609.
Barth, M. 1994. Fair Value Accounting: Evidence from Investment Securities and the Market Valuation of Banks. The Accounting Review : 1-25.
Barth. M., Beaver, W., and Wolfson, M. 1990. Components of Bank Earnings and the Structure of Bank Share Prices. Financial Analysts Journal: 53-60.
Beaver, W. 1966. Financial Ratios as Predictors of Failure. Journal of Accounting
Research, 4: 71-111.
Beatty, A., Chamberlain, S., and Magliolo, J. 1996. Managing Financial Reports of Commercial Banks: The Influence of Taxes, Regulatory Capital and Earnings.
Journal of Accounting Research, 33: 231-262.
Less Informative? Evidence from the Ability of Financial Ratios to Predict Bankruptcy. Review of Accounting Studies, 10: 93-122.
Godwin, N., Petioni, K., and Wahlen, J. 1998. Fair Value Accounting for Property-Liability Insurers and Classification Decisions under FAS 115.
Journal of Accounting, Auditing & Finance.
Hodder, Kohlebeck, and McAnally, 2002. Accounting Choices and Risk Management: SFAS No.115 and U.S. Bank Holding Companies. Contemporary Accounting
Research, 19: 225-270.
Pinches, G., Mingo, K., and Caruthers, J. 1973. The Stability of Financial Patterns in Industrial Organizations. Journal of Finance, 28.
Shumway, T. 2001. Forecasting Bankruptcy More Accurately: A Simple Hazard Model. Journal of Business, 74: 101-124.
Zavgren, C. 1985. Assessing the Vulnerability to Failure of American Industrial Firms: A Logistic Analysis. Journal of Business Finance and Accounting.
國科會補助專題研究計畫成果報告自評表
請就研究內容與原計畫相符程度、達成預期目標情況、研究成果之
學術或應用價值(簡要敘述成果所代表之意義、價值、影響或進一
步發展之可能性)
、是否適合在學術期刊發表或申請專利、主要發現
或其他有關價值等,作一綜合評估。
1. 請就研究內容與原計畫相符程度、達成預期目標情況作一綜合評
估
□
達成目標
□ 未達成目標(請說明,以 100 字為限)
□ 實驗失敗
□ 因故實驗中斷
□ 其他原因
說明:
2. 研究成果在學術期刊發表或申請專利等情形:
論文:□已發表 □未發表之文稿
□
撰寫中 □無
專利:□已獲得 □申請中 □無
技轉:□已技轉 □洽談中 □無
其他:(以 100 字為限)
3. 請依學術成就、技術創新、社會影響等方面,評估研究成果之學
術或應用價值(簡要敘述成果所代表之意義、價值、影響或進一
步發展之可能性)
(以 500 字為限)
本文研究結果顯示管理當局利用此次機會以極小化資產流動性風險或 極小化會計波動,此外,以會計資訊為基礎的預測破產能力,仍能有效預 測公司的破產危機。結果具有下列意涵: 首 先,公 平 價 值 會 計 較 歷 史 成 本 法 更 具 攸 關 性 已 獲 多 數 學 術 研 究 證 實,然 而,公 平 價 值 會 計 的 操 作 判 斷 仍 取 決 於 公 司 經 理 人 員 的 誘 因 , 因 此 , 日 後 相 關 會 計 準 則 修 訂 時 , 應 注 意 經 理 人 員 動 機 的 影 響,做 好 相 關 的 配 套 措 施。本 研 究 結 果 有 益 於 主 管 機 關 日 後 訂 定 公 平 價 值 會 計 處 理 時 , 可 供 參 考 的 資 訊 之 一 。 其 次 , 公 司 一 旦 破 產 , 股 票 價 值 幾 乎 無 存 , 投 資 人 將 血 本 無 歸 , 如 何 避 免 誤 觸 地 雷 股,一 直 是 投 資 決 策 相 當 重 要 的 課 題,本 研 究 探 討 會 計 資 訊 對 公 司 財 務 破 產 的 預 測 能 力,研 究 結 果 有 益 於 投 資 人 於 行 使 決 策 行 為 時 有 所 依 據 , 促 進 我 國 證 券 市 場 的 效 率 性 。 再 者 , 何 種 財 務 危 機 或 財 務 破 產 預 測 模 式 較 能 有 效 預 警,自 Beaver( 1966)的 研 究 以 來,文 獻 多 有 探 討,本 研 究 提 出 會 計 資 訊 預 測 破 產 能 力 的 情 形 , 有 助 於 豐 富 此 類 研 究 之 會 計 學 術 研 究 。 最 後 , 證 券 交 易 法 立 法 意 旨 除 發 展 國 民 經 濟 外,另 一 目 標 為 保 障 投 資,因 此 主 管 機 關 本 於 此 宗 旨,企 欲 建 立 有 效 之 預 警 系 統,例 如 於 公 開 資 訊 觀 測 站 建 立 財 務 資 訊 透 明 度 評 比 、 財 務 重 點 專 區 等 , 然 而 , 其 成 效 如 何 仍 有 賴 未 來 事 件 之 發 展 證 實,本 研 究 之 研 究 結 果 有 助 於 主 管 機 關 於 此 方 面 的 系 統 建 立 。國科會補助專題研究計畫項下出席國際學術會議心得報告
日期: 年 月 日一、參加會議經過
此一研討會有悠久歷史,每年輪流在亞太各國主辦,今年
為第十八屆,由中國科學院主辦,並有中國金融監理機關主管
官員發表演講及參與專題討論場次。此外,除了大陸本地學者
參與外,本年度亦有數百名海外代表與會,其中不少是全球金
融、經濟、財務、會計與管理等領域的知名學者或政界和企業
界的知名人士。
由於此一研討會有許多國際人士與會,申請人此次參與研
討會並發表論文,本次會議之論文有機會被收錄在下列重要國
際期刊:
1. Review of Quantitative Finance and Accounting (RQFA)
計畫編號
NSC 98-2410-H-151-012
-
計畫名稱
公平價值會計之資訊品質-金融資產分類選擇
及財務危機預測能力之證據
出國人
員姓名
李文智
服務機構
及職稱
國立高雄應用科技大
學商務經營研究所
會議時間
99 年 7 月 22 日
至 99 年 7 月 27
日
會議地點
中國 北京
會議名稱
(中文)第十八屆亞太金融、經濟、財務與管理研討
會
(英文) The 18th Annual Conference on PBFEAM
發表論文
題目
(中文)最低稅負制與盈餘管理之探討
(英文)
Earnings Management under Taiwan’s Alternative Minimum Tax System(FLI)(國科會 A 級期刊)
2. Review of Pacific Basin Financial Markets and Policies
(RPBFMP) (國科會 B 級期刊)
3. Advances in Quantitative Analysis of Finance and Accounting
(AQAFA)(國科會 B 級期刊)
4. Advance In Investment Analysis And Portfolio Management
(AIAPM) (國科會 B 級期刊)
5.International Journal of Information Technology and Decision
Making (IJITDM)
申請人此次出席研討會,除了發表學術論文外,申請人亦
參與專題演講、論文發表及專題討論等場次。在申請人此次發
表論文的場次中,除了所發表的文章-Earnings Management
under Taiwan’s Alternative Minimum Tax System-獲得其他與會
國內外學者的建設性意見外,申請人不論在發表場次或參與其
他場次,亦吸收、分享其他發表人的研究構想,並參與討論及
交換意見與研究心得。而在演講及專題討論等場次,除了吸收
資深知名學者的研究菁華,並對當前國際相關財經議題有了更
深入的了解。
二、與會心得
在此次研討會舉辦期間,申請人碰到許多來自台大、中國
科學院、北大、成大、交大與中山大學等資深學者,除了在研
討會場次中分享其研究構想,申請人亦利用研討會休息時間向
前輩們請益,吸取其寶貴建議。除了台灣、大陸學者之外,申
請人此次也認識了美國伊利諾大學等學者。申請人此次北京之
行,除了利用會議時間與其他學者做意見交流外,也與部分國
內外學者約好,將來回國後做進一步討論並尋求未來合作研究
的機會,相信對提升個人的研究能量有所助益,這也是此行一
大收穫。
三、考察參觀活動(無是項活動者略)
無
四、建議
希望日後能提高補助參與國外研討會經費的頻率與額度,或
補助在台舉辦國際研討會,吸引國際知名學者來台交流。
五、攜回資料名稱及內容
主辦單位發給每位註冊者一份光碟及手冊。
六、其他
無
Earnings Management under Taiwan’s Alternative
Minimum Tax System
Shu-Hua Lee
Assistant Professor, Department of Accounting
National Taipei University
Wen-Chih Lee
Professor, Graduate Institute of Commerce
National Kaohsiung University of Applied Sciences
Tzong-Huei Lin*
Assistant Professor, Department of Accounting
National Kaohsiung University of Applied Sciences
Yann-Ching Tsai
Professor, Department of Accounting
National Taiwan University
*Contact author:
Tzong-Huei Lin
Department of Accounting
National Kaohsiung University of Applied Sciences
No. 415, Jiangong Road, Sanmin District
Kaohsiung City, Taiwan 80778
Tel: (886)-7-3814526#6604
Fax:(886)-7-3832344
Abstract
To raise tax revenue and to encourage social justice, Taiwan adopted the alternative minimum tax system in 2006. Because the alternative minimum tax system increases shareholders’ overall tax burden, shareholders’ wealth can be increased if their firms manage to recognize a portion of taxable income in 2005, which should have been recognized after the implementation of the new tax system. Therefore, we expect firms will manage their earnings in response to the implementation of alternative minimum tax system. We also anticipate that the earnings management behavior is different between electronics and Non- electronics companies. Since most electronics companies in Taiwan enjoy tax holidays and favorable investment tax credits before the implementation of alternative minimum tax system. The implementation of the new tax system will increase their real tax burdens more than Non- electronics
industries. Using data from Taiwan's listed and OTC companies, this study documents evidence that firms managed their earnings in response to the adoption of the
alternative minimum tax system. The empirical evidence further indicates that the magnitude of earnings management for electronics companies is larger than Non- electronics companies.
Key words: earnings management, alternative minimum tax system, discretionary accruals
Data Availability: Data used in this study are available from public sources identified
I. INTRODUCTION
To raise tax revenue and to encourage social justice, Taiwan adopted the alternative minimum tax system in 2006. Because the alternative minimum tax system increases shareholders’ overall tax burden, shareholders’ wealth can be increased if their firms manage to recognize a portion of taxable income in 2005, which should have been recognized after the implementation of the new tax system. Therefore, we expect firms will manage their earnings in response to the implementation of alternative minimum tax system. We also anticipate that the earnings management behavior is different between electronics and Non- electronics companies. Since most electronics companies in Taiwan enjoy tax holidays and favorable investment tax credits before the implementation of alternative minimum tax system. The implementation of the new tax system will increase their real tax burdens more than Non- electronics industries. That is, rational firms will evaluate the costs and benefits of earnings management. Unless the benefits exceed the costs, they would not take actions to manage earnings. For the firms with lower effective tax rates before the
implementation of the alternative minimum tax system in 2006, shareholders’ benefit increases more if the firms shifted taxable income from later periods to 2005. Our sample provides an opportunity to investigate this interesting issue.
Using data from Taiwan's listed and OTC companies, this study documents evidence that firms managed their earnings in response to the adoption of the alternative
minimum tax system. The empirical evidence further indicates that the magnitude of earnings management for electronics companies is larger than Non- electronics companies.
This study contributes to the literature in the following ways. First, as for the issue about the policy implication of the alternative minimum tax system in Taiwan, this study first offers the empirical evidence. We find that Taiwan's listed and OTC companies managed their earnings in response to the adoption of the alternative minimum tax system. Second, the evidence indicates that electronics companies manage more earnings upward in response to the adoption of the alternative minimum tax system and is consistent with our expectation. This study documents the evidence and offers the policy maker to evaluate the policy implication of the alternative minimum tax system and formulate future policy.
The remainder of this paper is organized as follows: section II discusses some issues related to this study, section III discusses research design and hypotheses development, section IV gives the empirical results, and section V provides a summary and
conclusion.
II. INSTITUTIONAL BACKGROUND
Whether firms manage their earnings is an issue heatedly debated among regulators, practitioners and academics (Dechow and Skinner 2000). Many studies have explored managers’ incentives to manage earnings and documented numerous empirical
evidences1. This study investigates whether listed and OTC companies in Taiwan engage in earnings management in response to the implementation of alternative minimum tax system. There is a problem we have to face: the data for sample
companies’ taxable income. Because the taxable income data in corporate tax returns
1 For example, Healy (1985), DeAngelo (1986), Nichaus (1989), Jones (1991), Guenther (1994),
Dechow et al. (1995), DeFond et al. (1994), Gaver et al. (1995), DeFond and Park (1997), Degeorge et al. (1998), Burgstahler andDichev (1997, 1998), Healy and Wahlen (1999), Guidry et al. (1999),
are confidential, and not available to researchers, this study can only obtain research samples from publicly available financial data. However, this study focuses on the management of taxable income, not financial income. As explained below,
firm-specific taxable income will be obtained by adjusting financial income.
According to Taiwan’s Generally Accepted Accounting Principles (GAAP), the accrual method of accounting for financial reporting requires expense recognition in the period the expense is incurred. In addition, recognition of expenses has to conform to the matching principle. On the other hand, Taiwan’s tax laws require that economic substance should exist for any expense to be deductible for tax purposes. As a result, deductibility of an accrued expense for tax purpose appears to be a sufficient, but not a necessary, condition for recognition of expenses in financial reporting. Therefore, if a manager wants to accelerate the recognition of expenses for tax purposes, he will simultaneously accelerate accruing expenses for financial reporting in the same period. A similar argument has been proposed in Guenther (1994) and Lin et al. (2004).
On the revenue side, Taiwan’s tax acts prescribe the deadlines for issuing sales invoices. If companies try to defer the recognition of revenues for tax purposes (for example, delay the shipment of goods), it will be highly likely to defer the recognition of revenues for financial reporting purposes as well. Because of the consistency of income and expense recognition rules between GAAP and tax laws, this study can substitute financial data for tax return data after making necessary adjustments, like most prior research on tax-induced earnings management.
Let’s turn to the issue of how to measure the proxy of tax-induced earnings
management. Generally speaking, earnings management can be accomplished by a variety of means, such as use of accruals, changes in accounting methods, or changes in capital structure (McNichols and Wilson 1988; Lopez et al. 1998). The variable
generally used to proxy for earnings management is “accruals”, which is the
difference between the accounting earnings and cash flow from operation. According to Healy (1985), accruals can be divided into discretionary and non-discretionary accruals based on the managers’ controllability. In this paper we examine only management via discretionary accruals.
In the next section, we present our research design, including the hypotheses and sample selection.
III. RESEARCH DESIGN
Sample Selection
This study uses quarter data from the database compiled by the Taiwan Economic Journal Data Bank (TEJ). The sample periods covers 2002 to first quarter of 2006. The financial institutions are deleted because they have special operating environment and are regulated by the special laws. Those observations with missing values are also deleted. Finally, the sample is composed of 1131 firms, 2245 observations.
Development of Hypotheses
Because the alternative minimum tax system increases shareholders’ overall tax burden, shareholders’ wealth can be increased if their firms manage to realize in 2005 a portion of taxable income, which should have been realized after the implementation of the new tax system. That is, in response to the implementation of the alternative minimum tax system in 2006, firms have incentives to realize in 2005 a portion of taxable income, which should have been realized in 2006. In addition, firms face the tradeoff between financial reporting considerations and tax saving considerations when engaging in earnings management. The financial reporting costs are those costs,
real or perceived, related to reporting lower income or shareholders’ equity (Shackelford and Shevlin 2001). The financial reporting costs are important to effective tax planning because tax saving strategies often result in lowering reported income. However, many studies find that taxes savings dominate financial reporting concerns (Jenkins and Pincus 1998; Frankel and Trezevant 1994; Dopuch and Pincus 1988; Cushing and LeClere 1992). In this case, financial reporting considerations and tax saving considerations are consistent and reinforce each other. Based on the above arguments, we construct the first hypothesis as follows (all hypotheses are stated in alternative form):
Hypothesis 1: The discretionary accruals of sample companies are significantly
positive in 2005.
In order to stimulate economic development and encourage innovation, Taiwan offer tax incentives for the specific products (or industries)which meet the government requirements in the past. Most of them belong to the electronics industry. Under the alternative minimum tax system, these firms’ real tax burdens increased more than others. In addition, rational firms will evaluate the costs and benefits of earnings management. Unless the benefits exceed the costs, they would not take actions to manage earnings. For the firms with lower effective tax rates before the
implementation of the alternative minimum tax system in 2006, shareholders’ benefit increases more if the firms shifted taxable income from later periods to 2005.As a result, we expect those firms which enjoy tax holidays and favorable investment tax credits originally (i.e. the electronics industry) will engage in more earnings
management in response to the implementation of new tax system. Based on the above arguments, we construct the second hypothesis as follows:
significantly positive in 2005.
Operationalizing the Hypotheses
The Model of Discretionary AccrualsLet’s turn to the issue of how to measure the proxy of tax-induced earnings
management. Generally speaking, earnings management can be accomplished by a variety of means, such as use of accruals, changes in accounting methods, or changes in capital structure (McNichols and Wilson 1988; Lopez et al. 1998). The variable generally used to proxy for earnings management is “accruals”, which is the
difference between the accounting earnings and cash flow from operation. According to Healy (1985), accruals can be divided into discretionary and non-discretionary accruals based on the managers’ controllability. In this paper we examine only management via discretionary accruals.
As for the model of discretionary accruals, as a result of the finding of Dechow et al. (1995), most earnings management studies use the following Modified Jones Model:
it it it it it it it it it A PPE c A AR REV b A a A TA ε + ⎟⎟ ⎠ ⎞ ⎜⎜ ⎝ ⎛ + ⎟⎟ ⎠ ⎞ ⎜⎜ ⎝ ⎛Δ −Δ + ⎟⎟ ⎠ ⎞ ⎜⎜ ⎝ ⎛ = − − − −1 1 1 1 1 (1) where, it
TA : total accruals in year t for firm i.
1 − it
A : total assets at t-1 year end for firm i.
it
REV
Δ : the changes in net sales between time t and time t-1 for firm i.
it
AR
Δ : the changes in net account receivables between time t and time t-1 for firm i.
it
PPE : gross property, plant, and equipment in year t for firm i.
Model. We estimate the parameters in Modified Jones Model by industry and with the data from year 2002 to second quarter of 2005. Since previous literature suggests that the estimate of discretionary accruals may be correlated with sample firms’ current or past performances (Dechow et al., 1995; Ashbaugh, LaFond and Mayhew, 2003; Kothari, Leone and Wasley, 2005; Lin, 2006). We will add the performance related control variables in the afterward regressions.
In addition, all of the variables in equation (3) are scaled by total assets at t-1 year-end of each firm (Ait−1) to alleviate heteroscedasticity.
Our empirical specifications are shown as equation (2) and (3).
Regression Model
0 1 2 3 4 5
DA=β +β HIGHTEC+β SIZE+β LEV +β CFO+β ROA (2)
0 1 2 3 4 5
DA=β +βBEFORE+β HIGHTEC+β HIGHTECPRE+β SIZE+β SIZEPRE 6LEV 7LEVPRE 8CFO 9CFOPRE 10ROA 11ROAPRE
β +β +β +β +β +β (3)
The definitions of variables are as follows:
DA = the discretionary accruals divided by total assets (beginning of year).
BEFORE:BEFORE=1 if the observation belongs to 2005, and 0 otherwise. We
use this variable to test H1.
HIGHTEC:HIGHTEC =1 if the firm belongs to the electronics industry, and 0
otherwise;
HIGHTECPRE:This variable equals to BEFORE multiplied by HIGHTEC. SIZE2:Firm size, equal to 1 if the natural log of firm’s net sales is greater than
the median, and 0 otherwise.
SIZEPRE:This variable equals to BEFORE multiplied by SIZE.
LEV:Firms’ long term debt ratio. LEV is equal to the book value of long term
debt divided by total assets.
LEVPRE:This variable equals to BEFORE multiplied by LEV.
CFO:the operating cash flow divided by total assets (beginning of year).
CFOPRE:This variable equals to BEFORE multiplied by CFO.
ROA:Return on assets.
ROAPRE:This variable equals to BEFORE multiplied by ROA.
We run equation (2) for quarter fourth of 2005, quarter first of 2006 separately, and we run equation (3) with 2005 and 2006 pooling data.
IV. RESULTS AND DISCUSSIONS
Univariate Tests
Inserts Table 1 Here
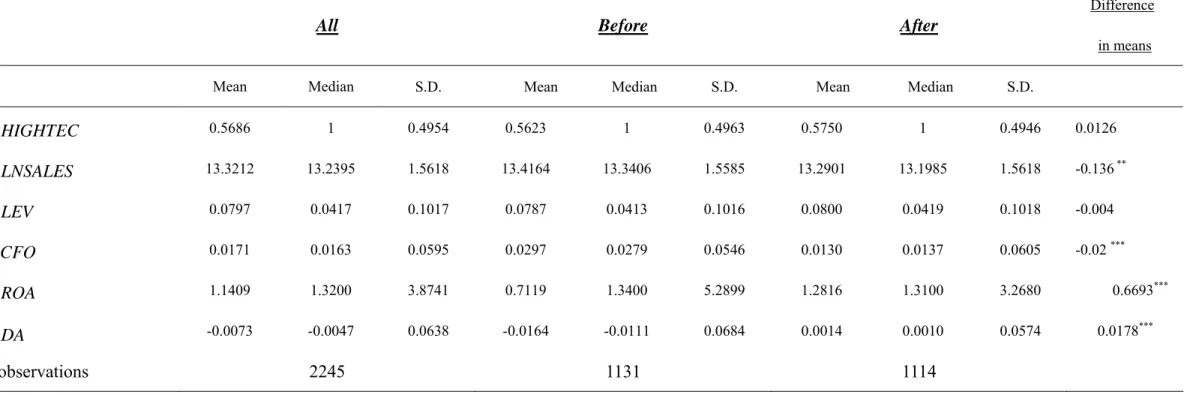
Descriptive statistics are reported in Table 1 for the full sample (from quarter fourth of 2005 to quarter first of 2006) and two partitioned samples, before the
Taiwan’s 2006 implementation of the alternative minimum tax system (Before sample) and after the Taiwan’s 2006 implementation of the alternative minimum tax system (After sample).
Table 1 shows that all variables, except for HIGHTEC and LEV, are
significantly different in the Before and After samples. The variables LNSALES, and CFO of After sample are significantly smaller than those of Before sample. The
variable ROA of After sample is significantly larger than that of Before sample. The
(p-value<1%) and inconsistent with our expectation. However, some confounding factors might affect the quality of inferences through the univariate tests directly. Therefore, to obtain more rigorous evidence on earnings management with respect to the affair, adopting multiple regression models should be desirable.
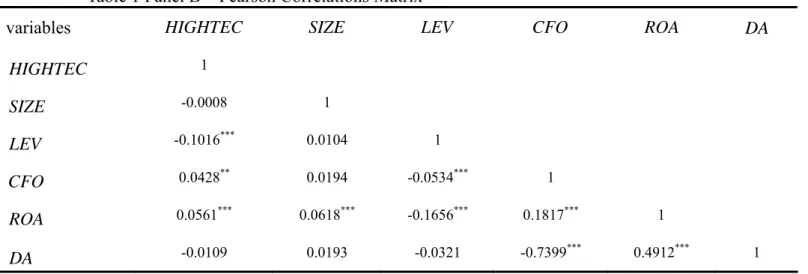
Panel B of Table 1 presented the Pearson correlations matrix. There is no serious multicollinearity among the variables. However, we will investigate the variance inflation factor (VIF) in the afterward multiple linear regressions.
Multivariate Tests
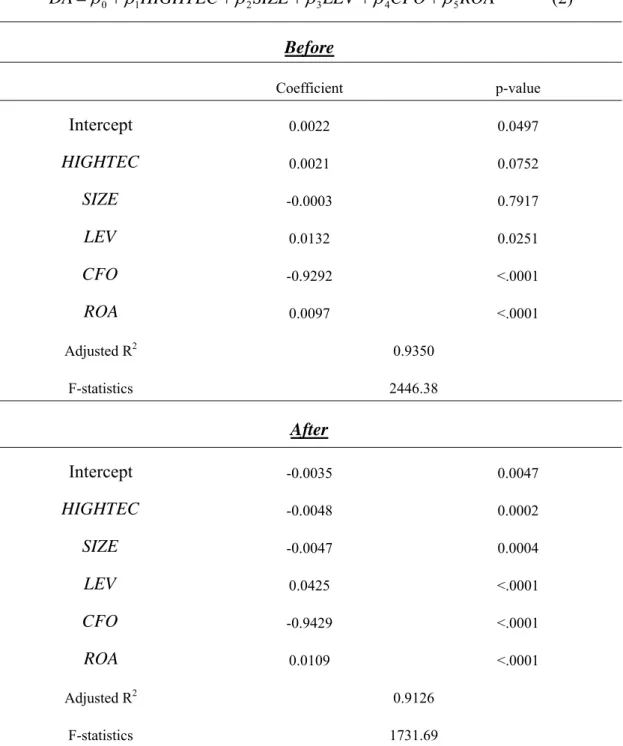
The empirical results of equation (2) are presented in Table 2. From Table 2 we can see that, after including control variables SIZE, LEV, CFO and ROA, the
coefficients on HIGHTEC are significantly positive in 2005 and significantly negative in 2006. This means that electronics Companies shifted 2006 earnings to 2005 in response to the implementation of the alternative minimum tax system and supports the hypothesis H2’ arguments.
Inserts Table 2 Here
The coefficients on LEV and ROA are significant positive in two partitioned sample, SIZE is also positive in two partitioned sample and significant in After sample. In addition, the coefficients on CFO are both significant negative in two partitioned sample.
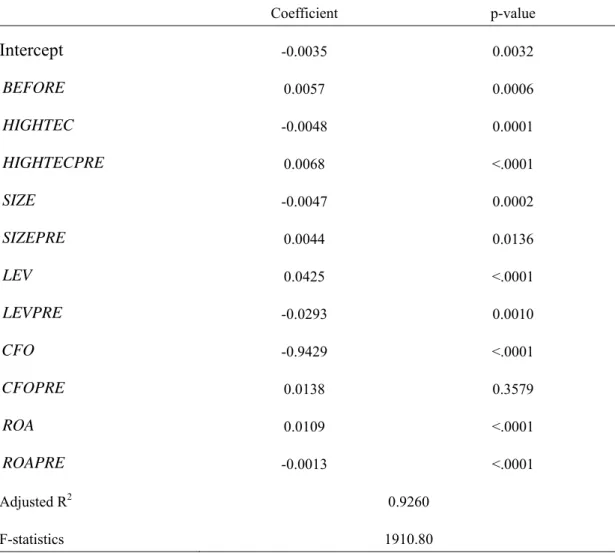
In order to compare firms’ behavior directly before and after the implementation of the alternative minimum tax system, we run equation (3) with quarter fourth of 2005 and quarter first of 2006 data. The results are presented in Table 3.
Inserts Table 3 Here
From the results of Table 3, we find that the coefficient on BEFORE is significantly
positive. This supports H1. That is, Taiwanese listed and OTC companies did manage their earnings upward in response to the implementation of the alternative minimum tax system in 2006. In addition, β3 is significantly positive and β2 is significantly
negative, it means that electronics companies manage more earnings upward than non- electronics companies in response to the implementation of the alternative minimum tax system in 2006. Therefore, the empirical results support H2.
Table 3 also shows that the coefficients of all control variables, except CFOPRE, are
significant. We find that β5 is significantly positive and β4 is significantly negative, it
means that larger firms manage their earnings upward more in response to the implementation of the alternative minimum tax system. We also find that the
coefficients of LEVPRE and ROAPRE are significantly negative, the coefficients of
LEV and ROA are significantly positive. These evidences imply that firms with
higher debt levels and with better profitability will not engage in more earnings management before the implementation of the alternative minimum tax system.
Finally, we investigate the VIF (Variance Inflation Factor) in the multiple linear
regressions of equations (2) and (3). The results show that VIFs are all far less than 10, indicating nonexistence of multicollinearity.
Sensitivity Tests
The results of sensitivity tests are described below. In sum, the results of sensitivity tests show that our primary results are robust.
Change of Estimation Period
We originally estimate the parameters in Modified Jones Model by industry and with the data from year 2002 to second quarter of 2005. In order to check our main
conclusions are sensitive to the choice of estimate period. We re-estimate the Modified Jones Model with different estimate period, including year 2002 to year 2005, year 2004, and fourth quarter of 2004 to third quarter of 2005, and so on. We then re-do all the tests. The main conclusions are the same.
Use Different Discretionary Accruals Model
According to prior literature, total accruals can be categorized into two types: (1) current accruals: which are most likely to have an impact on taxable income, e.g., accounts receivables, accounts payable (Manzon 1992; Choi et al. 1991; Guenther 1994; and Lopez et al. 1998); and (2) non-current accruals: which are not expected to have significant effects on taxable income, e.g., depreciation, amortization. The primary reason for only examining current accruals is that current accruals are, in general, easier to manage over short time periods than are changes in accounting methods or capital structure. In addition, the legislative process of the amendment act of new alternative minimum tax system went through quickly in the second half of 2005, and Taiwan’s Income Tax Law specifies the accepted asset depreciation methods for tax purposes. Therefore, it will be less likely for firms to manage
earnings through non-current accruals related accounts, such as plant assets, long-term liability, depreciation, amortization, and so on. As a result, we use the discretionary accruals model stated in Lin et al. (2004) (shown as equation (4)) and reconduct the above analyses. And, these sensitivity tests yield similar results.
1 1 1 1 it it it it it it it CC REV AR a b A − A − A− ε ⎛ ⎞ ⎛Δ − Δ ⎞ = ⎜ ⎟+ ⎜ ⎟+ ⎝ ⎠ ⎝ ⎠ (4)
Use of Different Proxy Variable
(a) SIZE: Prior literature reveals ambiguous evidence regarding size effect, partly supporting political cost hypothesis, partly supporting political power hypothesis (Zimmerman 1983; Scholes et al. 1992; Guenther 1994; Lopez et al. 1998). Political cost hypothesis and political power hypothesis are supported by large firms. In our previous section, we use a dummy variable which partitioned the sample by the median of natural log of firm’s net sales. We also follow Guenther (1994) and Lopez et al. (1998) and use a dummy variable (which partitioned the sample based on the observation’s total assets is in the highest quartile) as proxy. In addition, we also use the natural log value of sales in the sensitivity tests and yield similar results.
(b) LEV: We use the ratio of total debt to total assets in the sensitivity tests and yield similar results.
(c)ROA: We use another two measures of ROA in TEJ in the sensitivity tests and yield similar results.
To sum up, using data from Taiwan's listed and OTC companies, this study provides evidence that firms managed their earnings in response to the adoption of the
alternative minimum tax system. The empirical evidence further indicates that the magnitude of earnings management for electronics companies were larger than non- electronics companies.
V. SUMMARY AND CONCLUSION
STo raise tax revenue and to encourage social justice, Taiwan adopted the alternative minimum tax system in 2006. Our paper investigates the earnings management
behavior of Taiwan’s corporations before and after the implementation of the
alternative minimum tax system. Our findings, summarized below, may be of interest to tax policy makers.
First of all, this paper provides empirical evidence that Taiwan’s corporations engaged in earnings management to shift their earnings from the beginning year of the
alternative minimum tax system to the preceding year. In particular, firm size, the debt levels, and profitability are demonstrated to have a significant relationship with firms’ earnings management. These results support the hypotheses that firms manage their earnings upward in response to the implementation of the alternative minimum tax system.
More interestingly, we also find that the earnings management behavior is more significant in electronics companies than non-electronics companies. Since most electronics companies in Taiwan enjoy tax holidays and favorable investment tax credits before the implementation of alternative minimum tax system. The
implementation of new tax system is expected to have greater negative effect on the electronics companies. This study documents the evidence and offers the policy maker to evaluate the policy implication of the alternative minimum tax system and
formulate future policy.
Though this empirical finding is certainly country-specific, how differently
electronics and non- electronics companies would react to the alternative minimum tax system is undoubtedly an issue that a country which plans to switch to alternative minimum tax system should be concerned about.
REFERENCES
Ashbaugh, H., R. LaFond, and B. W. Mayhew. 2003. Do nonaudit services
compromise auditor independence? Further evidence. The Accounting Review 78(3): 611-639.
Becker, C. L., M. L. DeFond, J. Jiambalvo, and K. R. Subramanyam. 1998. The effect of audit quality on earnings management. Contemporary Accounting Research 15, 1-21.
Bonner, S., Zoe-Vonna Palmrose, and S. Young. 1998. Fraud type and auditor litigation: An analysis of SEC accounting and auditing enforcement releases. The
Accounting Review 73, 503-532.
Burgstahler, D., and I. Dichev. 1997. Earnings management to avoid earnings decreases and losses. Journal of Accounting and Economics 24, 99-126.
────. 1998. Incentives to manage earnings to avoid earnings decreases and losses: Evidence from quarterly earnings. Working Paper, University of Washington. Choi, W. W., J. D. Gramlich, and J. K. Thomas. 1991. Earnings management in response to the book income adjustment of the corporate alternative minimum tax. Working Paper, Columbia University.
Cushing, B., and M. LeClere. 1992. Evidence on the determinants of inventory accounting policy choice. The Accounting Review 67, 355-366.
DeAngelo, L. 1986. Accounting numbers as market valuation substitutes: A study of management buyouts of public stockholders. The Accounting Review 61, 400-420. Dechow, P. M., R. G. Sloan, and A. P. Sweeney. 1995. Detecting earnings management.
The Accounting Review 70, 193-225.
Dechow, P. M., and D. J. Skinner. 2000. Earnings management: Reconciling the views of accounting academics, practitioners, and regulators. Accounting Horizons 14, 235-250.
DeFond, M. L., and J. Jiambalvo. 1994. Debt covenant violation and manipulation of accruals, accounting choice in troubled companies. Journal of Accounting and
Economics 17, 145-176.
earnings. Journal of Accounting and Economics 23, 115-139.
DeFond, M. L., and K. R. Subramanyam. 1998. Auditor changes and discretionary accruals. Journal of Accounting and Economics 25, 35-68.
Degeorge, F., J. Patel, and R. Zeckhauser. 1998. Earnings management to exceed thresholds. Working Paper, Boston University.
Department of the Treasury of the United States. 1992. Integration of the individual and corporate tax systems – Taxing business income once. U.S. Government Printing Office.
Dopuch, N., and M. Pincus. 1988. Evidence on the choice of inventory accounting methods: LIFO versus FIFO. Journal of Accounting Research 26, 28-59.
Frankel, M., and R. Trezevant. 1994. The year-end LIFO inventory purchasing decision: An empirical test. The Accounting Review 69, 382-398.
Gaver, J., K. Gaver, and J. Austin. 1995. Additional evidence on bonus plans and income management. Journal of Accounting and Economics 18, 3-28.
Guenther, D. A. 1994. Earnings management in response to corporate tax rate changes: Evidence from the 1986 tax reform act. The Accounting Review 69, 230-243.
Guidry, F., A. Leone, and S. Rock. 1999. Earnings-based bonus plans and earnings management by business unit managers. Journal of Accounting and Economics 26, 113-142.
Healy, P. M. 1985. The effect of bonus schemes on accounting decisions. Journal of
Accounting and Economics 7, No.1-3, 85-107.
Healy, P. M., and J. M. Wahlen. 1999. A review of the earnings management literature and its implications for standard setting. Accounting Horizons 13, 365-383.
Hunt, H. 1985. Potential determinants of corporate inventory accounting decisions.
Journal of Accounting Research 23, 448-467.
Jenkins, N., and M. Pincus. 1998. LIFO versus FIFO: Updating what we have learned. Working Paper, University of Iowa.
Jensen, M. C., and W. H. Meckling. 1976. Theory of the firm: managerial behavior, agency costs and ownership structure. Journal of Financial Economics 3, 305-360. Jones, J. 1991. Earnings management during import relief investigations. Journal of
Kothari, S. P., A. Leone, and C. Wasley. 2005. Performance matched discretionary accrual measures. Journal of Accounting and Economics 39: 163-197.
Latham, C. K., and M. Linville. 1998. A review of the literature in audit litigation.
Journal of Accounting Literature 17, 175-213.
Lin, S., and C.-S. Yang. 1994. A study on corporate tax burdens of listed companies.
Public Finance Review 26, 32-52. (in Chinese)
Lin, S., T. H. Lin, and Y. C. Tsai. 2004. Earnings management in Taiwan’s imputation tax system. Taiwan Accounting Review, Vol. 4, No. 2, pp. 127-152.
Lin, Tzong-Huei. 2006. The study about the merger of auditor firms and audit quality -Evidence from Taiwan. Working paper. National Changhua University of Education, Taiwan.
Liu, C.-C., S. Lin, and D.-F. Huang. 2001. Factors influencing corporate effective tax rates in Taiwan. Taiwan Accounting Review 2, 57-84.
Lopez, T. J., P. R. Regier, and T. Lee. 1998. Identifying tax-induced earnings
management around TRA 86 as a function of prior tax-aggressive behavior. Journal of
the American Taxation Association 20, 37-56.
Lys, T., and R. Watts. 1994. Lawsuits against auditors. Journal of Accounting
Research 32, 65-93.
Manzon, G. 1992. Earnings management of firms subject to the alternative minimum tax. Journal of the American Taxation Association 14, 86-111.
McNichols, M., and G. Wilson. 1988. Evidence of earnings management from the provision for bad debts. Journal of Accounting Research 26, 1-31.
Nichaus, G. 1989. Ownership structure and inventory method choice. The Accounting
Review 64, 269-284.
Patell, J. M. 1976. Corporate forecasts of earnings per share and stock price behavior: Empirical tests. Journal of Accounting Research 14, 246-276.
Scholes, M. S., G. P. Wilson, and M. A. Wolfson. 1992. Firms’ responses to
anticipated reductions in tax rates: The tax reform act of 1986. Journal of Accounting
Research 30, 161-185.
Shackelford, D. A., and T. Shevlin. 2001. Empirical tax research in accounting.
Siegfried, J. 1972. The relationship between economic structure and the effect of political influence: Empirical evidence from the federal corporation income tax program. Ph.D. Dissertation, University of Wisconsin.
─────. 1974. Effective average U.S. corporation income tax rates. National Tax
Journal 27, 245-259.
Teoh, S. H., I. Welch, T. J. Wong. 1998a. Earnings management and the
underperformance of seasoned equity offering. Journal of Financial Economics 50, 63-99.
─────. 1998b. Earnings management and the long-run market performance of initial public offering. Journal of Finance 6, 1935-1974.
Watts, R. L., and J. L. Zimmerman. 1986. Positive accounting theory. Englewood Cliffs, NJ: Prentice-Hall.
─────. 1990. Positive accounting theory: A ten year perspective. The
Accounting Review 65, 131-156.
Zimmerman, J. L. 1983. Taxes and firm size. Journal of Accounting and Economics 5, 119-149.
Table 1 Panel A The Descriptive Statistics and univariate t test
All Before After
Difference in means
Mean Median S.D. Mean Median S.D. Mean Median S.D.
HIGHTEC 0.5686 1 0.4954 0.5623 1 0.4963 0.5750 1 0.4946 0.0126 LNSALES 13.3212 13.2395 1.5618 13.4164 13.3406 1.5585 13.2901 13.1985 1.5618 -0.136 ** LEV 0.0797 0.0417 0.1017 0.0787 0.0413 0.1016 0.0800 0.0419 0.1018 -0.004 CFO 0.0171 0.0163 0.0595 0.0297 0.0279 0.0546 0.0130 0.0137 0.0605 -0.02 *** ROA 1.1409 1.3200 3.8741 0.7119 1.3400 5.2899 1.2816 1.3100 3.2680 0.6693*** DA -0.0073 -0.0047 0.0638 -0.0164 -0.0111 0.0684 0.0014 0.0010 0.0574 0.0178*** observations 2245 1131 1114
Table 1 Panel B Pearson Correlations Matrix
variables HIGHTEC SIZE LEV CFO ROA DA
HIGHTEC 1 SIZE -0.0008 1 LEV -0.1016*** 0.0104 1 CFO 0.0428** 0.0194 -0.0534*** 1 ROA 0.0561*** 0.0618*** -0.1656*** 0.1817*** 1 DA -0.0109 0.0193 -0.0321 -0.7399*** 0.4912*** 1
Note: The definitions of variables are as follows:
DA= the discretionary accruals divided by total assets (beginning of year).
HIGHTEC:HIGHTEC =1 if the firm belongs to the electronics industry, and 0 otherwise;
SIZE:Firm size, equal to 1 if the natural log of firm’s net sales is greater than the median, and 0 otherwise.
LNSALES:the natural log value of firm’s net sales.
LEV:Firms’ long term debt ratio. LEV is equal to the book value of long term debt divided by total assets.
CFO:the operating cash flow divided by total assets (beginning of year).
ROA:Return on assets.
Table 2 The Empirical Results of equation (2)
0 1 2 3 4 5
DA=β +βHIGHTEC+β SIZE+β LEV +β CFO+β ROA (2)
Before Coefficient p-value Intercept 0.0022 0.0497 HIGHTEC 0.0021 0.0752 SIZE -0.0003 0.7917 LEV 0.0132 0.0251 CFO -0.9292 <.0001 ROA 0.0097 <.0001 Adjusted R2 0.9350 F-statistics 2446.38 After Intercept -0.0035 0.0047 HIGHTEC -0.0048 0.0002 SIZE -0.0047 0.0004 LEV 0.0425 <.0001 CFO -0.9429 <.0001 ROA 0.0109 <.0001 Adjusted R2 0.9126 F-statistics 1731.69 Note: The definitions of variables are as follows:
DA= the discretionary accruals divided by total assets (beginning of year).
HIGHTEC:HIGHTEC =1 if the firm belongs to the electronics industry, and 0 otherwise;
SIZE:Firm size, equal to 1 if the natural log of firm’s net sales is greater than the median, and 0 otherwise.
LEV:Firms’ long term debt ratio. LEV is equal to the book value of long term debt divided by total assets.
CFO:the operating cash flow divided by total assets (beginning of year).
ROA:Return on assets.
Table 3 The Empirical Results of equation (3)
0 1 2 3 4 5
DA=β +βBEFORE+β HIGHTEC+β HIGHTECPRE+β SIZE+β SIZEPRE
β6LEV +β7LEVPRE+β8CFO+β9CFOPRE+β10ROA+β11ROAPRE (3)
Coefficient p-value Intercept -0.0035 0.0032 BEFORE 0.0057 0.0006 HIGHTEC -0.0048 0.0001 HIGHTECPRE 0.0068 <.0001 SIZE -0.0047 0.0002 SIZEPRE 0.0044 0.0136 LEV 0.0425 <.0001 LEVPRE -0.0293 0.0010 CFO -0.9429 <.0001 CFOPRE 0.0138 0.3579 ROA 0.0109 <.0001 ROAPRE -0.0013 <.0001 Adjusted R2 0.9260 F-statistics 1910.80 Note: The definitions of variables are as follows:
DA= the discretionary accruals divided by total assets (beginning of year).
BEFORE:BEFORE=1 if the observation belongs to 2005, and 0 otherwise. We use this variable to test H1.
HIGHTEC:HIGHTEC =1 if the firm belongs to the electronics industry, and 0 otherwise;
HIGHTECPRE:This variable equals to BEFORE multiplied by HIGHTEC.
SIZE:Firm size, equal to 1 if the natural log of firm’s net sales is greater than the median, and 0 otherwise.
SIZEPRE:This variable equals to BEFORE multiplied by SIZE.
LEV:Firms’ long term debt ratio. LEV is equal to the book value of long term debt divided by total assets.
CFO:the operating cash flow divided by total assets (beginning of year).
CFOPRE:This variable equals to BEFORE multiplied by CFO.
ROA:Return on assets.
ROAPRE:This variable equals to BEFORE multiplied by ROA.