利用卵白素與生物素標記之蛋白質形成聯集網路達到蛋白質訊號放大
199
0
0
全文
(2) Dedication 這份碩士論文我要特別感謝我最好的朋友與愛我的家人。我要在這邊 感謝蔡長生與高健發,他們兩位是和我從 15 歲時就認識的好朋友。如果 不是在大學四年級時他們鼓勵我繼續升學攻讀碩士班,我將會錯過在碩 士班所獲得的寶貴經驗。 我最要感謝的人就是我的爸爸與媽媽。他們給予我心理層面與經濟上 的支持。他們支持我讀碩士班而且在我感受到挫折時給予我適時的鼓勵, 讓我有繼續努力的動力。當我想去美國與香港參加國際研討會發表演講 時,爸媽也是給我百分之百的支持,讓我在經濟上面沒有後顧之憂。有 著他們的支持與鼓勵,讓我可以全心全意的投入研究,順利完成碩士班 學業。. I.
(3) Acknowledgement 首先我要感謝我的指導教授 Prof. Carey,讀碩士班的這兩年多下來, 透過 Prof. Carey 讓我學習到了許多難得的經驗。老師他常說要將我訓練 成科學家而不只是化學家,科學家是指有辦法獨立思考去設計各種實驗 條件解決研究上難題的人。透過平常密集的討論交流,我從老師身上學 習到設計實驗的技巧還有討論實驗結果的思考路線。老師十分鼓勵學生 參加學術研討會拓展視野,最有印象的一次就是去美國參加第 242 屆美 國化學年會,老師鼓勵我去報名英文專題演講,在眾多的外國教授面前 報導自己的研究成果,那次的演講經驗讓我對使用英文演講的膽量大增, 之後去香港參加第 6 屆亞洲生物無機會議時的英文演講就不會那麼緊張 了。去美國的時候也多虧了有老師的照顧,讓我們在人生地不熟的外國 也不會有問題。 另外要感謝老師的地方還有他給了我撰寫 paper 的機會,讓我有機會 親自去把自己的研究成果撰寫成國際期刊論文。透過和老師來回校稿的 過程,學習到如何撰寫英文科學文章的技巧,過程雖然繁瑣但我知道這 種經驗對碩士班學生來說是相當難得的。兩年多下來真的非常感謝 Prof. Carey 的指導與照顧,這段時間的訓練讓我學習到許多科學上與非科學上 的技能。 我要感謝何永皓教授與莊曜遠教授擔任我的口試委員,給予我許多非 常有用的建議與指導。碩士班一年級時上何教授的書報討論課,這門課 程幫助我快速的了解自己本身的研究背景,讓我知道研究應該走的方向。 這兩年多來何教授多次主動與我討論研究內容,對我的研究幫助很大, II.
(4) 非常感謝他。 最後,我要感謝實驗室的夥伴們,感謝他們兩年多來的照顧,幫忙我 分擔實驗室的雜事,讓我可以充分的專心在研究中。尤其是我所帶的專 題生,王柏堯、林泰言、洪原振、陳振豪、周浩儒、鄭敬騰、謝長霖。 王柏堯協助我構思實驗與發想新的方法,我們共同建立的方法最後也撰 寫成期刊論文發表在 Chemical Communications。在同一個研究中林泰言 與洪原振協助我做了絕大部分的實驗,陳振豪與周浩儒也有多次的協助 實驗。陳振豪、鄭敬騰、謝長霖會在我畢業之後接續做相關的延伸研究。 我也感謝和我一同在生物感測器這塊領域做研究的林慧賢同學在我就讀 碩士班的時間給予我無數次的實驗討論,加速了研究的推展速度,讓我 可以順利的完成研究。感謝已畢業學姊黃繽萱與學長林伯烜在我碩一的 時候帶領我快速的進入狀況,特別是黃繽萱學姊還有另外指導我很多軟 體功能,對我在整理實驗數據上很有幫助。. III.
(5) Table of Contents 摘要 .............................................................................................................. 1 Abstract .......................................................................................................... 3 Chapter 1. Research Motivation ..................................................................... 5 Chapter 2. Literature Review .......................................................................... 7 2.1. Antibody-antigen interaction ......................................................... 7. 2.2. Streptavidin and biotin ................................................................... 8. 2.3. Sodium dodecyl sulfate polyacrylamide gel electrophoresis ........ 10. 2.4. Enzyme-linked immunosorbent assay .......................................... 11. 2.5. Signal amplification via photopolymerization.............................. 12. 2.6. Use of quantum dots as signal source of immunoassay ................ 16. 2.7. Immunoassay with rolling circle amplification ............................ 17. 2.8. 2.9. 2.7.1. Rolling circle amplification ............................................... 17. 2.7.2. ImmunoRCA ..................................................................... 19. Immunoassay using GMR sensor as detector ............................... 22 2.8.1. Spin valve giant magnetoresistance effect.......................... 22. 2.8.2. GMR biosensor.................................................................. 24. Avidin-biotin-peroxidase complex based signal generation ......... 27. 2.10 Polymer formed by interprotein heme-heme pocket interactions . 29 2.11 Signal enhancement of impedance measurement via the biotinylated antibody-streptavidin complex ........................................... 31 2.12 Dendritic signal amplification...................................................... 33. IV.
(6) Chapter 3. Research Subjects ....................................................................... 36 3.1. Signal amplification triggered by antibody-antigen recognition ... 36. 3.2. Streptavidin biotinylated protein networks (SBPN) ..................... 38 3.2.1. The concept of SBPN method ............................................ 38. 3.2.2. Use of streptavidin-HRP as the signal generating media of. the SBPN method............................................................................ 40 3.3. Use bioconjugated microspheres to detect antigen ....................... 41 3.3.1. Use of streptavidin coated microsphere as the signal. generating media of the SBPN method ........................................... 41 3.3.2. Antigen triggered self-assembly of antibody coated. microspheres ................................................................................... 42 Chapter 4. Experimental Section .................................................................. 44 4.1. Materials ...................................................................................... 44. 4.2. Acronym...................................................................................... 48. 4.3. General method ........................................................................... 49 4.3.1. Wash microtiter plate ......................................................... 49. 4.3.2. Wash microspheres in Eppendorf....................................... 49. 4.3.3. Synthesis of BSA-PEG 4 -biotin .......................................... 49. 4.3.4. Bradford protein assay ....................................................... 50. 4.3.5. HABA biotin quantitation assay ........................................ 50. 4.3.6. Measurement of color value............................................... 51. V.
(7) 4.4. Verification of the antigen binding ability of biotinylated capture. antibody ................................................................................................. 52 4.5. Verification of the requirement of heterogeneous antibodies in. sandwich ELISA.................................................................................... 54 4.6. Verification of attachment of detection antibodies, streptavidin, and. biotinylated BSA ................................................................................... 55 4.7. Comparison of the various cycles of the SBPN method (0-10. cycles) ................................................................................................... 57 4.8. Comparison of the various cycles of the SBPN (5-30 cycles). method ................................................................................................... 58 4.9. Comparison of the ABC, DLA, and SBPN (20 cycles) methods. performed on a biotinylated antibody coated surface ............................. 59 4.10 Comparison of the ABC, DLA, and SBPN (5 cycles) methods performed on a biotinylated antibody coated surface ............................. 62 4.11 Verification of attachment of streptavidin, biotinylated BSA, and streptavidin coated microspheres ........................................................... 65 4.12 Visual detection of streptavidin coated microspheres using the SBPN method ........................................................................................ 66 4.13 Streptavidin coated microsphere bind to biotinylated BSA which was gradient coated on the microtiter surface ........................................ 67. VI.
(8) 4.14 Synthesis of IL-7 capture antibody-PEG 4 -biotin .......................... 67 4.14.1 Synthetic method of IL-7 capture antibody-PEG 4 -biotin ... 67 4.14.2 Verification that IL-7 capture antibody-PEG 4 -biotin was synthesized ..................................................................................... 68 4.15 Synthesis and verification the antibody coated microsphere ........ 69 4.16 Antigen triggered self-assembly of antibody coated microspheres at various pH conditions ........................................................................ 70 Chapter 5. Results and Discussion ................................................................ 71 5.1. Signal amplification triggered by antibody-antigen recognition ... 71 5.1.1. Verification of the antigen binding ability of biotinylated. capture antibody.............................................................................. 71 5.1.2. Verification of the requirement of heterogeneous antibodies. in sandwich ELISA ......................................................................... 80 5.2. Characterization of BSA-PEG 4 -biotin ......................................... 87 5.2.1. Concentration measurement of BSA-PEG 4 -biotin by. Bradford protein assay .................................................................... 87 5.2.2. Molecular weight measurement of BSA-PEG 4 -biotin by. SDS-PAGE and MALDI-TOF-MS .................................................. 88 5.2.3. Biotin quantitation measurement of BSA-PEG 4 -biotin by. HABA assay ................................................................................... 93. VII.
(9) 5.3. Streptavidin biotinylated protein networks (SBPN) ..................... 95 5.3.1. Verification of binding among detection antibody,. streptavidin, and biotinylated BSA.................................................. 95. 5.4. 5.3.2. Investigation of the optimal cycle of the SBPN method ..... 99. 5.3.3. Comparison of the ABC, DLA, and SBPN methods ........ 114. Use of streptavidin coated microsphere as the signal generating. media of the SBPN method ................................................................. 126 5.4.1. Verification of streptavidin, biotinylated BSA and. streptavidin coated microsphere binding ....................................... 126 5.4.2. Visual detection of BSA-PEG 4 -biotin on microtiter plate. surface using streptavidin coated microspheres with optical microscopy ................................................................................... 131 5.5. Antigen triggered self-assembly of antibody coated microspheres ... .................................................................................................. 142 5.5.1. Verification that IL-7 capture antibody-PEG 4 -biotin was. synthesized ................................................................................... 142 5.5.2. Verification that antibody coated microsphere was. synthesized ................................................................................... 143 5.5.3. Antigen triggered self-assembly of antibody coated. microspheres at various pH conditions .......................................... 145. VIII.
(10) Chapter 6. Conclusions............................................................................... 151 Chapter 7. References ................................................................................ 153 Biography................................................................................................... 160 Copyright License Agreement .................................................................... 161. IX.
(11) List of Tables Table 1. Reagent recipe list ............................................................. 47 Table 2. The result of Figure 29b using IL-4 ELISA kit .................. 75 Table 3. The result of Figure 29b using IL-7 ELISA kit .................. 76 Table 4. The result of controls (c) and (d) in Figure 29 ................... 77 Table 5. The result of Figure 29a using IL-4 ELISA kit .................. 78 Table 6. The result of Figure 29a using IL-7 ELISA kit .................. 79 Table 7. The results of control experiments in Figure 34 ................ 83 Table 8. The HABA assay results for BSA-PEG 4 -biotin ................. 94 Table 9. Raw color values of the DLA and SBPN (1-10 cycles) methods performed on a biotinylated antibody coated surface .............................................................................................. 102 Table 10. Relative color values generated by the DLA and SBPN (1-10 cycles) methods performed on a biotinylated antibody coated surface ....................................................................... 103 Table 11. Raw color values of the DLA and SBPN (5-30 cycles) methods performed on a biotinylated antibody coated surface .............................................................................................. 110 Table 12. Relative color values generated by the DLA and SBPN (5-30 cycles) methods performed on a biotinylated antibody coated surface ....................................................................... 111. X.
(12) Table 13. Raw color values generated by the ABC, DLA, and SBPN (20 cycles) methods performed on a biotinylated antibody coated surface ....................................................................... 117 Table 14. Relative color values generated by the ABC, DLA, and SBPN (20 cycles) methods performed on a biotinylated antibody coated surface ......................................................... 118 Table 15. Raw color values generated by the ABC, DLA, and SBPN (5 cycles) methods performed on a biotinylated antibody coated surface................................................................................... 123 Table 16. Relative color values generated by the ABC, DLA, and SBPN (5 cycles) methods ...................................................... 124 Table 17. The amount of BSA-PEG 4 -biotin and experiment conditions matched up with the results on Figure 67. ............ 136. XI.
(13) List of Figures Figure 1. The structure of antibody .................................................. 8 Figure 2. The structure of streptavidin .............................................. 9 Figure 3. The structure of biotin ..................................................... 10 Figure 4. Illustration of sandwich ELISA ....................................... 12 Figure 5. Illustration of using visual detectable polymer as signal of immunoassay .......................................................................... 13 Figure 6. Synthesis of dual-function molecule................................ 13 Figure 7. Illustration of signal amplification via photopolymerization ................................................................................................ 15 Figure 8. The result of using dual-functional macromolecule to detect. the. surface. biotinylated. oligonucleotide. through. photopolymerization ............................................................... 16 Figure 9. Illustration of immunoassay using quantum dots ............. 17 Figure 10. Illustration of rolling circle amplification ...................... 18 Figure 11. Illustration of the immunoRCA method ......................... 20 Figure 12. Comparison of the ELISA and immunoRCA methods for the detection of α-fetoprotein (AFP)........................................ 21 Figure 13. Specific layered magnetic material required for giant magnetoresistance effect ......................................................... 22 Figure 14. Illustration of spin valve GMR sensor ........................... 23 Figure 15. Illustration of GMR biosensor ....................................... 25. XII.
(14) Figure 16. Comparison of the GMR biosensor and ELISA on the detection of CEA..................................................................... 26 Figure 17. Illustration of the avidin-biotin peroxidase complex (ABC) method .................................................................................... 28 Figure 18. Formation of self-assembly of supramolecular polymer via heme-heme pocket interaction ........................................... 29 Figure 19. Formation of nanoparticle based supramolecular polymer via heme-heme pocket interaction ........................................... 30 Figure 20. Using biotinylated antibody-streptavidin complex to enhance the signal of impedance spectroscopy ........................ 32 Figure 21. Illistration of the Dendritic signal amplification method ... ................................................................................................ 34 Figure 22. Comparison of various amplification layers of the dendritic signal amplification method ..................................... 35 Figure 23. Illustration of signal amplification triggered by antibody-antigen recognition ................................................... 37 Figure 24. Illustration of the SBPN method.................................... 39 Figure 25. Illustration of using of streptavidin-HRP as the signal generating media of the SBPN method .................................... 41 Figure 26. Illustration of using streptavidin coated microsphere as signal generating media as SBPN method ............................... 42. XIII.
(15) Figure 27. Illustration of microsphere aggregations triggered via antibody-antigen recognition ................................................... 43 Figure 28. Experimental procedure for the ABC, DLA, and SBPN methods ................................................................................... 60 Figure 29. Illustration of the experiment that test the antigen binding ability of CapA-PEG 4 -biotin ................................................... 73 Figure 30. Sandwich ELISA using IL-4 ELISA kit ......................... 76 Figure 31. Sandwich ELISA using IL-7 ELISA kit ......................... 77 Figure 32. IL-4 ELISA using IL-4 CapA-PEG4-biotin instead of detection antibody ................................................................... 78 Figure 33. IL-4 ELISA using IL-7 CapA-PEG4-biotin instead of detection antibody ................................................................... 79 Figure 34. Illustration of control experiments that the homogeneous capture antibodies cannot form a sandwich complex with antigen .................................................................................... 81 Figure 35. The capture antibody was added before detection antibody in ELISA (Figure 34a) .............................................. 84 Figure 36. The capture antibody was added after detection antibody in ELISA (Figure 34b)............................................................. 84 Figure 37. The PBS-10 was added before detection antibody in ELISA (Figure 34c). ................................................................ 85. XIV.
(16) Figure 38. The PBS-10 was added after detection antibody in ELISA (Figure 34d). ........................................................................... 85 Figure 39. The capture antibody replaces detection antibody in ELISA (Figure 34e). ................................................................ 86 Figure 40. The normal ELISA process (Figure 34f)........................ 86 Figure 41. The calibration curve of the Bradford assay .................. 88 Figure 42. The SDS-PAGE image for verification of synthesis of biotinylated BSA ..................................................................... 90 Figure 43. MALDI-TOF-MS spectrum of BSA .............................. 91 Figure 44. MALDI-TOF-MS spectrum of BSA-PEG4-biotin ......... 92 Figure 45. The linkage among detection antibody, streptavidin and biotinylated BSA ..................................................................... 95 Figure 46. The results of the binding ability among detection antibody, BSA-PEG 4 -biotin, and streptavidin ......................... 98 Figure 47. The image results of the DLA method and various SBPN cycles on a biotinylated antibody coated surface ................... 101 Figure 48. Comparison of the DLA and SBPN (1-10 cycles) methods .............................................................................................. 104 Figure 49. Comparison of the DLA and SBPN (1-10 cycles) methods using normalized data ........................................................... 105. XV.
(17) Figure 50. The microtiter well images generated from the DLA and SBPN (15 and 20 cycles) methods performed on a biotinylated antibody coated surface ......................................................... 107 Figure 51. The microtiter well images generated from the DLA and SBPN (5 and 30 cycles) methods performed on a biotinylated antibody coated surface ......................................................... 108 Figure 52. The microtiter well images generated from the DLA and SBPN (10 and 25 cycles) methods performed on a biotinylated antibody coated surface ......................................................... 109 Figure 53. Comparison of the various SBPN cycles from 5 to 30 cycles performed on a biotinylated antibody coated surface ........ .............................................................................................. 109 Figure 54. Comparison of the DLA and SBPN (5-30 cycles) methods performed on a biotinylated antibody coated surface ............. 112 Figure 55. Comparison of the DLA and SBPN (5-30 cycles) methods performed on a biotinylated antibody coated surface using normalized data ..................................................................... 113 Figure 56. Illustration of the ability to detect surface biotinylated antibodies using the ABC, DLA, and SBPN methods (20 cycles) .............................................................................................. 116 Figure 57. Comparison of the ABC, DLA, and SBPN methods (20 cycles) ................................................................................... 119. XVI.
(18) Figure 58. Comparison of the ABC, DLA, and SBPN (20 cycles) methods performed on a biotinylated antibody coated surface using normalized data ........................................................... 120 Figure 59. Comparison of the ABC, DLA, and SBPN (5 cycles) methods performed on a biotinylated antibody coated surface. .............................................................................................. 122 Figure 60. Comparison of the ABC, DLA, and SBPN (5 cycles) methods performed on a biotinylated antibody coated surface .............................................................................................. 125 Figure 61. Comparison of the ABC, DLA, and SBPN (5 cycles) methods performed on a biotinylated antibody coated surface using normalized data ........................................................... 126 Figure 62. The linkage among streptavidin, biotinylated BSA and streptavidin coated microsphere ............................................ 127 Figure 63. The controlled experiments that support the binding ability among BSA-PEG 4 -biotin, streptavidin and streptavidin coated microspheres .............................................................. 130 Figure 64. The result of experiments suggesting that the streptavidin coated microspheres were bound to the surface B-BSA ........ 132 Figure 65. The access to take the pictures of a microtiter well. ..... 133 Figure 66. The visual detectable signal of streptavidin coated microsphere ........................................................................... 134. XVII.
(19) Figure 67. The positive controls that confirmed BSA-PEG 4 -biotin was coated on the surface of microtiter ................................. 137 Figure 68. The photograph result of streptavidin coated microsphere added to BSA-PEG 4 -biotin (5.69×10¹¹ molecules) surface .... 138 Figure 69. The photograph result of streptavidin coated microsphere added to BSA-PEG 4 -biotin (5.69×10¹⁰ molecules) surface.... 139 Figure 70. The photograph result of streptavidin coated microsphere added to BSA-PEG 4 -biotin (5.69×10⁹ molecules) surface ..... 140 Figure 71. The photograph result of streptavidin coated microsphere added to blank surface ........................................................... 141 Figure 72. Evidences for the synthesis of IL-7 CapA-PEG 4 -biotin. The IL-7 CapA-PEG 4 -biotin and IL-7 capture antibody were coated on the microtiter plate plus one blank control............. 143 Figure 73. The synthesis process of antibody coated microsphere ...... .............................................................................................. 144 Figure 74. The evidences for the attachment between IL-7 CapA-PEG 4 -biotin and streptavidin coated microsphere as well as IL-7 detection antibody and streptavidin coated microsphere .............................................................................................. 145 Figure 75. The non-specific aggregation of antibody coated microspheres in non-antigen condition with various pH at 4 °C for 48 h ................................................................................. 147. XVIII.
(20) Figure 76. The separation of non-specific aggregated microspheres by 1 min ultrasonic water bath .............................................. 148 Figure 77. The results of experiments with antigen (2440 pg/mL) at various pH after 1 min ultrasonic water bath ......................... 149 Figure 78. The results of antigen (2440 pg/mL) control at pH 8.92 after 5 min ultrasonic water bath ........................................... 150. XIX.
(21) 利用卵白素與生物素標記之蛋白質形成聯集網路達到目 標蛋白質訊號放大 指導教授:蘇楷立博士 國立高雄大學應用化學系 學生:朱峪緯 國立高雄大學應用化學系 摘要 酵素連結免疫吸收分析法是目前廣泛應用於偵測人體病原的方式。近年來許多的 病原訊號放大研究都是利用此種抗體-抗原辨識關係為基礎平台做進一步的發展。雖 然現在已經有研究結果可大幅降低檢測方法對病原的偵測極限,但因為此類方法皆有 高成本的缺點,對於實際應用於生活中還有很大的挑戰。所以一種成本低廉且可快速 檢測病原的診斷裝置仍然是有待研究與開發的。本論文研究的方式是利用卵白素與生 物素的結合反應來建立一套新的訊號放大方法。卵白素為四聚體蛋白質,最多可同時 與四個生物素結合,因此卵白素可輕易與生物素化蛋白質結合產生蛋白質聚合物。方 法概念是利用卵白素與生物素化蛋白質的交聯反應在抗體-抗原三明治型錯合物上形 成一可偵測之蛋白質聚合物。利用逐層結合的卵白素與生物素化蛋白質產生具有大量 生物素在表面的蛋白質聚和物。此生物素表面可與卵白素修飾之訊號產生媒介結合, 訊號產生媒介即可放大表面抗體-抗原聚合物的訊號。在一模擬的免疫分析實驗中, 結果顯示我們的方法與商業化方法比較下可以降低表面蛋白質目標物偵測極限達 112 倍。. 關鍵字:酵素連結免疫吸收分析法、訊號放大法、免疫分析、卵白素、生物素化、 1.
(22) 蛋白質聚合物、蛋白質交聯反應. 2.
(23) Use of streptavidin and biotinylated protein networks in target protein signal amplification Advisor(s): Dr. James R. Carey Department of Applied Chemistry National University of Kaohsiung Student: Yu-Wei Chu Department of Applied Chemistry National University of Kaohsiung ABSTRACT Enzyme-linked immunosorbent assay (ELISA) is the current method to diagnose presented antigen in human fluids. In recent years, various studies were proceeded base on this platform in order to generate an amplified signal from the antibody-antigen recognition event. Although there are few studies demonstrating a low-level detection limit to detect antigen, the high cost of method is challenged to practice. Therefore a diagnostic device with rapid detection and low cost is needed. We introduce a signal amplification method utilizing the streptavidin-biotin interaction. Since streptavidin is a tetramer for biotin binding, streptavidin can easily form a protein polymer with biotinylated proteins. The method described herein involves streptavidin crosslinking with biotinylated proteins to generate a large detectable protein polymer at the initial antibody-antigen sandwich complex. Specifically, streptavidins and biotinylated proteins are sequentially introduced to generate a. protein polymer possessing a large biotin surface. The biotin surface is then readily available to bind streptavidin labeled signal generating media to generate further 3.
(24) signal enhancement of surface antibody-antigen complex. During a mock immunoassay experiment, we have demonstrated a 112 fold decrease in detection limit in comparison with commercial available method. Keywords: ELISA, Signal amplification, Immunoassay, Streptavidin, Biotinylation, Protein polymer, Protein cross-linking. 4.
(25) Chapter 1. Research Motivation Technology is steadily improving, and because people are taking an increase interest in their health care and living healthier lifestyles. The detection and analysis of biological molecules have attracted much attention over the past few years, but there remains a great need for improvement.1 It is well understood that some places in the developing world the people are so poor that even if there are advanced instruments available that could detect diseases, it is still unusable for them because they have no one who is trained to use the instruments.2 The problem is that the instruments are unaffordable at these locations so when someone falls ill, the mortality rate is high. Unless proper treatment is given rapidly, the patients’ morbidity and mortality increases.3 Bloodstream infections are the most serious problems in patient care because they are associated with significant morbidity and mortality.3 It is known that even least than one bacteria in 1 mL blood sample (1 CFU/mL) would cause bloodstream infection.4 Blood cultures in liquid medium are the gold standard for the diagnosis of bloodstream infections currently for the past 30 years.1,3,5 Blood culture technique is accomplished by a multistep, time-intensive process which commonly cost more than 5 days and the contamination of blood cultures, for instance false-positive blood cultures is a common problem within the hospital setting.3,6,7. 5.
(26) To overcome aforementioned limitations, needed is a device that has advantages including low cost, ease of use, high sensitivity, and rapid detection.8 Enzyme-linked immunosorbent assay (ELISA) is relative rapid method for disease detection. ELISA is a routine operated method which usually can be done within 5 hours, but the detection limit of ELISA does not permit to detect the low concentration of analyte such as microorganism and some diseases with low antigen concentration. In this study, in order to achieve the biosensor device criteria described above, we take the rapid detection and easy operation advantages of ELISA with a signal amplification strategy. The method described herein is a method to generate large dateable protein polymer on a target protein by amplifying the streptavidin-biotin recognition event.. 6.
(27) Chapter 2. Literature Review 2.1 Antibody-antigen interaction Antibody is a Y-shape protein produced by the immune system of vertebrates and is essential for the prevention of infection by foreign invaders which is referred to as antigen. Antibody-antigen interactions have high affinity and selectivity. An antibody is immunoglobulin which consists of two heavy chains and two light chains (Figure 1). The heavy and light chains are connected together via disulfide bond linkages. The structure of antibodies can be distinguished into the variable region and the constant region. The amino acid components in the variable region are different among antibodies for specific antigen binding ability while the amino acid components in the constant region are similar. An antigen is a general term for any molecule that may trigger antibody generation, with potentially many different surface features. Each antibody binds to a particular part of the antigen called an epitope. An antibody has at least two antigen-binding sites.9-11 The relationship of antigen and antibody are can be though as a lock to a key.9 The binding of an antigen to an antibody takes place by the formation of multiple non-covalent bonds including van der Waals forces, hydrogen bonds, ionic force, and hydrophobic force between the antigen and the amino acids of the binding site in antibody.9-11 The binding affinity of antibody-antigen recognition is quite strong (Kd 10-8-10-10 M).12-14. 7.
(28) Figure 1. The structure of antibody. An antibody is immunoglobulin which consists of two heavy chains and two light chains. The heavy and light chains are linked together via disulfide bond linkages. The structure of antibodies can be distinguished into the variable region and the constant region.. 2.2 Streptavidin and biotin Streptavidin is a well-studied tetramer protein (Figure 2). It is isolated from the bacteria Streptomyces avidinii and composed of four identical chains, each chain is about 15 kDa in size.15 Biotin, also known as vitamin H, is a small molecule with a double-ring structure and a carboxyl acid side chain (Figure 3). The molecular weight of biotin is 244 gmol-1.16 Streptavidin binds to biotin at four binding sites; two binding sites on each of two opposing faces of the molecule with an extremely high binding constant (Kd 10-15 M). This binding is one of the strongest bindings in nature.17 The high affinity between streptavidin and biotin comes from several. 8.
(29) aspects. These factors include the formation of multiple hydrogen bonds and van der Waals interactions between biotin and streptavidin. Furthermore the ordering of surface polypeptide loops bury the biotin in the protein interior.15 As consequence, the binding of biotin involves a highly stabilized network of polar and hydrophobic interactions.17 Structural alterations at the biotin binding site produce quaternary changes. in. the. streptavidin. tetramer.. The. high. affinity. of. the. biotin-streptavidin binding event is one of the most popular tools in biochemical research and offers useful analytical advantages.18-23 Figure 2 is the protein structure image of streptavidin generated from UCSF Chimera. Protein data file is from the Protein Data Bank.24 PDB ID is 1WSE.. Figure 2. The structure of streptavidin. Streptavidin is a tetramer which has four biotin binding sites. The Protein Data Bank (PDB) ID is 1WSE.. 9.
(30) O HN H. NH H S. COOH. Figure 3. The structure of biotin. Biotin is a small molecule with a double-ring structure and a carboxyl acid side chain.. 2.3 Sodium dodecyl sulfate polyacrylamide gel electrophoresis Sodium dodecyl sulfate polyacrylamide gel electrophoresis (SDS-PAGE) is a technique that can separate proteins of varying sizes. Separation of proteins using PAGE in the presence of the anionic detergents such as SDS can help separate protein molecules of a variety of shapes and sizes. Since this technique is dependent on the molecular weights of the polypeptide chains, the object is to unfold the proteins so that the proteins no longer have any secondary, tertiary or quaternary structure. Protein samples are unfolded and become linear protein chains with negative charge by treating with SDS in boiling water bath because SDS has two different ends, one is hydrophobic one is hydrophilic. The hydrophobic end can enter the protein hydrophobic pocket and the hydrophilic end can bind to water. This destroys the tertiary structure of protein. In addition, the SDS covers the surface of protein with uniform charge density. Conclude the above, when the negative charged proteins move through the polyacrylamide gel, the structures and surface charge density did not matter the separation event, they will be separated by size because of the pores in the gel.25,26. 10.
(31) 2.4 Enzyme-linked immunosorbent assay Enzyme-linked immunosorbent assay (ELISA) is a commonly used immunoassay in hospital.27 By means of antibody-antigen interaction, the components of a sandwich ELISA include a capture antibody, antigen, detection antibody and streptavidin conjugated horseradish peroxidase (S-HRP) that can react with 3,3',5,5'-tetramethylbenzidine (TMB). The S-HRP reacts with TMB to generate a signal that is measured using common microtiter plate reader.28 When performing the ELISA, the capture antibody is first immobilized on a microtiter plate surface followed by a bovine serum albumin (BSA) blocking step. The detection antibody (biotinylated antibody) is added into the surface after the unbounded antigen (analyte) is washed away. The S-HRP is added into the plate well after the unbounded antibody is washed. TMB is added to generate the signal after the S-HRP was incubated and washed. The signal of the ELISA is readily measured using a plate reader after the proper incubation time of TMB (Figure 4).28. 11.
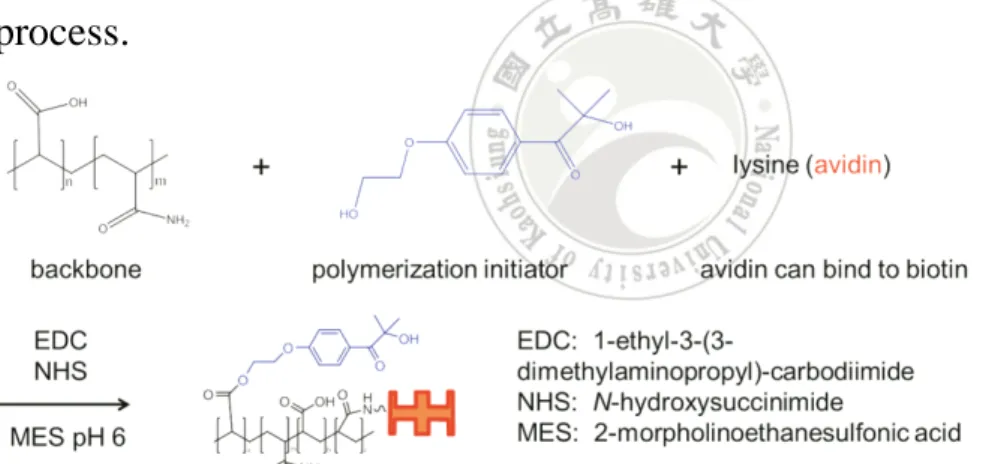
(32) Figure 4. Illustration of sandwich ELISA. A sandwich ELISA contains a capture antibody, antigen, detection antibody and streptavidin conjugated horseradish. peroxidase. (S-HRP). that. can. react. with. 3,3',5,5'-tetramethylbenzidine (TMB). The S-HRP reacts with TMB to generate a signal that is measured at 450 nm using common microtiter plate reader.. 2.5 Signal amplification via photopolymerization The concept introduced here was using visual detectable polymer as the signal of immunoassay. The polymerization initiator was attached on the biotinylated target and the signal was produced during the polymerization process (Figure 5). The breakthrough of this idea gave a chance to design a diagnostic device whose signal could be detected by naked eye.8 Using a dual-functional macromolecule that is capable both of selective recognition and of initiating a polymerization reaction is the key of the method.8 This polymerization can amplify the recognition event on a surface.29 The. 12.
(33) synthesis scheme of dual-functional macromolecule is in the Figure 6.. Figure 5. Illustration of using visual detectable polymer as signal of immunoassay. The polymerization initiator was attached to the biotinylated target and the signal was produced and amplified during the polymerization process.. Figure 6. Synthesis of dual-function molecule. Initiators (blue) were linked to the -COOH groups of the copolymer through ester linkages. Avidin (red) is linked to the acrylamide groups of the copolymer through amide linkages. Adapted by permission from Macmillan Publishers Ltd: [Nature Materials] (Sikes, H. D.; Hansen, R. R.; Johnson, L. M.; Jenison, R.; Birks, J. W.; Rowlen, K. L.; Bowman, C. N. Nat. Mater. 2008, 7, 52-56.), copyright (2008). 13.
(34) In selective recognition part of the detection and amplification scheme, the authors chose avidin that has high binding affinity to biotin. The avidin (streptavidin)-biotin interaction has been ubiquitously used in several biological and chemical fields. In the polymerization part of the detection scheme, photoinitiated carbon-based radicals that are derived from organic initiator molecules react with the carbon-carbon double bonds of acrylate monomers, and large polymers are formed via a chain-growth mechanism. The concept of amplification is inherent in chain-growth polymerization reactions owing to the extremely large number of propagation steps that result from a single initiation event. Optical thin-film biosensor surfaces were prepared and biotinylated oligonucleotides were covalently coupled to the surfaces through hydrazone linkages. This is followed by the addition of a dual-functional macromolecule which consisted of an avidin and a photopolymerization initiator. The avidin binds to the biotin bound to the oligonucleotide. As shown in Figure 7, the addition of monomer solution followed by exposure to light will initiate the polymerization. Figure 8 displays the result of using dual-functional macromolecule to detect the surface biotinylated oligonucleotide through photopolymerization. The white spot in the picture is the polymer product which can be detected by naked eye. The detection limit for surface biotinylated oligonucleotide using the photopolymerization method is 6×10³ molecules which is 1000 fold lower 14.
(35) than using S-HRP to detect the surface biotinylated oligonucleotide (4×10⁶ molecules).. Figure 7. Illustration of signal amplification via photopolymerization. Biotinylated oligonucleotides covalently coupled to the surface. The dual-functional macromolecules are introduced to the surface. The polymer products were formed after photopolymerization. Adapted by permission from Macmillan Publishers Ltd: [Nature Materials] (Sikes, H. D.; Hansen, R. R.; Johnson, L. M.; Jenison, R.; Birks, J. W.; Rowlen, K. L.; Bowman, C. N. Nat. Mater. 2008, 7, 52-56.), copyright (2008).. 15.
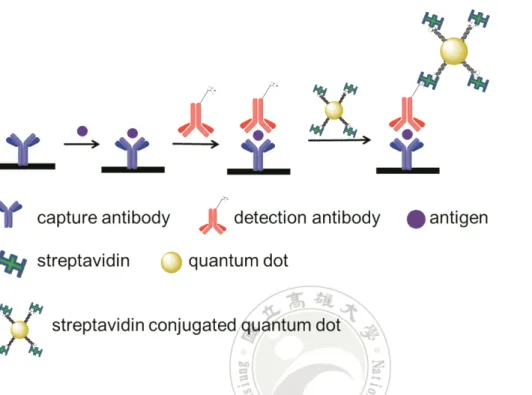
(36) Figure 8. The result of using dual-functional macromolecule to detect the surface biotinylated oligonucleotide through photopolymerization. The white spot. in. the. picture. is. the. polymer. product. generated. from. photopolymerization. The number in the right rectangle is the amount of surface biotinylated oligonucleotides (molecules). Adapted by permission from Macmillan Publishers Ltd: [Nature Materials] (Sikes, H. D.; Hansen, R. R.; Johnson, L. M.; Jenison, R.; Birks, J. W.; Rowlen, K. L.; Bowman, C. N. Nat. Mater. 2008, 7, 52-56.), copyright (2008).. 2.6 Use of quantum dots as signal source of immunoassay Quantum dots are semiconductor nanoparticles that have fluorescence emission. Due to the broad, continuous excitation spectrum and the narrow, tunable emission spectrum characters of quantum dots, they have been utilized as fluorescent probes in both biological staining and diagnostic methods.30-35 Generally, the streptavidin conjugated quantum dot is bound to a biotinylated antibody-antigen complex or biotinylated DNA probe using streptavidin-biotin interaction. The quantum dots can be then excited and emits at specific wavelength as the signal of target analyte (Figure 9).31-34 The 16.
(37) detection limit for carcinoembryonic antigen (CEA) using quantum dot is lower than 10-12 M.31 The detection limit of commercial CEA ELISA kit is around 10-12 M.36. Figure 9. Illustration of immunoassay using quantum dots. The streptavidin conjugated quantum dot is bound to a biotinylated antibody-antigen complex.. 2.7 Immunoassay with rolling circle amplification 2.7.1 Rolling circle amplification Rolling circle amplification (RCA) uses circular DNA templates as substrates for DNA synthesis by using DNA polymerase enzymes. Small chemically synthesized circular oligodeoxynucleotides (plasmids) are efficient substrates for a number of polymerases. The plasmid can produce repeating DNA strands which are end-to-end copies of the circular template.37 To initiate the amplification, first, it starts with a single stranded DNA 17.
(38) (primer) which has a free 3' hydroxyl end and 5' phosphate end bound on the surface. Next, a circular DNA template is added and the free 3' hydroxyl end of the single stranded DNA will bind to the template. This free 3' hydroxyl end is similar to the primer in the PCR process used for DNA synthesis. Third, DNA polymerase is introduced and binds to the 3' hydroxyl end. Finally, DNA polymerase begins to copy the DNA template. When the coping process finishes the first cycle, the special DNA polymerase will displace the 3' hydroxyl end which initially bound with circular DNA template and allows the coping process to continue. This mechanism repeats many times resulting in single strand DNA that is composed of thousands connected copies (Figure 10).37. Figure 10. Illustration of rolling circle amplification. (a) The DNA strand with the 5' phosphate end (red line) binds to the surface (black line). (b) The 3' hydroxyl end (blue line) binds to DNA template (black circle). (c) Add DNA polymerase (red circle). (d) Start copying the DNA template. (e) DNA polymerase displaces the 3' hydroxyl end of initial DNA. (f) RCA result. 18.
(39) 2.7.2 ImmunoRCA An adaptation of the rolling circle amplification (RCA) reporter system exists for the detection of an antibody-antigen complex, termed immunoRCA. In immunoRCA, the 5’ end of an oligonucleotide primer binds to an antibody-antigen complex. This oligonucleotide primer sequence is extended in the presence of circular DNA, DNA polymerase, and nucleotides. The amplified DNA could be detected using various methods such as direct incorporation of hapten labeled or fluorescently labeled nucleotides, by hybridization. of. fluorescence. labeled. or. enzymatically. labeled. complementary oligonucleotide probes (Figure 11).38 There is an example using immunoRCA to detect α-fetoprotein (AFP) in the literature. It showed a 100 fold lower detection limit comparing to normal ELISA which using S-HRP as signal generating media (Figure 12).38 Unfortunately, there are relatively few examples of quantitative chip-based RCA because the high background associated with RCA limits its sensitivity as compared to normal ELISA methods.39. 19.
(40) Figure 11. Illustration of the immunoRCA method. Streptavidin serves as a bridge to connect primer and antibody-antigen complex. The DNA template and DNA polymerase start working to generate copies of single strand DNA. The fluorescence labeled single strand DNA is finally introduced to bind to the amplified strand DNA. Reprinted from Analytical Biochemistry, Vol. 416, Farhima Akter, Masayasu Mie, Eiry Kobatake, Immuno-rolling circle amplification using a multibinding fusion protein, Pages 174-179, Copyright (2011), with permission from Elsevier.. 20.
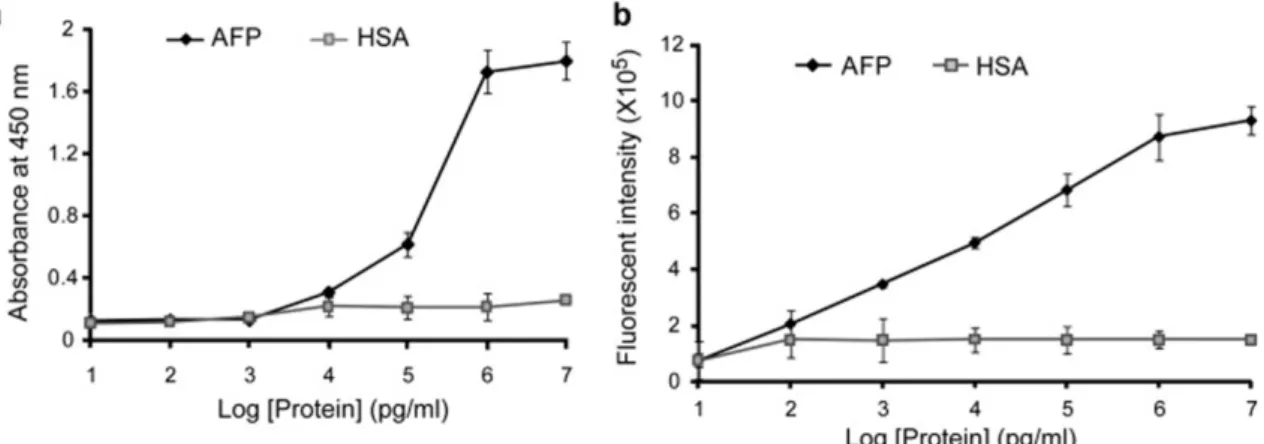
(41) Figure 12. Comparison of the ELISA and immunoRCA methods for the detection of α-fetoprotein (AFP). The detection limit of the immunoRCA method (b) for AFP is 2 orders lower than the ELISA method (a). Human serum albumin (HSA) was used as a negative control. Reprinted from Analytical Biochemistry, Vol. 416, Farhima Akter, Masayasu Mie, Eiry Kobatake, Immuno-rolling circle amplification using a multibinding fusion protein, Pages 174-179, Copyright (2011), with permission from Elsevier.. 21.
(42) 2.8 Immunoassay using GMR sensor as detector 2.8.1 Spin valve giant magnetoresistance effect Spin valve Giant magnetoresistance effect (GMR) is a quantum mechanical effect observed in layered magnetic thin-film structures. The structure is consisted of a nonmagnetic layer which is placed in between 2 ferromagnetic layers (Figure 13). When the magnetic moments of the ferromagnetic layers are parallel aligned, the spin-dependent scattering of the carriers (electrons) is minimized. The electrons pass the film easily and the material has its lowest resistance. On the other hand, when the ferromagnetic layers are anti-aligned, the spin-dependent scattering of the carriers (electrons) is maximized. The electrons hardly pass the film and the material has its highest resistance (Figure 14).40 GMR effect is very sensitive to the change of external magnetic field. The magnetic moment directions of materials are effected by the external magnetic fields. These materials can generate significant changes in resistance responding to relative small magnetic fields and operate at rt.40. Figure 13. Specific layered magnetic material required for giant magnetoresistance effect. The anti-ferromagnetic layer is placed between ferromagnetic layers. 22.
(43) Figure 14. Illustration of spin valve GMR sensor. The directions of the magnetic moments are manipulated by external magnetic fields that are applied to the materials. When the magnetic moments of the ferromagnetic layers are parallel aligned, the resistance is low. When the magnetic moments of the ferromagnetic layers are anti-aligned, the resistance is high.. 23.
(44) 2.8.2 GMR biosensor The GMR biosensor was utilized the streptavidin coated magnetic nanoparticle to be the signal generation media of GMR sensor. The capture antibody was coated on the GMR sensor. Therefore the capture antibody-antigen-detection antibody complex was formed on the sensor surface in the same way as normal sandwich immunoassay process. The streptavidin coated magnetic nanoparticle was added in the present of constant outer magnetic field and the nanoparticle was bound to detection antibody via streptavidin-biotin interaction (Figure 15).41-44 The GMR biosensor enjoys a 1000 fold lower detection limit and larger linear dynamic range for the detection of carcinoembryonic antigen (CEA) when comparing to a normal ELISA (Figure 16). Since the signal source of the GMR sensor is from the changes of magnetic field and there are no magnetic materials in bodily fluid, the GMR biosensor does not have background issue which normally found in common assays.41. 24.
(45) Figure 15. Illustration of GMR biosensor. The streptavidin coated magnetic nanoparticle was bound to the antibody-antigen complex. The addition of magnetic particle will change the magnetic field strength on the surface of sensor so that the sensor can detect the streptavidin-biotin recognition event by monitor the change of the signal. Adapted by permission from Macmillan Publishers Ltd: [Nature Medicine] (Gaster, R. S.; Hall, D. A.; Nielsen, C. H.; Osterfeld, S. J.; Yu, H.; Mach, K. E.; Wilson, R. J.; Murmann, B.; Liao, J. C.; Gambhir, S. S.; Wang, S. X. Nat. Med. 2009, 15, 1327-1332.), copyright (2009).. 25.
(46) Figure 16. Comparison of the GMR biosensor and ELISA on the detection of CEA. The results of the GMR biosensor and ELISA are displayed in blue and green, respectively. The GMR biosensor has lower detection limit and larger linear dynamic range than ELISA. Adapted by permission from Macmillan Publishers Ltd: [Nature Medicine] (Gaster, R. S.; Hall, D. A.; Nielsen, C. H.; Osterfeld, S. J.; Yu, H.; Mach, K. E.; Wilson, R. J.; Murmann, B.; Liao, J. C.; Gambhir, S. S.; Wang, S. X. Nat. Med. 2009, 15, 1327-1332.), copyright (2009).. 26.
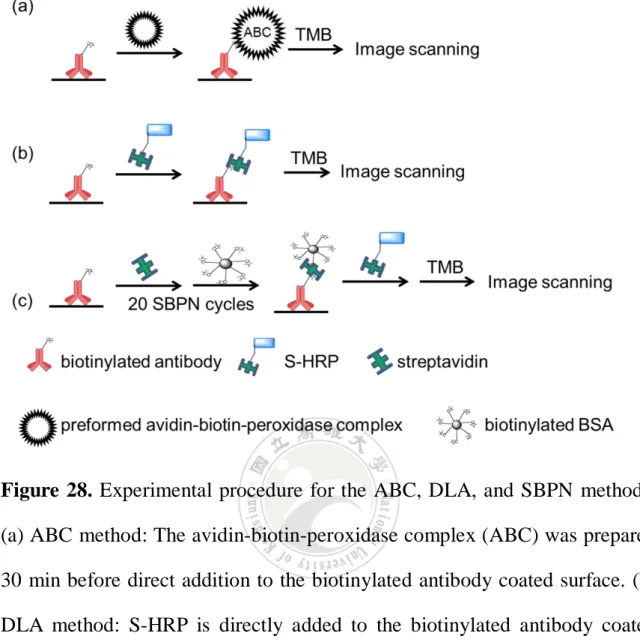
(47) 2.9 Avidin-biotin-peroxidase complex based signal generation The concept of utilizing strept(avidin) and biotinylated protein to form a protein. complex. has. been. reported. and. commercialized. as. the. avidin-biotin-peroxidase complex (ABC) method. The ABC method is a well-known technique that stains the antibody-antigen recognition event using the avidin-biotin interaction (Figure 17b).45-48 The ABC is a pre-formed complex prepared by mixing a specific ratio of avidin and biotinylated peroxidase before adding the complex to a surface (Figure 17a).45 A disadvantage of the ABC method is that the premixed complex may become too large and may limit its ability to bind to the biotinylated sandwich complex due to steric hindrance or size related effects.49,50 Thus, the signal of the ABC method may be limited due to the size of the pre-formed protein complex. [Chu, Y. W.; Wang, B. Y.; Lin, H.-S.; Lin, T.-Y.; Hung, Y.-J.; Engebretson, D. A.; Lee, W.; Carey, J. R. Chem. Commun. 2013, in press, DOI: 10.1039/c2cc38233d] - Reproduced by permission of The Royal Society of Chemistry.. 27.
(48) Figure 17. Illustration of the avidin-biotin peroxidase complex (ABC) method. (a) The ABC is formed by mixing biotinylated peroxidase with relative excess avidin together. (b) The ABC product is further added into the biotinylated target to generate signal which is from the interaction of peroxidase and substrate of peroxidase.. 28.
(49) 2.10 Polymer formed by interprotein heme-heme pocket interactions This technique is based on the nature binding ability between heme group and its matched apoprotein. The hemeprotein was added an additional heme group at the back to be the monomeric hemeprotein unit. The heme in the modified hemeprotein was taken out through an acidic extraction. When the pH of system returned back to neutral, the apoprotein will bind to the heme group on another apoprotein via the interprotein heme-heme pocket interactions. Consequently, a unique supramolecular polymer was obtained (Figure 18).51. Figure 18. Formation of self-assembly of supramolecular polymer via heme-heme pocket interaction. (a) Hemeprotein was modified with another heme group at the back. (b) The heme in the protein was taken out in acidic condition and the protein became apoprotein. (c) The heme modified apoproteins were connected together to be a linear polymer when the system became neutral again. 29.
(50) The concept of interprotein heme-heme pocket interactions could be further applied on the nanoparticle. The nanoparticle was modified with heme groups. The double-head apoprotein dimer was prepared and acted as the bridge between modified nanoparticles. Since the heme groups were modified on the surface the nanoparticle, the 3D-orientation polymer will be formed consequently (Figure 19).52. Figure 19. Formation of nanoparticle based supramolecular polymer via heme-heme pocket interaction. The heme modified nanoparticles were connected together through apoprotein dimers.. 30.
(51) 2.11 Signal enhancement of impedance measurement via the biotinylated antibody-streptavidin complex Impedance spectroscopy is a general term that includes the small-signal measurement of the linear electrical response of a material and analysis of the physicochemical properties.53 Impedance spectroscopy is effective to study the interfacial character of modified electrodes, chemical transformations and processes related to the conductive material. The adsorption or desorption of reagents on conductive supports could change the interfacial electron-transfer features on the surface of electrode.54 Impedance spectroscopy can serve as biosensor when the electrode is immobilized with capture antibody. The formation. of. antibody-antigen. recognition. event. can. change. the. electrochemical impedance. The antibody-antigen complex will hinder to redox couple. As the result, the election transfer resistance is increase and the capacitance is decrease.54 The method introduced here use biotinylated antibody-streptavidin complex to increase the hinder effect. The biotinylated antibody-streptavidin complex will bind to the capture antibody-antigen-detection antibody complex on the electrode (Figure 20). The resistance will get higher when the big protein network binds to the electrode.54 The author of paper did not provide the method or characterization information for the synthesis of biotinylated antibody-streptavidin complex. I have asked the author about the information regarding synthesis. of biotinylated 31. antibody-streptavidin.
(52) complex and I did not receive any responds from them.. Figure 20. Using biotinylated antibody-streptavidin complex to enhance the signal of impedance spectroscopy. Reprinted from Biosensors and Bioelectronics, Vol. 16, Renjun Pei, Zhiliang Cheng, Erkang Wang, Xiurong Yang, Amplification of antigen-antibody interactions based on biotin labeled protein-streptavidin network complex using impedance spectroscopy, Pages 355-361, Copyright (2001), with permission from Elsevier.. 32.
(53) 2.12 Dendritic signal amplification Dendritic amplification is a concept that amplifying the target signals by a layer by layer growth of supramolecular assembly. Generally, dendritic amplification method requires a pair of connecters. The connecters can be proteins, molecules, or particles. The connecter should have multivalent linking ability to connect each other and generate a next cross-linking cycles. The connecter should also bind to the target analyte by either direct or indirect linkage.55 Dendritic signal amplification has been employed as a signal enhancement means in DNA sensors and immunoassays.55-61 Take the recently published work by Maeda’s group as an example. Fluorescence labeled streptavidin (F-SA) and biotinylated anti-streptavidin antibody (B-anti-SA) were chosen as the connecters. When processing the assay, F-SA is first added and binds to the surface antibody-antigen sandwich complex. B-anti-SA was then introduced and bind to the streptavidin through streptavidin-biotin. interaction. and. antibody-antigen. interaction.. The. following alternative adding of F-SA and B-anti-SA will generate a dendrimer like protein polymer (Figure 21). The dendritic amplification can put lots of F-SA conjunction with surface antibody-antigen complex and results in signal amplification.55 Take the detection of human C-reactive protein (CRP) as example which is displayed in Figure 22, the detection limit of the no-amplification scheme (n = 0), one layer of amplification (n = 1), and two layers of amplification (n 33.
(54) = 2) are 0.11 nM (13 ng/mL), 11 pM (1.2 ng/mL), and 0.21 pM (24 pg/mL), respectively. The increase of amplification layers significantly improves the detection limit of CRP.55. Figure 21. Illistration of the Dendritic signal amplification method. Fluorescence labeled streptavidin and biotinylated anti-streptavidin antibodies are alternatively added to a antibody-antigen complex surface and result in a protein polymer. Adapted with permission from (Hosokawa, K.; Omata, M.; Maeda, M. Anal. Chem. 2007, 79, 6000-6004.). Copyright (2007) American Chemical Society.. 34.
(55) Figure 22. Comparison of various amplification layers of the dendritic signal amplification method. Black circle dots display the result of no-amplification scheme (n = 0). Black square dots display the result of one layer of amplification scheme (n = 1). Black rhombus dots display the result of two layers of amplification scheme (n = 2). Adapted with permission from (Hosokawa, K.; Omata, M.; Maeda, M. Anal. Chem. 2007, 79, 6000-6004.). Copyright (2007) American Chemical Society.. 35.
(56) Chapter 3. Research Subjects 3.1 Signal amplification triggered by antibody-antigen recognition The idea of the method is from Bowman’s work (section 2.5). Instead of using organic polymerization, we try to generate the large polymer utilizing biological interaction. The concept of the method is that using the large protein cross-linked polymer to detect the antibody-antigen sandwich complex on the surface. A greater degree extent is that make the signal be visual detection. The method introduced here is based on the high binding affinity and selectivity between antibody and antigen. The hypothesis is if antibody and antigen can bind to each other tightly, the layer by layer attachments will lead to visually detectable polymer. The proteins conglomeration result from the use of antibodies labeled streptavidin which can link together through antigen after antibodies labeled streptavidin first bind to the sandwich complex on the surface. The use of different kinds of antibodies labeled streptavidin can avoid the collapse of polymer (Figure 23).. 36.
(57) Figure 23. Illustration of signal amplification triggered by antibody-antigen recognition. (a) Antibody-antigen complex is coated on a surface. (b) The secondary antibody (red) labeled streptavidin is bound to the complex via streptavidin-biotin interaction. (c) The secondary antigen (blue square) and (d) the secondary antibody labeled streptavidin are introduced to initiate the polymerization. (e) The streptavidin which labeled by both secondary and tertiary antibodies are introduced via the antibody-antigen interaction (secondary) to lead the change of antibody type in the polymerization process. (f) The tertiary antigen (black star) and (g) tertiary antibody labeled streptavidin complex are added to keep the growth of protein polymer.. 37.
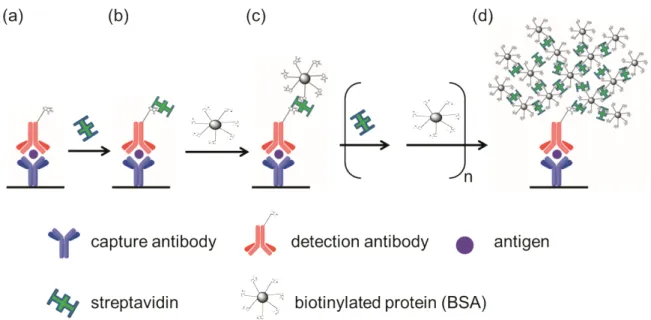
(58) 3.2 Streptavidin biotinylated protein networks (SBPN) 3.2.1 The concept of SBPN method Here we report a protein polymerization method that achieves signal enhancement utilizing the well-known streptavidin-biotin interaction. The amplification is constituted by means of the generation of a network of streptavidins connected to various biotinylated proteins. This method will be referred to as streptavidin biotinylated protein networks, or SBPN. In this study, we choose bovine serum albumin (BSA) as the protein proceeding biotinylation. When performing the SBPN method, streptavidin is first added to the antibody-antigen sandwich complex on a microtiter plate surface, followed by the addition of biotinylated protein. Streptavidin and biotinylated proteins are then added sequentially causing the self-assembly of a large protein polymer that is formed from the initial antibody-antigen recognition event on the surface (Figure 24). One layer of streptavidin added to one layer of biotinylated BSA is defined as one SBPN cycle (Figure 24a-c).62 [Chu, Y. W.; Wang, B. Y.; Lin, H.-S.; Lin, T.-Y.; Hung, Y.-J.; Engebretson, D. A.; Lee, W.; Carey, J. R. Chem. Commun. 2013, in press, DOI: 10.1039/c2cc38233d] Reproduced by permission of The Royal Society of Chemistry.. 38.
(59) Figure 24. Illustration of the SBPN method. (a) The sandwich complex of capture antibody-antigen-detection antibody is formed on a surface. (b) Streptavidin is added to begin the SBPN cycle. (c) Biotinylated BSA is added after the streptavidin layer to form the first SBPN cycle. (d) There is a large biotin surface covering on the initial antibody-antigen sandwich complex when many layers of streptavidin and biotinylated BSA are added to complete the SBPN method. [Chu, Y. W.; Wang, B. Y.; Lin, H.-S.; Lin, T.-Y.; Hung, Y.-J.; Engebretson, D. A.; Lee, W.; Carey, J. R. Chem. Commun. 2013, in press, DOI: 10.1039/c2cc38233d] - Reproduced by permission of The Royal Society of Chemistry.. 39.
(60) 3.2.2 Use of streptavidin-HRP as the signal generating media of the SBPN method The large biotin surface generated by the SBPN method can enable binding of streptavidin through the well-known streptavidin-biotin interaction. The formation of the biotin surface can be verified by simply adding the streptavidin-HRP reagent and measuring the blue color value by using a desktop scanner (Figure 25). A theoretically stronger signal is obtained by in comparison to the normal ELISA process because each sandwich complex on the surface can bind much more streptavidin-HRPs.62 [Chu, Y. W.; Wang, B. Y.; Lin, H.-S.; Lin, T.-Y.; Hung, Y.-J.; Engebretson, D. A.; Lee, W.; Carey, J. R. Chem. Commun. 2013, in press, DOI: 10.1039/c2cc38233d] - Reproduced by permission of The Royal Society of Chemistry.. 40.
(61) Figure 25. Illustration of using of streptavidin-HRP as the signal generating media of the SBPN method. The amount of biotin molecules on the top of sandwich complex is amplified by the SBPN method and allows more binding sites for streptavidin-HRPs.. 3.3 Use bioconjugated microspheres to detect antigen 3.3.1 Use of streptavidin coated microsphere as the signal generating media of the SBPN method The streptavidin and biotinylated BSA network generated by the SBPN method can build a very large biotin domain based on the antibody-antigen interaction. This large amount of biotin could hold the large polystyrene microspheres. which. are. coated. with. streptavidin. through. the. streptavidin-biotin interaction (Figure 26). The large beads will lead the surface signal to visual detection.. 41.
(62) Figure 26. Illustration of using streptavidin coated microsphere as signal generating media as SBPN method. The streptavidin coated microsphere was bound to a huge biotin surface which was generated from SBPN method. The signal of antigen will be amplified by the gigantic bead.. 3.3.2 Antigen triggered self-assembly of antibody coated microspheres Since the antibody can bind to antigen tightly, the concept which using antigen link capture antibody coated microsphere and detection antibody coated microsphere together is possible. The antibody coated microsphere was made by attachment between biotinylated antibody and streptavidin coated microsphere. The advantage of antibody coated microsphere is that the microsphere can be observed by optical microscopy. The hypothesis is if. 42.
(63) capture antibody coated microsphere and detection antibody coated microsphere can bind to antigen, the absence of antigen will trigger the aggregation of microsphere and results in visual detection (Figure 27).. Figure. 27.. Illustration. of. microsphere. aggregations. triggered. via. antibody-antigen recognition. The polymer of microsphere was formed by the combination of capture antibody coated microsphere and detection antibody coated microsphere through antigen. The antigen is visually detected by the microspheres.. 43.
(64) Chapter 4. Experimental Section 4.1 Materials The following buffers were prepared from phosphate buffered saline (PBS). There are 10 types of PBS (PBS 1-10) used in this work and are described below. PBS-1 consists of 140 mM NaCl, 10 mM KCl, 8 mM Na 2 HPO 4 , and 2 mM KH 2 PO 4 at pH 7.4. PBS-1 was prepared by diluting 10× PBS-1. 10× PBS-1 was homemade and consists of 1.40 M NaCl (J. T. Baker, Phillipsburg, NJ), 0.10 M KCl (Showa Chemical, Tokyo, Japan), 0.08 M Na 2 HPO 4 2H2 O (Sigma-Aldrich, St. Louis, MO), 0.02 M KH 2 PO 4 (Sigma-Aldrich, St. Louis, MO) with DI water. PBS-2 consists of 100 mM sodium phosphate, 150 mM NaCl at pH 7.2. PBS-2 was prepared by dissolving PBS powder (product # 28372, Pierce, Rockford, IL) with DI water. PBS-3 was made from PBS-2 by judging the pH to 7.5. PBS-4 consists of 10 mM sodium phosphate at pH 7.4. PBS-4 was prepared by diluting 100 mM sodium phosphate which made by the ionic strength method as follows. 0.10 M NaH2 PO 4 (Sigma-Aldrich, St. Louis, MO) was added to 0.10 M Na 2 HPO 4 (Sigma-Aldrich, St. Louis, MO) until the pH reached 7.4. Tween 20 (Sigma-Aldrich, St. Louis, MO) was used to prepare PBS-5 and PBS-6. PBS-5 was prepared from PBS containing 1% BSA, 0.1% Tween 20. PBS-6 was prepared from PBS containing 0.05% Tween 20. PBS-7 44.
(65) consists of 2.7 mM KCl, 1.5 mM KH 2 PO 4 , 137.0 mM NaCl, and 7.7 mM Na 2 HPO 4 at pH 7.9. PBS-7 was prepared by diluting commercial 10× PBS solution (UniRegion Bio-Tech, Taiwan) 10 fold with DI water. PBS-8 consists of 8 mM sodium phosphate, 2 mM potassium phosphate, 0.14 M NaCl, 10 mM KCl, pH 7.4. PBS-8 was prepared by dissolving PBS powder (product # 28374, Pierce, Rockford, IL) with DI water. PBS-9 was prepared from PBS-4 containing 0.15 M NaCl and 1% BSA. PBS-10 was prepared from PBS containing 1% BSA. PBS-1, 7, and 8 were used to prepare PBS buffers (5, 6, and 10) and used as coating buffer in capture antibody coating step of the ELISA. The role of PBS-1, 7, and 8 are similar in the experiment. We will mention which PBS we used when describing the experimental procedure. PBS-2 was used for the HABA assay, biotinylation reaction and the Bradford protein assay. Both PBS-3 and PBS-4 were used in the dilution of the ABC reagents. PBS-3 was used in Pierce’s ABC kit and PBS-4 was used in Vector’s ABC kit. PBS-5 was used to dilute reagents. PBS-6 was used as wash buffer in wash step. PBS-9 was used to wash microspheres. PBS-10 was used to dilute antigen and detection antibody in the ELISA procedure. The biotinylated protein was synthesized by reaction of EZ-Link NHS-PEG 4 -biotin (Pierce, Rockford, IL) with BSA (Sigma-Aldrich, St. Louis, MO). The concentration of protein was measured by performing the Bradford protein assay (Bio-Rad, Hercules, CA) using purified BSA standard (Pierce, 45.
(66) Rockford, IL). UV-vis spectra were obtained using Thermo Fisher Scientific Inc. BioMateTM 3S. The SDS-PAGE was performed in Mini-PROTEAN® Tetra Cell (Bio-Rad, Hercules, CA). The MALDI-TOF-MS spectra were obtained using Bruker microTOF-Q. The estimation of the mole-to-mole ratio of biotin to protein was achieved by performing the HABA assay kit (Pierce, Rockford, IL). Buffer changes, purification, and concentration of the protein samples were achieved using Amicon Ultra centrifuge filters (Millipore, Billerica, MA). Streptavidins (Jackson ImmunoResearch, West Grove, PA or Pierce, Rockford, IL) are a component of the protein network in this work. Vectastain Elite ABC Staining Kit (Vector, Burlingame, CA) and Ultra-Sensitive ABC Peroxidase Staining Kit (Pierce, Rockford, IL) are obtained to do comparison experiments. Streptavidin coated microspheres (Polyscience, diameter 6 μm) were used as a visual dateable signal of biotinylated protein and were used to synthesize antibody conjugated microspheres. The experiments were performed on a Maxisorp Nunc-Immuno Module microtiter plate (NUNC, Roskilde, Denmark) using the IL-4 and IL-7 Eli-Pair kit (Gen-Probe, Besancon Cedex, France) which contained capture antibody, antigen, detection antibody (biotinylated antibody), streptavidin-HRP (S-HRP) and ready-to-use TMB. The results were recorded using the Epson Perfection V33 scanner and analyzed using ImageJ (NIH, Bethesda, MD)63 after color development was complete. Reagent recipe is summarized in Table 1. 46.
(67) Table 1. Reagent recipe list Reagents PBS-1, pH 7.4. Recipe description Containing 140 mM NaCl, 10 mM KCl, 8 mM Na 2 HPO 4 , 2 mM KH 2 PO 4 (homemade). PBS-2, pH 7.2. Containing 0.10 M sodium phosphate and 0.15 M NaCl (Pierce, product # 28372). PBS-3, pH 7.5. PBS-2 by judging the pH to 7.5. PBS-4, pH 7.4. Containing 0.1 M phosphate (homemade). PBS-5. PBS containing 1% BSA, 0.1% Tween 20 (homemade). PBS-6. PBS containing 0.05% Tween 20 (homemade). PBS-7, pH7.9. Containing 2.7 mM KCl, 1.5 mM KH 2 PO 4 , 137.0 mM NaCl, 7.7 mM Na 2 HPO 4 at pH 7.9 (UniRegion Bio-Tech). PBS-8, 7.4. (Pierce, product # 28374). PBS-9, pH 7.4. PBS-4 containing 0.15 M NaCl and 1% BSA w/v (homemade). PBS-10. PBS containing 1% BSA w/v. 47. sodium.
(68) 4.2 Acronym ABC:. Avidin-biotin-peroxidase complex. BSA:. Bovine serum albumin. BSA-1:. BSA (Sigma-Aldrich, product # A2153-50G). BSA-2:. BSA (Sigma-Aldrich, product # A7906-50G). B-BSA:. BSA-PEG 4 -biotin (biotinylated BSA). B-HRP:. Biotinylated HRP. CapA:. Capture antibody. DetA:. Detection antibody. DLA:. Direct linked amplification. DI water: HABA: HRP:. 4’-hydroxyazobenzene-2-carboxylic acid Horseradish peroxidase. MWCO: PBS:. Double distilled deionized water. Molecular weight cut off. Phosphate buffered saline (see Table 1 for detail recipe description). SBPN:. Streptavidin biotinylated protein networks. S-HRP:. Streptavidin conjugated HRP. Streptavidin-HRP: SμS: SGM:. Streptavidin coated microsphere Signal generating media. SDS-PAGE: TMB:. Streptavidin conjugated HRP. Sodium dodecyl sulfate polyacrylamide gel electrophoresis. 3,3’,5,5’-tetramethylbenzidine. 48.
(69) 4.3 General method 4.3.1 Wash microtiter plate The solution in the microtiter plate was first emptied by shaking upside down. The microtiter plate then gently was tapped on an absorbent paper for several times. The plate was filled with 400 μL/well of PBS-6. The plate was emptied immediately and tapped on an absorbent paper.. 4.3.2 Wash microspheres in Eppendorf The Eppendorf tubes containing microspheres were filled with 400 μL of PBS-9 buffer. The microspheres were suspended via Vortex for 1.5 min and ultrasonic bath for 2 min. The Eppendorf tube containing microspheres was then placed in a centrifuge with 10,000 G for 6 min. The supernatant was drawn out carefully using a pipetman.. 4.3.3 Synthesis of BSA-PEG4-biotin PBS-2 and BSA-1 were used in the experiment. 2 mg (1 vial) of NHS-PEG 4 -biotin was reconstituted by adding 170 μL DI water each vial after equilibrated to rt. 1 mL BSA (2 mg/mL in PBS-2) was mixed with prepared NHS-PEG 4 -biotin samples (20 mM in DI water). The reaction mixture was placed at 4 °C for 2 d to obtain the maximum amount of labeled biotin. The unreacted NHS-PEG 4 -biotin was removed by centrifuge (MWCO 10 kDa) and the buffer was exchanged to PBS-1 by centrifuge (MWCO 10 kDa). The concentration of BSA-PEG 4 -biotin was measured using the Bradford protein assay. The biotin to protein ratio of BSA-PEG 4 -biotin was 49.
(70) measured using the HABA assay.62 [Chu, Y. W.; Wang, B. Y.; Lin, H.-S.; Lin, T.-Y.; Hung, Y.-J.; Engebretson, D. A.; Lee, W.; Carey, J. R. Chem. Commun. 2013, in press, DOI: 10.1039/c2cc38233d] - Reproduced by permission of The Royal Society of Chemistry.. 4.3.4 Bradford protein assay The assay was performed followed by a commercial product protocol. The concentrated dye reagent was dilute 5 folds with DI water and the particles in the solution were removed by filtration. The BSA standard reagent was diluted in 0.2 to 0.9 mg/mL with 5 replicates to generate the calibration curve. 100 μL of BSA standards and the sample protein were mixed with 5 mL diluted dye reagent. The mixtures were incubated at rt for 10 min. The mixtures were moved to disposable cuvette and the absorbance was measured at 595 nm.62 [Chu, Y. W.; Wang, B. Y.; Lin, H.-S.; Lin, T.-Y.; Hung, Y.-J.; Engebretson, D. A.; Lee, W.; Carey, J. R. Chem. Commun. 2013, in press, DOI: 10.1039/c2cc38233d] - Reproduced by permission of The Royal Society of Chemistry.. 4.3.5 HABA biotin quantitation assay The assay was performed followed by a commercial product protocol. The HABA\avidin reagent was reconstituted by 100 μL DI water and mixed with 800 μL PBS-2. The absorbance of HABA\avidin was measured at 500 nm (PBS-2 served as background) and recorded as A500 HABA\avidin. Then the HABA\avidin was mix with 100 μL protein sample solution to be 50.
數據
+7
Outline
相關文件
【5+2產業】亞洲矽谷 電腦資訊技術類 物聯網自動灌溉與排水系統設計班. 【5+2產業】亞洲矽谷
工作人員應穿戴防水手套、口罩等防護衣物,工作完畢後手套應 取下,避免碰觸其他物品而造成污染。消毒劑建議使用 500ppm 漂白水【巿售家庭用漂白水濃度一般在 5 至 6%,以喝湯用的湯 匙舀
‧ 效能:雞肉中含豐富的蛋 白質,搭配香菇的清香鮮 美,能增進食慾。香菇的 營養價值很高含有豐富的 維生素及礦物質,並能幫
Press release: 42 Secondary Schools Offering Science, Technology, Engineering and Mathematics Applied Learning Programme (STEM ALP) Retrieved
質素評核 質素評核將 為此,評核 建議,根據 教育局會在 到校評核工 局提交學校 參加幼稚園 校,可向教 質素評核跟 能達到既定
1.大白兔 2.小貓咪 3.蝸牛
然後,他在同樣的器皿中放入另外一隻大白 鼠,在它掙扎了 5分鐘左右的時候,放入一
多胜肽在十二指腸及空腸受胰蛋白酶 (trypsin) 、胰凝乳 蛋白酶 (chymotrypsin) 及彈性蛋白酶 (elastase) 的消 化分解為多胜肽類及一些胺基酸。.
