行政院國家科學委員會專題研究計畫 期中進度報告
子計畫一:釔鋇銅氧氧化物薄膜物理與元件研究(2/3)
計畫類別: 整合型計畫
計畫編號: NSC93-2112-M-009-013-
執行期間: 93 年 08 月 01 日至 94 年 07 月 31 日
執行單位: 國立交通大學電子物理學系(所)
計畫主持人: 郭義雄
共同主持人: 溫增明,莊振益,林俊源,吳光雄
計畫參與人員: 鄭慧愷,賴良星,林東漢
報告類型: 精簡報告
報告附件: 出席國際會議研究心得報告及發表論文
處理方式: 本計畫可公開查詢
中 華 民 國 94 年 5 月 31 日
本年度研究成果可分為四部份:
(一).發現雷射濺鍍 perovskite 薄膜之成長機制。(在附錄一)
(二).於薄膜濺鍍成長過程,利用溫度緩慢增加,造成 adatom 加速
擴散,量取 RHEED 隨溫度變化時之強度,利用強度在某特定最高值與
Kissenger 之固態反應理論模式,可逕取在薄膜初期成長時之附加原
子之有效熱活化能。(在附錄二)
(三).利用微波量測研究高溫超導體之傳輸物理性質。
(四).微波元件研製。
釔鋇銅氧氧化物薄膜物理與元件研究進度報告
一、摘要
本計劃為利用微波量測研究高溫超導體之傳輸物理及其元件之特
性。在本學年度內,我們不僅完成摻鈣的釔系薄膜(Y
0.7Ca
0.3Ba
2Cu
3O
7-δ)
環形共振器及微帶線共振器的製備,並且藉由控氧技術,我們控制電
洞濃度
p 從過摻雜至低摻雜區,致使我們可以在相同樣品上完成微波
量測工作(包含不同頻率)。經由實驗和理論搭配間接得到複數電導率
1i
2
, 發 覺 到 實 部
1跟 虛 部
2都 具 有 一 熱 活 化 能 隙 (thermal
activation gap)的存在,我們認為這個結果指出古典熱擾動(thermal
fluctuations)在高溫態的超導物理行為上扮演一個很重要的角色。若與
Emery 和 Kivelson 的理論預言相較,頗具一致性的。再者,我們認為
在 薄 膜 樣 品 中 , 當 T<T
c時 有 約 300~400nm 之 超 導 晶 粒
(superconducting grains) 埋 在 非 超 導 矩 陣 (non-superconducting
matrix)中,這在強關聯電子系統常發現到,或許因為有長距離庫倫力
與顆粒邊界所引起的效應,而這種不均勻結構可視為一種具雜亂性組
合之 Josephson 接面網路,可以利用 percolation 理論與 X-Y 模型,用
以分析
1和
2的特性。這個結果指出當降低溫度時這些超導對的電子
扮演一個相當重要的角色。由此,提供在熱平衡時一些在不同電洞濃
度
p 時一些有關物質性質的能量尺度,諸如熱擾動成對時之溫度、在
長距有序參數形成之溫度等,幫助我們了解相分離(phase separation)現
象與相熱擾動在不同材料參數條件下,巨觀的高溫超導傳輸物理性質。
二、計劃執行進度與結果
(一)
高溫超導物理
我們已經完成利用脈衝雷射蒸鍍法 (PLD)在鋁酸鑭(LAO)基板
上 、 下 兩 面 蒸 鍍 摻 鈣 的 釔 系 薄 膜 (Y
0.7Ca
0.3Ba
2Cu
3O
7-δ) 跟 釔 鋇 銅 氧
(YBa
2Cu
3O
7-δ) 薄膜等樣品的製作,藉由控氧技術,我們可以控制樣品
氧含量的多寡,相當於控制樣品的電洞濃度,表一列出實驗的結果,
我們採取以下的經驗公式來決定電洞濃度
p:
(1)
其中,
T
c為臨界溫度。對釔鋇銅氧(YBa
2Cu
3O
7-δ)薄膜而言,我們採取
,max91
cT
K
, 對 摻 鈣 的 釔 系 薄 膜 (Y
0.7Ca
0.3Ba
2Cu
3O
7-δ) 而 言 , 我 們 採 取
,max84
cT
K
。
2 ,max 1 82.6( 0.16) , c c T p T 表一.實驗結果與對應到各種不同的電洞濃度
p。
圖一顯示量測到釔鋇銅氧(YBa
2Cu
3O
7-δ) 薄膜隨不同電洞濃度變化
其表面電阻 R
s隨溫度變化的關係,從圖中很明顯的可以觀察到在溫度
T 接近臨界溫度 T
c時,R
s隨溫度變化的關係是先凹下再急劇的上升,
很明顯具有一凹槽的特性,這種行為可用 critical slowing down 來
說明, 圖二為該釔鋇銅氧(YBa
2Cu
3O
7-δ) 薄膜其表面電抗 X
s在不同電洞
濃 度 時 隨 溫 度 變 化 的 關 係 , 圖 三 顯 示 量 測 到 摻 鈣 的 釔 系 薄 膜
(Y
0.7Ca
0.3Ba
2Cu
3O
7-δ)隨不同電洞濃度變化其表面電阻 R
s隨溫度變化的關
係,在圖中我們觀察到 R
s隨溫度變化的關係是一直在緩慢的上升,並
不具有一凹槽的特性,相較於圖一釔鋇銅氧(YBa
2Cu
3O
7-δ)薄膜的結果有
所不同,圖四為該摻鈣的釔系薄膜(Y
0.7Ca
0.3Ba
2Cu
3O
7-δ)其表面電抗 X
s在
Material
Oxygen
content (7-?)
T
c(K)
Hole concentrations p
YBCO
6.95
91
0.160
YBCO
6.9
90
0.148
YBCO
6.85
86
0.134
YBCO
6.7
63
0.098
YBCO
6.6
54.5
0.090
YBCO
6.5
36.4
0.074
Ca-YBCO
6.95
60
0.218
Ca-YBCO
6.88
68.5
0.207
Ca-YBCO
6.85
78.5
0.188
Ca-YBCO
6.76
73.5
0.121
Ca-YBCO
6.74
68
0.111
Ca-YBCO
6.5
48.5
0.088
薄膜的表面上傳遞時,在 local electrodynamics 的限制下(mean free
path
l
< penetration depth
),其表面電抗 Z
s= R
s+
i
X
s和複數電
導率
1i
2具有以下的關係:
1/ 2 0 1 2(
) .
s s si
Z
R
iX
i
(2)
(2)式經過換算後,我們得到實部電導率
1跟虛部電導率
2對 R
s和 X
s的等式,如下:
1(T)=2
0XsRs/[Xs
2+Rs
2]
2,
(3)
2(T)=
0[Xs
2-Rs
2]/[Xs
2+Rs
2]
2.
(4)
圖五及圖六顯示釔鋇銅氧(YBa
2Cu
3O
7- δ)薄膜及摻鈣的釔系薄膜
(Y
0.7Ca
0.3Ba
2Cu
3O
7-δ)隨不同電洞濃度變化其實部電導率
1隨溫度變化的
關係,在將實部電導率
1對 5K 時的實部電導率
1(5 )
K
歸依化之後對
/
cT T
做圖,結果如圖七所示,在
T T
/
c
0.1
,
1/
1(5 )
K
1
並且此結果和
微觀結構的 disorder 無關,在
0.5
T
c
T
T
c時,由於熱擾動(thermal
fluctuations)造成
1/
1(5 )
K
急劇的下降。為了進一步分析這些實驗結
果,我們採用這個公式
/ 1 1(5 )(1
)
c x T TK
Ae
來擬合這些實驗結果,使
用的軟體是”
OriginR 7.0 SR0”
程式,其中
A
和
x
是兩個擬合參數,擬
合的結果在圖七中的實線跟表二。
表二.擬合實部電導率
1的擬合結果。
若我們定義
x T
c(或
x k T
B c, 單位: meV
)
是一熱活化能隙(thermal
activation gap,
E
g1(0)
),則當實部電導率
1為零時,我們得到另外
一個特徵溫度
* 1ln
cx T
T
A
,圖八顯示
E
g1(0)
* 1T
跟
T
c對不同電洞濃度的變化
圖,值得注意的是
* 1T
對
p
的變化,在低摻雜區時,接近 Emery and
Kivelson 理論所預測的相位有序溫度上限(
maxT
),在過摻雜區時,則
接近平均場的溫度(
T
mean)。實際上,上面的擬合公式可以簡化為
1( ) / 1(5 )(1
)
g B E T k TK
e
,其中
1 1 1 * 1( )
(0)
(0)
g g gT
E
T
E
E
T
,而此項
Eg1( ) /T k TBe
可被
解釋為由於熱擾動造成相位失去的比重,在低溫區時(
T T
/
c
0.1
),這
一項的貢獻幾乎可以忽略,實部電導率
1幾乎達到飽和,事實上,在
5K 時的電導率
1(5 )
K
跟量子電導(quantum conductance:
2e
h
)是可以
連接在一起,只要將量子電導除以一個幾何長度,進一步地,考慮到
樣 品 晶 粒 的 大 小 ( 約 300nm~400nm) 相 當 於 Lee 理 論 的 侷 限 長 度
Material
content (7-?)
Oxygen
T
c(K)
(5K)
nm
x
A
E
g0(
K
)
T
*(K)
YBCO
6.95
91
145
87.3±0.9
99.2±1.7
YBCO
6.9
90
150
86.4±0.9
98.2±1.7
YBCO
6.85
86
160
82.5±0.8
93.7±1.6
YBCO
6.7
63
170
60.4±0.6
68.6±1.1
YBCO
6.6
54.5
190
52.3±0.5
59.4±1.0
YBCO
6.5
36.4
265
0.96±0.01
2.41±0.03
34.9±0.3
39.6±0.6
Ca-YBCO
6.95
60
210
57.6±0.6
65.4±1.1
Ca-YBCO
6.88
68.5
165
65.7±0.6
74.6±1.2
Ca-YBCO
6.85
78.5
155
75.3±0.7
85.6±1.4
Ca-YBCO
6.76
73.5
170
70.5±0.7
80.1±1.3
Ca-YBCO
6.74
68
200
65.2±0.6
74.1±1.2
Ca-YBCO
6.5
48.5
250
46.5±0.4
52.8±0.8
free path(
l
75
nm
),我們認為在我們樣品內的準粒子(quasiparticle)
是處於侷限態,那麼實部電導率
1就無法解釋是由準粒子在電磁場內
運動造成的損耗,在圖九中顯示實部電導率
1(5 )
K
跟 5K 時的超流體密
度
21/
(5 )
K
對 不 同 電 洞 濃 度 的 變 化 圖 , 結 果 顯 示
1(5 )
K
正 比 於
21/
(5 )
K
,這個結果無法用古典的 Drude 模式來解釋,相反的,在巨觀
量子穿隧現象裏,理論預期超流體在經由穿隧效應時,本質上會把損
耗的能量傳給環境(environment),因此,我們認為本實驗的實部電導
率
1(5 )
K
主要是由這個效應造成的。事實上,橫跨我們的環形共振器
寬 0.5mm 約有 1250~1700 個晶界(grain boundaries),在整個薄膜環
形共振器則約有 6510
6~12010
6個晶粒,很自然地,我們可以把這些
超導晶粒看似放在非超導的矩陣上,利用一 percolation 模型,因為
這些超導電流經由穿隧效應而串聯起來,當超導區域大於 percolation
threshold concentration
max( )
c cp
d
f
時,
f
( )
為這種電導的分
佈,我們認為每一個晶粒的電阻(或電導)彼此之間都會被束縛住,而
這些被束縛住的電阻(或電導
)是非常廣泛的分布在整個薄膜表面
上。具體而言,percolation theory 認為這種被束縛住的電導
可以
寫成
0e
,其中
是均勻分布在 0 跟 1 之間,值得注意的是如果是
一種 thermal hopping 的行為(potential barrier,
E
),則電導
正
比於
E k T/ Be
,而此時的電導分佈
f
( )
1
例 如 我 們 計 算 此 時 的 percolation threshold concentration
01
0( )
ln
c c cp
d
f
,亦即
0 c p ce
,當
1
cp
時
1 0 ce
。在此分
佈的情形之下,假若我們直接將電導
取平均,則
0 0 0 ( )1
( )
(
)
d
f
e
.
(5)
進一步地,若是經由 thermal hopping 而造成 percolation,則(5)式
直接可寫成:
/ 0(1
e
E k TB)
.
(6)
事實上,實驗結果也間接證實了 percolation 理論所預測的行為。
現 在 , 我 們 採 用 跟
1相 同 的 分 析 方 法 來 分 析
2, 亦 即
/ 2 2(5 )(1
)
c y T TK
Be
,擬合的結果在表三,而從分析
2中也可得到
另 一 個 thermal activation gap (
E
g2(0)
) , 所 以
2也 可 寫 成
2( ) / 2
(5 )(1
)
g B E T k TK
e
,其中
2 2 2 * 2( )
(0)
(0)
g g gT
E
T
E
E
T
。圖十顯示出
* 2,
T
2(0)
gE
和
T
c(包含從
1得到的
E
g1(0)
跟
T
*1)
,結果顯示
T
*1跟
* 2T
幾乎是一樣
的,我們認為這就是 Emery and Kivelson 所預測的相位有序溫度上限
(
max表三.擬合虛部電導率
2的擬合結果。
最後,我們要強調以上這些實驗結果和微觀的 disorder 無關,我
們樣品晶粒的大小(約 300nm~400nm)相當於 Lee 理論的侷限長度
(localization length,
L202
nm
),而大於 quasiparticle 的 mean
free path(
l
75
nm
),這個結果造成 quasiparticle 都被 localized,
圖十一顯示一些能量尺度
,
0E
g2(0)
,
E
g1(0)
,
,
0
W
and
(分別從實
驗得到或從 Lee 的理論推算出來)對不同電洞濃度
p 時的變化圖,其中
0
是能隙,
W
是兩個 localized state 之 energy level 差,
0是
impurity band 跟
1/
是 scattering rate , 圖 十 一 結 果 顯 示 出
0
E
g1(0)
E
g2(0)
,然而這個結果的物理內涵為何仍舊有待進一度的釐
清。
Material
content (7-?)
Oxygen
T
c(K)
(5K)
nm
y
B
E
g2(0)
* 2T
(K)
YBCO
6.95
91
145
116.4±0.9
98.3±1.2
YBCO
6.9
90
150
115.2±0.9
97.2±1.2
YBCO
6.85
86
160
110.0±0.8
92.9±1.2
YBCO
6.7
63
170
80.6±0.6
68.0±0.8
YBCO
6.6
54.5
190
69.7±0.5
58.8±0.7
YBCO
6.5
36.4
265
1.28±0.01
3.27±0.04
46.5±0.3
39.3±0.5
Ca-YBCO
6.95
60
210
76.8±0.6
64.8±0.8
Ca-YBCO
6.88
68.5
165
87.6±0.6
74.0±0.9
Ca-YBCO
6.85
78.5
155
100.4±0.7
84.8±1.0
Ca-YBCO
6.76
73.5
170
94.0±0.7
79.4±1.0
Ca-YBCO
6.74
68
200
87.0±0.6
73.4±0.9
Ca-YBCO
6.5
48.5
250
62.0±0.4
52.3±0.6
0 10 20 30 40 50 60 70 80 90 100 0.05 0.10 0.15 0.20 0.25 0.30 0.35 0.40 0.45 p 0.160 0.148 0.134 0.098 0.090 0.074 R s (m ) T (K)
圖 1. 釔鋇銅氧薄膜隨不同電洞濃度變化其表面電阻 R
s隨溫度變
化的關係圖。
0 10 20 30 40 50 60 70 80 90 100 0 5 10 15 20 25 30 X s (m ) T(K) p 0.160 0.148 0.134 0.098 0.090 0.074
圖 2. 釔鋇銅氧薄膜隨不同電洞濃度變化其表面電抗 X
s隨溫度變
化的關係圖。
0 10 20 30 40 50 60 70 80 90 0.05 0.10 0.15 0.20 0.25 0.30 0.35 0.40 0.45 p 0.218 0.207 0.188 0.121 0.111 0.088 R s (m ) T(K)圖 3. 摻鈣的釔系薄膜(Y
0.7Ca
0.3Ba
2Cu
3O
7-δ)隨不同電洞濃度變化其
表面電阻 R
s隨溫度變化的關係圖。
0 10 20 30 40 50 60 70 80 0 4 8 12 16 20 24 28 32 p 0.218 0.207 0.188 0.121 0.111 0.088 X s (m ) T(K)圖 4. 摻鈣的釔系薄膜(Y
0.7Ca
0.3Ba
2Cu
3O
7-δ)隨不同電洞濃度變化其
表面電抗 X
s隨溫度變化的關係圖。
0 10 20 30 40 50 60 70 80 90 100 0.0 0.2 0.4 0.6 0.8 1.0 1.2 p 0.160 0.148 0.134 0.098 0.090 0.074 1 (1 0 8 -1 m -1 ) T (K)圖 5. 釔鋇銅氧薄膜隨不同電洞濃度變化其實部電導率
1隨溫度
變化的關係圖。
0 10 20 30 40 50 60 70 80 0.0 0.2 0.4 0.6 0.8 1.0 1.2 p 0.218 0.207 0.188 0.121 0.111 0.088 1 (1 0 8 -1 m -1 ) T(K)圖 6. 摻鈣的釔系薄膜(Y
0.7Ca
0.3Ba
2Cu
3O
7-δ)隨不同電洞濃度變化其
實部電導率
1隨溫度變化的關係圖。
0 2 4 6 8 10 12 14 16 18 20 0.0 0.2 0.4 0.6 0.8 1.0 1 / 1 (5 K ) YBa Y0.7Ca0.3Ba2Cu3O7-d 2Cu3O7-d 0.121 0.111 0.088 p 0.218 0.207 0.188 p 0.160 0.148 0.134 0.098 0.090 0.074 Tc/T
圖 7. 隨著不同電洞濃度變化
1/
1(5 )
K
對 T
c/T 做圖,雖然電洞濃
度不同,但幾乎都座落在相同曲線上,實線為數值擬合的結果。
0.00 0.04 0.08 0.12 0.16 0.20 0.24 0 20 40 60 80 100 120 T c T* Eg1(0) Hole concentration p T (K )圖 8. 熱活化能隙
,
跟 T
對不同電洞濃度的關係圖。
0.00 0.04 0.08 0.12 0.16 0.20 0.24 0.0 0.2 0.4 0.6 0.8 1.0 1.2 1.4 YBa2Cu3O7-δ Y 0.7Ca0.3Ba2Cu3O7-δ 1 (5 K ) (1 0 8 -1 m -1 ) Hole concentration p 0.00 0.04 0.08 0.12 0.16 0.20 0.24 0 10 20 30 40 50 60 ( m ) -2 [1 / (5 K )] 2 YBa2Cu3O7-δ Y 0.7Ca0.3Ba2Cu3O7-δ
圖 9. 在 5K 時的實部電導率
1(5 )
K
跟超流體密度
21
(5 )
K
分別對不
同的電洞濃度作圖。
0.00 0.04 0.08 0.12 0.16 0.20 0.24 0 20 40 60 80 100 120 140 T* E g2(0) T c T* Eg1(0) Hole concentration p T (K )圖 10. 熱活化能隙
E
g2(0)
,
* 2T
,
E
g1(0)
,
* 1T
跟 T
c對不同電洞濃度
的關係圖,其中
* 2T
跟
T
*1數值大小幾乎相同。
0.06 0.08 0.10 0.12 0.14 0.16 0.18 0.20 0.22 0 4 8 12 16 20 24 28 W 1 Superconducting gap(5K) Eg2(0) Eg1(0) Impurity band0 Hole concentration p E n e rg y s c a le (m e V )圖 11. 各種能量尺度
,
0E
g2(0)
,
E
g1(0)
,
,
0
W
and
對不同電
洞濃度
p 時的變化圖。
(二)
微波元件研製
一﹑微波元件
利用微小化的共振腔設計
以及交錯耦合型結構的帶通濾波
器(Fig.1)的架構,將中心頻率
為 1.8GHz 的帶通濾波器製造在
面積為 1×1 cm
2的鋁酸鑭(LaAlO
3)
基板上,已達到濾波器尺寸微小
化的目的,可降低成本。再配合
零度與非零度饋入裝置,來設計
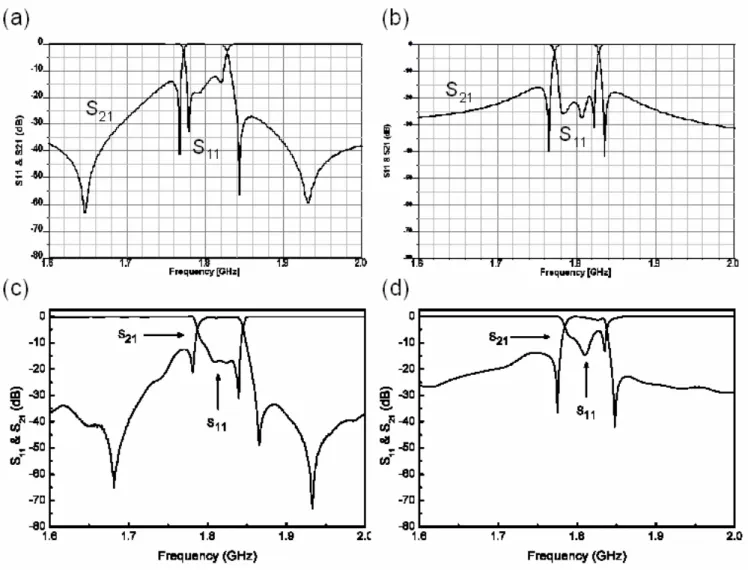
高溫超導濾波器,其量測的結果
(Fig.2)顯示,零度饋入式四階
微型之交錯耦合型帶通濾波器的
中心頻率在 1.816 GHz、比例頻寬為 3 %、通帶的插入損耗為 0.25 dB;非零度饋
入式微型之交錯耦合型帶通濾波器的中心頻率在 1.811 GHz、比例頻寬為 2.8 %、
通帶的插入損耗為 0.3 dB,此量測的結果與電腦模擬的結果大致吻合,零度饋入
式的濾波器設計證明,在通帶插入損耗與截止帶的阻絕能力比非零度饋入式的濾
波器佳。未來在應用上,不但能滿足通帶插入損耗小及高選擇性的需求,更能減
少頻寬的浪費與雜訊的干擾。
但美中不足的是,元件在製備上仍有以下兩項問題:
(1) 薄膜良率不穩定:
脈衝雷射蒸鍍系統,雖然有許多優點,但樣品的良率卻不穩定,即使在相同的
鍍膜條件之下,鍍一大批樣品,每片薄膜的各項物理參數如表面平整度、薄膜平
均厚度及臨界溫度值等,仍有些許差異。主要的因素來自於,基板的加熱溫度不
均勻所致,因為基板與矽基板仍有空隙,導致基板加熱時,基板表面的溫度未能
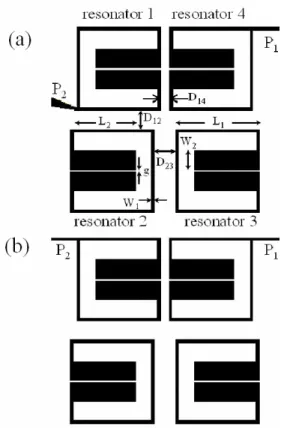
Fig. 1. Layout of the cross-coupled planar microwave filter with (a) symmetric (0with P1and P2) or (b) antisymmetric (180with P1and P2)
feed structure used in this study. Geometric parameters for each resonator: W1= 0.1 mm, W2= 0.7 mm, L1= 3.1mm, L2= 2.3 mm, g = 0.1mm, D12=
能導致濾波器元件的品質變差。
(2) 濕式微影蝕刻的問題:
本實驗是以濕式微影蝕刻的方式來製備高溫超導微波濾波器元件,用此方式蝕
刻的線寬大約只能達數個
μm,而我們濾波器的最小線寬是 100μm,就我們的濾波
器來講,微帶線邊緣的粗糙程度算是蠻大的。另外,濕式蝕刻的缺點,是還會造
成線邊側蝕的現象,且依側蝕的程度不同,影響的程度亦不同,這些都會影響元
件的效能表現。
二﹑未來展望
在製作高品質的濾波器,需要更穩定的製造方式,每個高溫超導薄膜的樣品,
Fig. 2. The simulations of S21 and S11 responses for (a) symmetric and (b) antisymmetric feed structure filter and the measured results for (c) symmetric and (d) antisymmetric, respectively.
(1) 改進薄膜良率穩定性:
採用基板背面黏銀膠的方式,以解決熱不均勻的問題,蒸鍍第一面薄膜的厚度
要鍍很厚,當作接地面用,對於元件的效能影響不大。在蒸鍍第二面的時候,第
一面薄膜直接上銀膠,而第一面薄膜夠厚在加熱時,銀膠也比較不容易貫穿第一
面薄膜,因此解決了加熱不均勻的問題後,相對薄膜的表面平整度與厚度均勻也
會改善,藉此以提升鍍膜的良率的穩定性。
(2) 改進蝕刻方式:
採用濕式蝕刻在先天上本來就有其限制,所以若是以此種方式來製作微波濾波
器,在我們所要求的線寬下,邊緣參差不齊是無可避免的。所以若是以更好的乾
式蝕刻技術來製作濾波器的話,例如:離子蝕刻(Ion Milling)或電子束微影蝕刻
(E-Beam Lithography)技術,這樣邊緣輻射的效應勢必可以減少。
最後,未來我們希望能使讓濾波器的尺寸更微小化以降低成本。最直接的方
法是,利用更密集化共振腔結構圖形的設計技術之外,或是使用介電常數較高的
基板,例如 TiO2 基板(
=105),可縮小濾波器中共振腔的長度,間接達到縮小整
r體元件的尺寸。利用以上兩個方法均可達到縮小濾波器尺寸的目的。
附錄一:
Dynamics of Film Growth of Perovskite-Type Materials by Laser Ablation from RHEED Observations
Y. S. Gou, J. Y. Lee, K. H. Wu and J. Y. Juang
Department of Electrophysics National Chiao Tung University, Hsinchu, Taiwan
Abstracts
Kinetic mechanism of thin film-growth using laser ablation from RHEED observations has been presented to examine the details of growing processes of STO thin films as temperature increasing smoothly. Using Langevin-like force-balanced equation for dislocation movements we can interpret the physical implications of the experimental observations. The model shows dislocation-mediated melting phenomena in two dimensions, and can be generalized to understand the growth mechanism of thin films of Perovskite-Type materials at their initial stage using laser ablation technique.
Introduction
RHEED intensity oscillations were first observed for GaAs(001) homoepitaxy grown by molecular beam epitaxy (MBE) and were interpreted as a manifestation of a two-dimensional (2D) layer-by-layer growth [1-2]. During the past decades, RHEED has become a powerful technique for monitoring the epitaxial growth of pulsed laser deposited (PLD) perovskite-oxide thin films [3].
For explaining the RHEED intensity oscillations during film growth related to its growth mechanism, we have present a model that step edges dominate the scattering of the electron beam [3]. The intimate correspondences between the RHEED intensity oscillations and the variations of step edge density in an evolving growth surface have already been successfully justified the above relations in the deposition of STO thin films using PLD technique [3, 4].
In this report, a continuous annealing scheme by increasing temperature instead of fixed temperature annealing was studied in order to investigate the initial-stage growth mechanism of homoepitaxial STO films. It is anticipated that the current study will provide an exact knowledge of the growth mechanism of perovskite thin films using laser ablation technique with various annealing schemes at somewhat proper temperature. Based on the characteristic features observed in the experiment, which show a great consistency with the prediction by the dislocation-mediated melting in two dimensions [5, 6], a model of growth kinetics related to the Brownian movements of the dislocation in the system will be proposed in terms of Langevin-like force-balanced equation. The physical implications of the essential effects relevant to the model construction will be discussed. Especially, the significance of the damping force, elastic force and thermal creep force of the dislocation in the system during growth will be indicated.
Experiment
The detailed experimental processes can be seen in our previous work [7]. In what follows only some important facts related to the model construction are mentioned. A KrF excimer laser with pulse
at ambient temperature with an oxygen partial pressure of 5×10⁻⁴Torr. Each film contains presumably the same amount of deposited material delivered by 500 laser pulses with which the growing film can maintain the state of low-supersaturation. The films were then subjected to in-situ continuous annealing at different heating rates by adjusting the current applied to the heating resistive block. The heating rate used in the present study ranges from 20℃/min to 35℃/min.
During the whole process, the intensity of the RHEED specular beam was closely monitored following the setups described in detail previously [7]. Briefly, a 20 keV electron beam was directed along the [100] direction of STO substrate with a grazing angle of 0.7.With a de Broglie wavelength of about 0.86 Å, the grazing electron beam is slightly off-Bragg conditions and the RHEED intensity is expected to be most sensitive to the step edges on the surface [1].
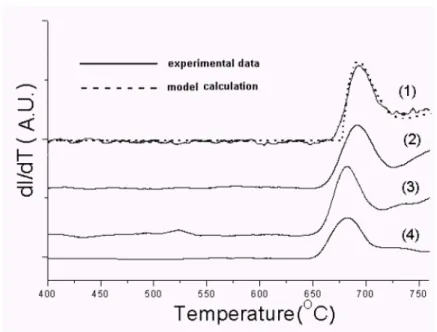
Figure 1(a) shows the RHEED intensity as a function of the elapsed time for the four different continuous annealing schemes. Curves (1) to (3) are the results of RHEED intensity evolution obtained by heating the films with fixed temperature increasing rate. The heating rates were 35℃/min, 25℃/min, and 20℃/min, respectively. On the other hand, curve (4) obtained heating the film at 25℃/min before it reached 400℃. The sample was kept at 400℃for about 60 seconds and then followed by a rate of 15℃/min toward the end of the process. Asis evident from the results, all the four annealing schemes display qualitatively the same manner. The precipitous drop of RHEED intensity at the commencement of deposition is indicative of sudden increase in step-edges density on the growing surface [4]. While the retention of very low intensity (the diffraction spots almost faded out) without any noticeable oscillating behavior implies that there is essentially no island coalescence until certain threshold temperature. This is better visualized by re-scaling the time axis with temperature. As shown in Fig. 1(b), with such re-scaling, all the four curves exhibit essentially the same behavior.
In all cases, when temperature approaches 660℃, there are two distinct phases observed. Namely, the steep rise of RHEED intensity is manifested by sudden appearances of the diffraction spots and the phenomena seem to be independent of heating rate. Within the context of the step edge model [3], the current results suggest a drastic change in film surface morphology occurred at 660℃.
For the kinetic approach, the differential properties of RHEED intensity, dI/dT, are derived from the above curves, as shown in Fig. 2. It can be observed that the curves for dI/dT are unchanged before 660oC, then there is a resonance-like peak occurred, where the maximum is located at temperature, around 690oC. After 720oC, the behaviors of dI/dT are either rising steadily or maintaining constant.
Discussion
In the light of statistical physics scenario, we have to ask a question about what kind of active object plays a role of independent Brownian particle in the growing system. In fact we will take dislocation “astheobjectoftheBrownian particle”.Thereasonsaregiven asfollows;First,nearly all crystals in nature grown at low supersaturation, which is mentioned previously as the state in our experiment, will contain dislocations, as otherwise they could not have grown [8]. Second, the
thermal-activated motion of dislocations as temperature increasing in our work. The model based on the dislocation of Brownian-movements, which is closely analogous to superconducting flux-creep in individual pinning problem [9], will be formulated. Based on the experimental observations and the model assumptions, we get the following physical scenario. On the one hand, when the temperature below 660oC the state of the system is in the solid phase, which can also be described as the pinning static state of the dislocations. On the other hand, when the temperature higher than TKT, which is defined
as Kosterlitz-Thouless temperature, the solid is melting, Langevin-like force balance equation will be applied to get the dynamic evolution of the system in thermal equilibrium.
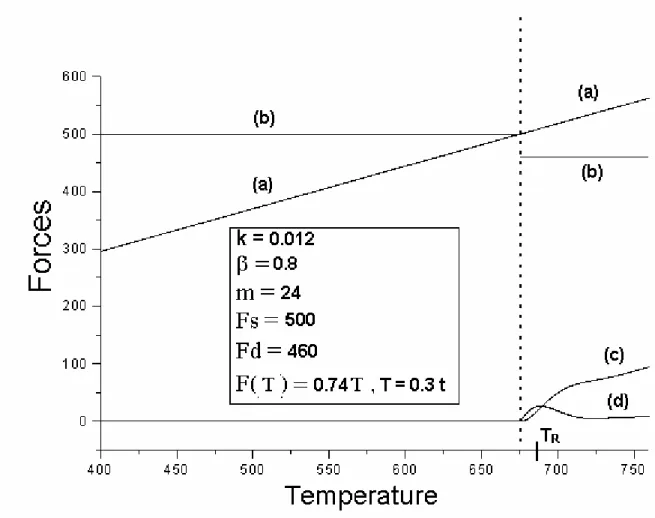
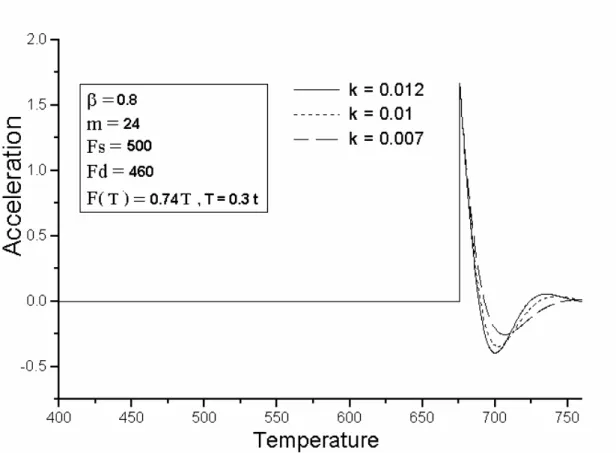
Here, we will depict the salient features of forces acted on the dislocation within crystal in a small island. First, the thermal creeping force, F(T), of the dislocation resulted from the increasing temperature is assumed to be analogous to the flux-creep theory in superconducting problems as suggested by Anderson and Kim [9]. Moreover, F(T) can be replaced by F(t) because of the constant temperature rising rate. Second, an elastic force, which is due to plastic deformation with the existence of thedislocation within thecrystal,isassumed to obey theHook’slaw.Thedensity ofthedislocationsisso dilute that the pinning can be visualized as an individual one and each dislocation is assumed to be independent. In this situation, the elastic constant will be taken as constant and independent of temperature.And last,theviscousity force,βυ,isassumed in theirreversibleprocess.
In the pinning static state, when F(t) < Fp, where Fpis the threshold pinning force of the
dislocation pinning, the system is static. When F(t) > Fp,the thermal force exceeds the pinning force as T
> TKT, where TKT is the K-T transition temperature from solid to fluid phase in two-dimensional
problems [5]. Then the Langevin force-balanced equation can be utilized to describe the dynamic evolution of the dislocation in the latter case.
md²r/dt²=- βυ - k r + γt - Fd (1)
where r is the ensemble average displacement of the dislocation,υ isthevelocity,m is an effective mass ofadislocation,β isthedamping coefficient,k istheelasticconstant,γisaconstantand γt - Fd is described as the external force originated from the thermal creep effect of the dislocation and Fdis the temperature independent dynamic frictional force arising from the atomic roughness surface. Finally, the inertial term is arisen from the condition that temperature rising time is much faster than any characteristic times of the forces acted on the dislocation in the equation (1), which will be justified in our model below.
The dotted line shown in curve (1) of Fig. 3 is the preliminary fit to the experimental data using Eq.(1)with β=0.8,m=24,k=0.007,γ=0.3,Fd=460, and threshold pinning force of Fs=500. Note that the relaxation timedueto theviscousity m/β isabout30 sec,and theelasticrelaxation timeisabout280 sec, the relaxation due to the creeping is about 80 sec. All these characteristic times are much larger than the dt (~3.0 sec) in equation (1). Except for small deviation with curve (1) due to the rounding before the onset of dislocation motion, the curve is in satisfactory agreement with the experimental curves shown in Fig. 3. Whatsoever, it is indicative that, in the dynamical regime of STO homoepitaxy, the damping and
When the annealing temperature T begins to increase from the room temperature, the thermal activated force to push the Brownian-like dislocation in the direction along the pressure gradient decreasing will become larger and larger and is possibly to pull the dislocation away from the initial fixed position with the thermal activation. Here the center-of-mass displacement “r” of the dislocation is assumed proportional to 1/L where L is the step edge length per unit area. As can be seen, if the step edge length becomes shorter due to the effect of island growth, the dislocation will move a corresponding longer distance. It means that the inverse of the length of step edge, 1/L, is analogous to the displacement of the dislocation. Therefore, the larger displacement of the dislocation will have the higher step-edge density and thus the higher probability of the attachment of the mobile adatom to island edge or/and vacancy in the front of growing surface to make the coalescence effect.
Moreover, there are some interesting behaviors of such Brownian motion are worthy discussing. The relations between the force acted on the Brownian-like dislocation and temperature are shown in Fig.4. In the figure, it shows that although the thermal-activation force and pinning force are much larger compared to the elastic force and damping force, but the small elastic and damping force dominate the microstructure in the system of thin film.Itclearly predictssuch smallvaluesofk and β to determine the thin film growth models. And the relations between thedislocation’sacceleration and temperature are also shown in Fig 5. It shows that the larger elastic constant will cause the faster variation of deceleration. In Figs. 4 and 5, another feature is worthy nothing that the elastic and damping force are competed with each other during redistribution of surface coverage. At the melting stage, dislocations begin moving and the damping force is dominated, but elastic force gradually become important while the displacement of the Brownian-like dislocation is large enough toward the high temperature end. When the elastic force is equal to the damping force, we found that dI/dT reaches the maximum at TR.
In summary, the kinetics of surface morphology evolution of pulsed laser deposited STO films were investigated by monitoring the RHEED intensity variations during the continuous temperature-increasing annealing scheme. An abrupt increase of the RHEED intensity was observed around 660℃, which corresponds to the K-T transition temperature in each annealing process. Moreover, within the context of step -edge model all the results were interpreted how to decrease surface step-edge density induced by Brownian-like dislocation dynamics in thermal equilibrium with various temperature ranges. By analogizing the temperature derivative of the RHEED intensity to the effective velocity of Brownian-like dislocation movements, the experimental results are satisfactorily described by a Langevin-type force-balanced equation, which stems from the idea of the flux-creep theory in the superconductivity. Finally, the present results provide a definite way of identifying an optimum temperature range for controlling the epitaxial growth kinetics and hence of the resultant epitaxial films for various Perovskite-Type materials using PLD technique.
REFERENCES
1. J. H. Neave, B. A. Joyce, P. J. Dobson, and N. Norton, Appl. Phys. A 31, 1 (1983). 2. J. M. Van Hove, C. S. Lent, and P. I. Cohen, J. Vac. Sci. Technol. B 1, 741 (1983). 3. J. Y. Lee, J. Y. Juang, K. H. Wu, T. M. Uen, and Y. S. Gou, Surf. Sci. 449, L235 (2000).
4. T. C. Wang, J. Y. Juang, K. H. Wu, T. M. Uen, and Y. S. Gou, Japanese Journal of Applied Physics 43, 771 (2004).
5. D. R. Nelson and B. I. Halperin, Phys. Rev. B 21, 5312 (1980). 6. J. M. Kosterlitz and D. J. Thouless, J. Phys. C6, 1181 (1973).
7. J. Y. Lee, Phd dissernation, Institute of Electrophysics, National Chiao-Tung University (2001). 8. C. Kittel, Introduction to Solid State Physics (John Wiley? Sons, Inc., Singapore, 1986).
9. P. W. Anderson, Phys. Rev. Lett. 9, 309 (1962); P. W. Anderson and Y. B. Kim, Rev. Mod. Phys. 36, 39 (1964).
Figure Captions
Figure 1: (a) The RHEED intensity as a function of time with heating rate of (1) 35℃/min (2) 25℃/min, (3) 20℃/min, and (4) 25℃/min for T<400℃and 15℃/min for T>400℃. (b) Same as (a), except that the x-axis has been rescaled to temperature.
Figure 2: The temperature derivative of the RHEED intensity curves shown in Fig. 1(b). The dotted curve is the fit to the model discussed in the text.
Figure 4: The origin of the forces in the model, which uses the same parameters setting of curve (3) in figure 3. The temperature of the resonance-like is denoted as TR.(a) Thermal-activation force (b) Pinning
force (c) Elastic force (d) Damping force.
Fig. 5: The model calculation which shows the relation between the dislocation’s acceleration and temperature.