A Two-Dimensional Expectation-Perception Analysis
for RFID Benefits in Supply Chain Management
Pao-Tiao ChuangDepartment of Asia-Pacific Industrial and Business Management, National University of Kaohsiung
Kaohsiung City, Taiwan. e-mail address: ptchuang@nuk.edu.tw)
J. Wesley Barnes
Graduate Program in Operations Research and Industrial Engineering, The University of Texas- Austin
Austin, Texas, U.S.A. e-mail: wbarnes@mail.utexas.edu Abstract--This paper explores two important themes in the
implementation of RFID in supply chain management: (1) analyzing differences between actual (perceived) and potential (expected) key benefits to see if there are benefit shortfalls for the key performances; and (2) performing a two-dimensional expectation-perception analysis (EPA) for the purpose of identifying competitive niche and strategically allocating and adjusting the company’s resources. Empirical data were collected through surveys of executives of selected Taiwan based companies who had experienced RFID adoption in the supply chain practices. Finally, managerial implications and suggestions were provided for companies and industries that may be considering the adoption of RFID in SCM.
Keywords: Radio Frequency Identification (RFID); Supply Chain Management (SCM); Two-Dimensional Expectation-Perception Analysis (EPA).
I. INTRODUCTION
To achieve a more responsive control system for supply chain management (SCM), a technology that allows greater speed, efficiency, precision and real-time information sharing is required. Such a technology should be able to achieve the following important capabilities: fulfillment of customized-orders, accomplishing commitments to customers, on-time delivery, quick responses to customer requirements and preferences, increased adaptability and faster response to external changes.
In this context, Radio Frequency Identification (RFID) could be an enabling technology to enhance a more responsive control system for a supply chain. RFID technology, a wireless sensor technology based on the detection of electromagnetic signals (Domdouzis et al., 2007), is the most advanced technology to substitute for the bar-code technology intrinsic to the Electronic Product Code (EPC) network system (Chen et al., 2007). It is used for a wide variety of applications ranging from the familiar building access control proximity cards to supply chain tracking, toll collection, vehicle parking access control, retail stock/inventory management and tracking, ski lift access, tracking library books, theft prevention, vehicle immobilizer systems, railway rolling stock identification and movement tracking, as well as patient identification and safety, and hospital information sharing in healthcare industry (e.g., Chao et al., 2007; Kärkkäinen,2003; Kärkkäinen and Holmström, 2002; Ngai et al., 2007; O’Connor, 2008; Qiu, 2007;
Rekik et al., 2008; Sellitto et al., 2007; Tzeng et al., 2008). RFID offers many benefits in SCM, including shrinkage reduction, material handling efficiency, increased product availability, and improved asset management (Angeles, 2005; Lee et al., 2008; Li and Visich, 2006; Tajima, 2007). Therefore, RFID should allow a supply chain to establish a more responsive mechanism by enhancing its speed, efficiency, precision, and real-time information sharing.
Though literature have addressed that RFID could be beneficial to SCM in some key performance measures, others were skeptical that the potential benefits of an ideal RFID usage in SCM might be different from the benefits actually observed. These before RFID and after RFID differences are likely due to incomplete technical, application, and managerial practices when RFID is implemented in SCM. Therefore, it would be of interest to determine the perceived (actual) or expected (potential) extent of each RFID benefit.
This paper explores two important themes in the implementation of RFID in supply chain management: (1) analyzing differences between actual (perceived) and potential (expected) key benefits to see if there are benefit shortfalls for the key performances; and (2) performing a two-dimensional expectation-perception analysis (EPA) for the purpose of identifying competitive niche and strategically allocating and adjusting the company’s resources.
II. POTENTIAL KEY BENEFITS OF RFID ADOPTION IN SCM
The benefits of RFID in SCM involve two phases: benefits throughout the supply chain and benefits to individual tiers in the supply chain. In synthesizing related literature (Angeles,2005; Bottani and Rizzi, 2008; Chen et al. ,2007; Kok et al.,2008; Tajima, 2007; Visich et al., 2007 and Wang et al. 2008), we have identified and consider twelve potential RFID benefits for companies that implement RFID into their SCM. We also conducted preliminary interviews with three company executives, each of whom was from a different unique tier of the supply chain. These key potential RFID benefits are shown below.
(1) Reduced shrinkage and pilfering. (2) Reduced material handling. (3) Increased data accuracy. (4) Faster exception management.
(5) Increased information sharing.
(6) Improved production tracking and product trace. (7) Improved process quality control.
(8) Increased supply and production continuity. (9) Reduced labor costs.
(10) Increased space utilization.
(11) Increased real-time control of product purchase, sales, and inventory.
(12) Reduced stock-out loss and inventory costs. III. BENEFIT ANALYSIS FOR KEY
PERFORMANCES
To collect the required data for performing the benefit analysis, another survey questionnaire was used to investigate the degree of perception after the RFID had implemented and the degree of expectation before the adoption of RFID for each of the twelve key performance measures. In the questionnaire, a five-point rating scale from 1 (least benefit) to 5 (most benefit) was used to indicate the degrees of both perceived and expected benefits. The survey was conducted from August to September 2009. Eighty questionnaires were sent to the functional managers of selected Taiwan based companies who had experienced RFID adoption in the supply chain practices. Forty-six questionnaires were returned. In regard to completeness and consistency, 40 were deemed appropriate for benefit analysis.
A. Tests of Difference between Perceived and Expected Degrees of Benefit
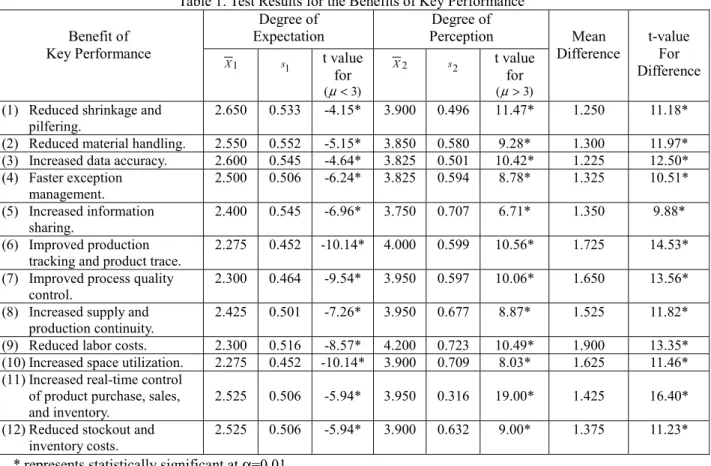
A paired t-test was performed to determine if a statistically significant difference existed between the actual benefits and the potential benefits. The right-most column of Table 1, show that at a significance level (α) of 0.01, all average levels of perception are significantly higher than the average levels of expectation, i.e., in all cases, the actual perceived results after RFID adoption exceeded expected results prior to the RFID adoption. This somewhat surprising result is counter to the somewhat negative views expressed by Ngai et al. (2008) and Tajima (2007). In addition, all degrees of perception are testified, as shown in the 7th column, higher than the ordinary level of “3”; while all degrees of expectation are testified, as shown in the 4th column,
below “3”. The higher perceptions indicate that the RFID technology is quite advantageous to SCM practices and the lower expectations imply that many companies may be unaware of the virtues of RFID leading them to use less capable technologies.
B. Two-Dimensional EPA
The previous sub-section details statistically significant differences between expectation and perception for all the twelve key performance measures, it also shows that each key performance measure may have different degrees of expectation and perception. Further analysis should unveil strategic and managerial implications to the company that has adopted the RFID
in the SCM, i.e., when the relative degree of perception is compared with the relative degree of expectation for each of the key performance measures, it would be helpful for the company to identify its competitive niches as well as to appropriately allocate and adjust its corporate resources.
This paper applied a two-dimensional expectation-perception analysis (EPA) to identify competitive niches and assist in strategically allocating and adjusting the company’s resources when a company implements RFID in its SCM practices. The concept behind this approach is to identify how the perception of each benefit matches its expectation by diagramming their relative positions in the coordinate plane.
Since the five-point rating scales, from 1 (least benefit) to 5 (most benefit), are used for all 12 key performance measures, it means they are all assessed on the same measurement scale but each of which may have both different means and standard deviations. To differentiate which benefits are relatively higher or lower, the grand average degree of these 12 key metrics can be used as the base reference value. Thus, to perform the EPA, a standardization process that computes the relative z-scores, shown as Eqs. (1) and (2), for the average degree of expectation and the average degree of perception for each of the benefits need to be calculated first. The results of the z-scores are shown in Table 2.
= 1 i z n i X i X i x X i X 1 1 1 1 1 1 σ σ− = − (1) = 2 i z n i X i X i x X i X 2 2 2 2 2 2 σ σ − = − (2) where, 1 i
z
= The z-score of the average degree of expectation for the ith benefit of key performance, i=1, 2,…12.2 i
z
= The z-score of the average degree of perception for the ith benefit of key performance. i=1, 2,…12.1 i
X
= The average degree of expectation for the ith benefit of key performance. i=1, 2,…12.2 i
X
= The average degree of perception for the ith benefit of key performance. i=1, 2,…12.1
X
= The grand average degree of expectation for all 12 benefits.2
X
= The grand average degree of perception for all 12 benefits.1
i x
σ
= The standard error of the average degree of expectation for the ith benefit of key performance.1 i
σ
= The standard deviation of the degree of expectation for the ith benefit of key performance. The sample standard deviations
i1 is used toreplace
σ
i1 whenσ
i1 is unknown.2
i x
σ
= The standard error of the average degree of perception for the ith benefit of key performance.2 i
σ
= The standard deviation of the degree of perception for the ith benefit of key performance. Thesample standard deviation
s
i2 is used to replaceσ
i2 whenσ
i2 is unknown.Table 1. Test Results for the Benefits of Key Performance Benefit of
Key Performance
Degree of
Expectation Perception Degree of Mean Difference t-value For Difference 1 X s1 t value for ) 3 (μ< 2 X s2 t value for ) 3 (μ>
(1) Reduced shrinkage and pilfering.
2.650 0.533 -4.15* 3.900 0.496 11.47* 1.250 11.18*
(2) Reduced material handling. 2.550 0.552 -5.15* 3.850 0.580 9.28* 1.300 11.97* (3) Increased data accuracy. 2.600 0.545 -4.64* 3.825 0.501 10.42* 1.225 12.50* (4) Faster exception management. 2.500 0.506 -6.24* 3.825 0.594 8.78* 1.325 10.51* (5) Increased information sharing. 2.400 0.545 -6.96* 3.750 0.707 6.71* 1.350 9.88* (6) Improved production
tracking and product trace. 2.275 0.452 -10.14* 4.000 0.599 10.56* 1.725 14.53* (7) Improved process quality
control. 2.300 0.464 -9.54* 3.950 0.597 10.06* 1.650 13.56*
(8) Increased supply and production continuity.
2.425 0.501 -7.26* 3.950 0.677 8.87* 1.525 11.82*
(9) Reduced labor costs. 2.300 0.516 -8.57* 4.200 0.723 10.49* 1.900 13.35* (10) Increased space utilization. 2.275 0.452 -10.14* 3.900 0.709 8.03* 1.625 11.46* (11) Increased real-time control
of product purchase, sales, and inventory.
2.525 0.506 -5.94* 3.950 0.316 19.00* 1.425 16.40*
(12) Reduced stockout and
inventory costs. 2.525 0.506 -5.94* 3.900 0.632 9.00* 1.375 11.23* * represents statistically significant at α=0.01.
Table 2. z-Scores for the Gap Analysis
Benefit of Key Performance
Degree of Expectation Degree of Perception
1 i X
s
i1 = 1 i z n i s X i X 1 1 1− = Xi2s
i2 zi2 = n i s X i X 2 2 2−(1) Reduced shrinkage and pilfering. 2.650 0.533 2.444 3.900 0.496 -0.213 (2) Reduced material handling. 2.550 0.552 1.216 3.850 0.580 -0.728 (3) Increased data accuracy. 2.600 0.545 1.811 3.825 0.501 -1.158 (4) Faster exception management. 2.500 0.506 0.702 3.825 0.594 -0.976 (5) Increased information sharing. 2.400 0.545 -0.508 3.750 0.707 -1.491 (6) Improved production tracking and
product trace.
2.275 0.452
-2.361 4.000 0.599 0.879 (7) Improved process quality control. 2.300 0.464 -1.960 3.950 0.597 0.353 (8) Increased supply and production
continuity.
2.425 0.501
-0.238 3.950 0.677 0.311
(9) Reduced labor costs. 2.300 0.516 -1.761 4.200 0.723 2.477
(10)Increased space utilization. 2.275 0.452 -2.361 3.900 0.709 -0.149 (11)Increased real-time control of product
purchase, sales, and inventory
2.525 0.506
1.015 3.950 0.316 0.667 (12)Reduced stockout and inventory costs. 2.525 0.506 1.015 3.900 0.632 -0.167
1
Furthermore, each pair of the
z
i1 andz
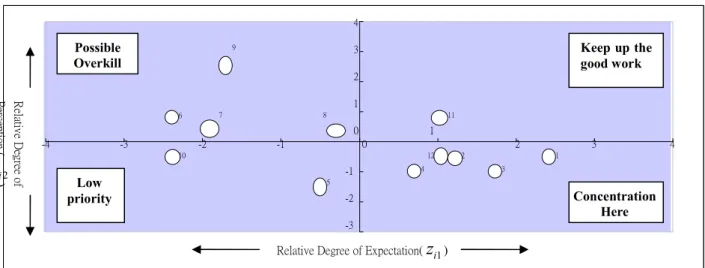
i2 scores, which denote the relative degree of expectation and the relative degree of perception, are plotted as a point in the two-dimensional diagram. The results of the twelve points for the EPA are shown in Figure 1.From the two-dimensional diagram, only the 11th benefit of key performance falls in the first quadrant. It means that the 11th benefit of key performance has higher relative degree of perception to match its relative degree of expectation. It reveals that the benefit ”Increased real-time control of product purchase, sales, and inventory” is more effective and might be a niche key performance measure. Thus, the company should keep up the good work on this benefit.
Next, four benefits of key performance, 6th, 7th, 8th, and 9th, fall in the second quadrant of the diagram. It means that these four benefits of “Improved production tracking and product trace”, “Improved process quality control”, “Increased supply and production continuity” as well as “Reduced labor costs” have higher relative degree of perception compare to its lower relative degree of expectation. It exposes that the RFID adoption companies allocate too much resources to get the higher perceptions for these benefits that are relatively lower expected. That is, the company may possibly overkill on
these benefits.
Thirdly, two benefits of key performance, 5th and 10th, fall in the third quadrant of the coordinate. It means that the benefits of “Increased information sharing” and “Increased space utilization” have lower relative degrees of perception corresponding to their lower relative degrees of expectation, respectively. That is, the priority of adjusting the corporate resource on these benefits should be lower to allow the company puts more focuses on either the niche benefit or those benefits that need more concentration.
Finally, five benefits of key performance, 1st, 2nd, 3rd, 4th, and 12th, fall in the fourth quadrant of the two-dimensional diagram. It means that these five benefits of “Reduced shrinkage and pilfering”, “Reduced material handling”, “Increased data accuracy”, “Faster exception management” as well as “Reduced stockout and inventory costs” have lower relative degrees of perception compared to their higher relative degrees of expectation. It exposes that the RFID adoption companies allocate too little resources for those benefits of key performance that possess relatively higher expectations. Thus, the company should put more concentration on improving the perception of these benefits.
Figure 1. Two-Dimensional Expectation-Perception Analysis (EPA)
IV. IMPLICATIONS AND SUGGESTIONS The performed t-tests show that all the twelve benefits of key performance can really be achieved for a company that implements the RFID in the supply chain practices. The results indicate that the RFID technology is really advantageous to the SCM practices and that many companies are still unaware of the virtues of RFID for the SCM. Therefore, RFID manufacturers, RFID stakeholders, and RFID advocates should increase their promotion efforts in education about this evolving technology and its actual benefits for business key performance.
Furthermore, a two-dimensional EPA that identifies how the relative perception of each benefit matched with its relative expectation provides more strategic and managerial implications for competitive niches and resources allocation for those companies that consider the RFID adoption in SCM. The main results and implications are elaborated below.
(1) ”Increased real-time control of product purchase, sales, and inventory” is more effective and a niche key performance measure since its relative higher perception matches its relative higher expectation.
1 2 3 4 5 6 7 8 9 10 11 12 -3 -2 -1 0 1 2 3 4 -4 -3 -2 -1 0 1 2 3 4 Keep up the good work Possible Overkill
Relative Degree of Expectation(
z
i1)Concentration Here Low priority R ela ti ve D eg re e o f P er ce pti on ( 2 i
z
)Therefore, for those companies that intend to implement RFID in SCM should continue allocating resources on this measure to sustain its higher perception.
(2) RFID adoption companies allocate too many resources on “Improved production tracking and product trace”, “Improved process quality control”, “Increased supply and production continuity” and “Reduced labor costs”. Thus, those companies should switch some of the resources currently allocated on these measures to other measures that need more concentrations.
(3) Companies allocate too few resources on “Reduced shrinkage and pilfering”, “Reduced material handling”, “Increased data accuracy”, “Faster exception management” and “Reduced stockout and inventory costs”. That is, these measures need more concentrations. Therefore, companies should allocate more resources to further increase substantial perceptions of these measures.
(4) Finally, the RFID adoption companies can leave unchanged resources allocated to “Increased information sharing” and “Increased space utilization” since their lower perceptions just correspond to their lower expectations for current industry needs.
V. CONCLUDING REMARKS
RFID with its features and functions appears to be a good and suitable technology for a supply chain to increase the abilities of speed, efficiency, precision, and real-time information sharing. The actual benefits of RFID to a company depends largely upon recognizing and overcoming the issues and challenges that may be encountered when adopting RFID as well as appropriately allocating and prioritizing corporate resources.
To disclose these phenomena, this research has revealed two important themes that a company needs to contemplate when implementing the RFID in SCM process. They involved empirically analyzing differences between actual (perceived) and potential (expected) key benefits by a paired t-test to determine if there are benefit shortfalls for the key performances as well as performing a two-dimensional EPA for the purpose of identifying competitive niche and strategically allocating and adjusting the company’s resources. Managerial implications and suggestions are provided for companies and industries that may be considering the adoption of RFID in SCM.
ACKNOWLEDGEMENTS
The authors gratefully acknowledge the National Science Council of Taiwan for sponsoring this research under the grants of (NSC 98-2918-I-390-004) and (NSC 98-2221-E-390 -005 -MY2).
REFERENCES
[1] Angeles, R., “RFID technologies: Supply-chain applications and implementation issues”,
Information Systems Management, Vol.22, No.1,
pp.51-65, 2005.
[2] Bottani, E. and Rizzi, A., “Economical assessment of the impact of RFID technology and EPC system on the fasting-moving consumer goods supply chain”, International Journal of Production
Economics, Vol.112, No.2, pp.548-569, 2008.
[3] Chao, C.C., Yang, J.M., and Jen, W.Y., “Determining technology trends and forecasts of RFID by a historical review and Bibliometric analysis from 1991 to 2005”, Technovation, Vol.27, pp.268-279, 2007.
[4] Chen, J.L., Chen, M.C., Chen, C.W., and Chang, Y.C., “Architecture design and performance evaluation of RFID object tracking systems”,
Computer Communications, Vol.30, pp.2070-2086,
2007.
[5] Domdouzis, K., Kumar, B., and Anumba, C., “Radio-frequency identification (RFID) applications: A brief introduction”, Advanced Engineering
Informatics, Vol.21, No.4, pp.350-355, 2007.
[6] Kärkkäinen, M., “Increasing efficiency in the supply chain for short shelf life goods using RFID tagging”,
International Journal of Retail and Distribution Management, Vol.31, No.10, pp.529-536, 2003.
[7] Kärkkäinen, M. and Holmström, J., “Wireless product identification: Enabler for handling efficiency, customization and information sharing”,
Supply Chain Management: An International Journal, Vol.7, No.4, pp.242-252, 2002.
[8] Kok, A.G. de, Donselaar, K.H. van, and Woensel, T. van, “A break-even analysis of RFID technology for inventory sensitive to shrinkage”, International
Journal of Production Economics, Vol.112,
pp.521-531, 2008.
[9] Lee, L.S., Fiedler, K.D., and Smith, J.S., “Radio frequency identification (RFID) implementation in the service sector: A customer-facing diffusion model”, International Journal of Production
Economics, Vol.112, No.2, pp.587-600, 2008.
[10]Li, S. and Visich, J.K., “Radio frequency identification: Supply chain impact and implementation challenges”, International Journal
of Integrated Supply Management, Vol.2, No.4,
pp.407-424, 2006.
[11]Ngai, E.W.T., Cheng, T.C.E., Au, S., and Lai, K.H., “Mobile commerce integrated with RFID technology in a container depot”, Decision Support
Systems, Vol.43, pp.62-76, 2007.
[12]Ngai, E.W.T., Moon, K.K.L., Riggins, F.J., and Yi, C.Y., “RFID research: An academic literature review (1995-2005) and future research directions”,
International Journal of Production Economics,
Vol.112, pp.510-520, 2008.
[13]O’Connor, M. C., “Industry groups study RFID at the supply chain’s end”, RFID Journal,
http://www.rfidjournal.com/article/articleprint/4080/
-1/1/, 2008.
[14]Qiu, R.G., “RFID-enabled automation in support of factory integration”, Robotics and
Computer-Integrated Manufacturing,” Vol.23,
pp.677-683, 2007.
[15]Rekik, Y., Sahin, E., and Dallery, Y., “Analysis of the impact of the RFID technology on reducing product misplacement errors at retail stores”,
International Journal of Production Economics,
Vol.112, pp.264-278, 2008.
[16]Sellitto, C., Burgess, S., and Hawking, P., “Information quality attributes associated with RFID-derived benefits in the retail supply chain”,
International Journal of Retail and Distribution Management, Vol.35, No.1, pp.69-87, 2007.
[17]Tajima, M., “Strategic value of RFID in supply
chain management”, Journal of Purchasing &
Supply Management, Vol.13, pp.261-273, 2007.
[18]Tzeng, S.F., Chen, W.H., and Pai, F.Y., “Evaluating the business value of RFID: evidence from five case studies”, International Journal of Production
Economics, Vol.112, pp.601-613, 2008.
[19]Visich, J.K., Li, S., and Khumawala, B.M., “Enhancing product recovery value in closed-loop supply chains with RFID”, Journal of Managerial
Issues, Vol.19, No.3, pp.436-452, 2007.
[20]Wang, S.J., Liu, S.F., and Wang, W.L., “The simulated impact of RFID-enabled supply chain on pull-based inventory replenishment in TFT-LCD industry”, International Journal of Production