Comparative Study of CO
2Capture by Carbon Nanotubes,
Activated Carbons, and Zeolites
Chungsying Lu,*
,†Hsunling Bai,
‡Bilen Wu,
†Fengsheng Su,
†and Jyh Feng Hwang
§ Department of EnVironmental Engineering, National Chung Hsing UniVersity, Taichung 402, Taiwan, Institute of EnVironmental Engineering, National Chiao Tung UniVersity, Hsinchu 300, Taiwan, and FuelUtilization Laboratory, Industrial Energy ConserVation Technology DiVision, Energy and EnVironment research Laboratories, Industrial Technology Research Institute, Hsinchu 310, Taiwan
ReceiVed January 6, 2008. ReVised Manuscript ReceiVed May 19, 2008
Carbon nanotubes (CNTs), granular activated carbon (GAC), and zeolites were modified by 3-aminopropyl-triethoxysilane (APTS) and were selected as adsorbents to study their physicochemical properties and adsorption behaviors of CO2from gas streams. The surface nature of these adsorbents was changed after the modification, which make them adsorb more CO2gases. Under the same conditions, the modified CNTs possess the greatest adsorption capacity of CO2, followed by the modified zeolites and then the modified GAC. The mechanism of CO2adsorption on these adsorbents appears mainly attributable to physical force, which makes regeneration of spent adsorbents at a relatively low temperature become feasible. The APTS-modified CNTs show good performance of CO2adsorption as compared to many types of modified carbon and silica adsorbents reported in the literature. This suggests that the APTS-modified CNTs are efficient CO2adsorbents and that they possess potential applications for CO2capture from gas streams.
Introduction
The CO2 capture and storage (CCS) technologies from combustion gases are concerning after the Kyoto Protocol came into force on February 16, 2005. Various CO2capture technolo-gies, including absorption, adsorption, cryogenics, membranes, and so forth, have been investigated.1,2 Among them, the absorption-regeneration technology has been recognized as the most matured process so far, with the amine-based or ammonia-based absorption processes receiving the greatest attention.3–5 However, because the energy penalty of the absorption process is still too high, other technologies are being investigated throughout the world. The Intergovernmental Panel on Climate Change (IPCC) special report concluded that the design of a full-scale adsorption process might be feasible and the develop-ment of a new generation of materials that would efficiently adsorb CO2will undoubtedly enhance the competitiveness of adsorptive separation in a flue gas application.6 Possible adsorbents include activated carbon,7,8 zeolites,9,10 silica adsorbents,11,12single-walled carbon nanotubes (SWCNTs),13
and a nanoporous silica-based molecular basket.14,15However, a systematic comparison on the CO2 capture with these adsorbents is still very limited in the literature.
This article investigates the physicochemical properties of raw and 3-aminopropyl-triethoxysilane (H2NCH2CH2CH2 -Si(OCH2CH3)3, abbreviated as APTS) modified carbon nano-tubes (CNTs), granular activated carbon (GAC), and zeolites. A comparative study on the adsorption behavior of CO2from gas streams with these adsorbents is also given.
Experimental Section
1. Adsorbents. Commercially available multiwalled CNTs with inner diameter < 10 nm (L-type, Nanotech Port Co., Shenzhen, China), zeolites with unit cell size of 24.7 Å (CBV100, Zeolyst International, Valley Forge, U.S.A.), and GAC with particle diameter range of 0.55-0.75 mm (Filtrasorb 400, Calgon Carbon Co., Tianjia, China) were selected as adsorbents in this study. The length of CNTs was in the range of 5-15µm, and the amorphous
carbon content in CNTs was <5 wt %. The SiO2/Al2O3mole ratio of zeolites was 5.1. These data were provided by the manufacturer. Raw adsorbents were thermally pretreated in a furnace at 300
°C by passing N2gas for 60 min. After the thermal treatment, these
* To whom correspondence should be addressed. E-mail: [email protected]. Fax: +886-4-22862587.
†National Chung Hsing University. ‡National Chiao Tung University. §Industrial Technology Research Institute.
(1) White, C. M.; Strazisar, B. R.; Granite, E. J.; Hoffman, J. S.; Pennline, H. W. J. Air Waste Manage. Assoc. 2003, 53 (6), 645–715.
(2) Aaron, D.; Tsouris, C. Sep. Sci. Technol. 2005, 40 (1-3), 321–348. (3) Bai, H. L.; Yeh, A. C. Ind. Eng. Chem. Res. 1997, 36 (6), 2490– 2493.
(4) Yeh, A. C.; Bai, H. L. Sci. Total EnViron. 1999, 228 (2-3), 121– 133.
(5) Rao, A. B.; Rubin, E. S. EnViron. Sci. Technol. 2002, 36 (20), 4467– 4475.
(6) Intergovernmental Panel on Climate Change (IPCC). Special Report on Carbon dioxide Capture and Storage. http://www.ipcc.ch/activity/srccs/ index.htm (2005).
(7) Siriwardane, R. V.; Shen, M. S.; Fisher, E. P.; Losch, J. Energy
Fuels 2001, 15 (2), 279–284.
(8) Prezepio´rski, J.; Skrodzewicz, M.; Morawski, A. W. Appl. Surf. Sci.
2004, 225 (1-4), 235–242.
(9) Gao, W.; Butler, D.; Tomasko, D. L. Langmuir 2004, 20 (19), 8083– 8089.
(10) Siriwardane, R. V.; Shen, M. S.; Fisher, E. P.; Poston, J. A. Energy
Fuels 2005, 19 (3), 1153–1159.
(11) Gray, M. L.; Soong, Y.; Champagne, K. J.; Pennline, H.; Baltrus, J. P., Jr.; Khatri, R.; Chuang, S. S. C.; Filburn, T. Fuel Process. Technol.
2005, 86 (14-15), 1449–1455.
(12) Hiyoshi, N.; Yogo, K.; Yashima, T. Microporous Mesoporous
Mater. 2005, 84 (1-3), 357–365.
(13) Cinke, M.; Li, J., Jr.; Ricca, A.; Meyyappan, M. Chem. Phys. Lett.
2003, 376 (5-6), 761–766.
(14) Xu, X. C.; Song, C.; Andresen, J. M.; Miller, B. G.; Scaroni, A. W.
Energy Fuels 2002, 16 (6), 1463–1469.
(15) Xu, X. C.; Song, C. S.; Miller, B. G.; Scaroni, A. W. Ind. Eng.
Chem. Res. 2005, 44 (21), 8113–8119. 10.1021/ef8000086 CCC: $40.75 2008 American Chemical Society
adsorbents were dispersed into flasks containing various kinds of chemical agents (Riedel deHa¨en, Analytical Reagent, Seelze, Germany) including 30% monoethanolamine (MEA), 30% NH3(aq), and 10% APTS (90 mL of 99.8% purity toluene + 10 mL of 97% purity APTS) to determine the optimum modification method of employed adsorbents for enhancing CO2capture. Literature screen-ing indicates that these chemical agents show potential to modify carbon adsorbents8or silica adsorbents.11,12The mixture was then refluxed at the boil for 24 h. After cooling to room temperature, the mixture was filtered through a 0.45µm fiber filter, and the solid
was dehydrated in an oven at 105°C for 2 h and then was dried in a furnace at 110°C for 2 h by the passage of N2gas.
2. Adsorption Experiment. The experimental setup for CO2 adsorption is shown in Figure 1. The adsorption column was made of Pyrex glass, with a total length of 20 cm and an internal diameter of 1.5 cm. The column was filled with 1.0 g of adsorbents (packing height≈ 3.5 cm) and placed within a temperature control box (Model CH-502, Chin Hsin, Taipei, Taiwan) to maintain a constant temperature at 25°C. Compressed air was passed first through a silica gel air dryer to remove moisture and oil and then was passed through a HEPA filter (Gelman Science, Ann Arbor, MI, U.S.A.) to remove particulates. The clean air was then served as a diluting gas and was mixed with pure CO2gas obtained from a pure CO2cylinder (99.9% purity) before entering the absorption column. The influent CO2concentration and the system flow rate were controlled via mass flow controllers (model 247C four channel read-out and model 1179A for mass flow controller, MKS Instrument Inc., MA, U.S.A.). The mixed gas was then passed downward into the adsorption column. The influent and effluent gas streams were flowed into a gas chromatograph (GC) equipped with a thermal-conductivity detector (TCD) by an autosampling system. The influent CO2 concentration was in the range of 5-50%, which was selected to be representative of different CO2levels in combustion gases from many kinds of industrial activities, fossil fuel power plants, or coal gasification system. The variations in the influent CO2concentration were below 0.2%, and the system flow rate was controlled at 0.08 L/min which is equivalent to an empty-bed retention time of 4.6 s. The amount of CO2adsorbed on adsorbents (q, mg/g) at a certain time (t, min) was calculated as
q )1 m
∫
0t
Q(Cin- Ceff) dt (1) where m is the weight of virgin adsorbents (g); Q is the influent flow rate (L/min); and Cinand Ceff are the influent and effluent
CO2concentrations (mg/L), respectively.
3. Physisorption and Chemisorption. Most adsorption pro-cesses are a combination of physical force (physisorption) and chemical force (chemisorption). Physisorption occurs due to van der Waals forces between adsorbate molecules and adsorbents while chemisorption takes place due to chemical interactions between the adsorbate molecules and the surface functional groups of adsorbents. A distinction of these two processes is very useful in understanding the factors that influence the rate of adsorption process. The equilibrium amount of CO2adsorbed on adsorbents due to phys-isorption (qep, mg/g) and chemisorption (qec, mg/g) were estimated as follows.16As the adsorption reached equilibrium, the amount of CO2adsorbed on adsorbents (qe, mg/g) was measured, and then the influent gas was changed to N2gas and controlled at a Q of 0.1 L/min. The outlet of adsorption column was connected to a vacuum pump which was operated at 65 mm-Hg. Until the CO2level in effluent gas streams was undetectable, the remaining weight of spent adsorbents (m1, mg) was measured. The weight difference between
m1 and m is attributed to chemisorptions, and the qec can be estimated as
qec)m1- m
m ×1000 (2)
The qepis thus calculated from the difference between qeand qec. 4. Analytical Methods. CO2concentration was determined using a GC-TCD (model GC-2010, Shimadzu Instruments, Tokyo, Japan). A 30 m fused silica capillary column with 0.32 mm inner diameter and 5.0µm film thickness (AB-PLOT GasPro, U.S.A.) was used
for CO2analysis. The GC-TCD was operated at injection temper-ature of 50 °C, detector temperature of 100 °C, and oven temperature of 55°C.
The morphology of adsorbents was analyzed by a high-resolution transmission electron microscope (HR-TEM, model JEM-2010, JEOL, Tokyo, Japan). The structure information of adsorbents was evaluated by a Raman spectrometer (model Nanofinder 30 R., Tokyo Instruments Inc., Tokyo, Japan). The thermal stability of adsorbents in air was determined by a thermogravimetric analyzer (TGA, model TG209 F1 Iris, NETZSCH, Bavaria, Germany) at a heating rate of 10°C/min in the temperature range of 30-750°C. The physical properties of adsorbents were determined by N2 adsorption/desorption at 77 K using Micromertics ASAP 2010 surface area and porosimetry analyzer (Norcross, GA, U.S.A.). The N2 isotherms were measured at a relative pressure range of 0.0001-0.99 and then were employed to determine surface area of adsorbents using the Brunauer, Emmett, and Teller (BET) equation. The pore size distributions (PSDs) of adsorbents were determined from the N2 isotherms via the Barrett, Johner, and Halenda (BJH) equation.
The chemical properties of adsorbents were determined by a Fourier transform infrared ray Spectrometer equipped with an attenuated total reflectance (FTIR/ATR) (model FTIR-SP-1 Spec-trum One, Perkin-Elmer, MA, U.S.A.) and the Boehm titration.17 The titration was conducted by adding 100 mg of adsorbents into a 100 mL flask containing 50 mL of the following 0.1 M solutions: NaHCO3, Na2CO3, NaOH, and HCl, respectively, which were sealed and shaken at 25°C for 48 h, and then filtered through a 0.45µm
fiber filter. The filtrate (10 mL) was pipetted and mixed with 15 mL of 0.1 M HCl or NaOH. The excess of acid and base was titrated with 0.1 M NaOH and HCl, respectively. The quantities of acidity of various types were determined from the assumption that NaHCO3 reacts with carboxylic groups (-COOH), Na2CO3 reacts with carboxylic and lactonic groups (-COO), and NaOH reacts with carboxylic, lactonic, and phenolic groups (-OH). The quantities of total basicity were determined from the amount of HCl reacted with the adsorbents.
Results and Discussion
1. Adsorption of CO2 with Various Modified
Adsor-bents. Figure 2 shows the qe of raw and various modified adsorbents with a Cinof 10%. It is seen that the qeincreased Figure 1. Diagram of the experimental setup.
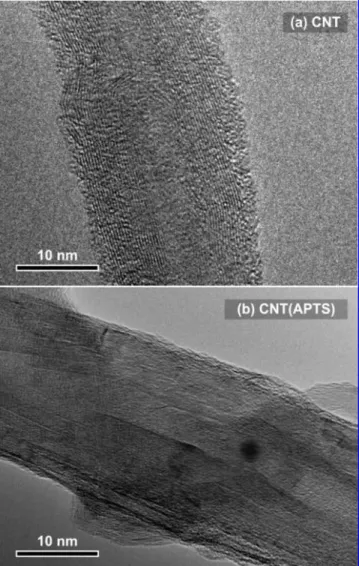
after these adsorbents were modified by MEA, NH3(aq), and APTS. The APTS-modified adsorbents have the greatest enhancement in qe, followed by the NH3-modified adsorbents and then the MEA-modified adsorbents. The raw and APTS-modified adsorbents were thus selected to study their physico-chemical properties and adsorption behaviors of CO2from gas streams. The possible mechanism for chemical adsorption of CO2 on APTS-modified CNTs in the absence of water is graphically presented in Figure 3. It is seen that the capture of CO2by surface amine groups causes the formation of carbamate ion (RNHCO2-) and thus results in adsorbing more CO2gases. 2. Characterizations of Adsorbents. Figure 4 exhibits the TEM images of raw and APTS-modified CNTs. Part a shows that the isolated CNT has a multiple graphitic layers structure with an outer diameter of ∼20 nm and a hollow inner tube diameter of 4-5 nm. Part b displays that the isolated modified CNT was grafted with a thick layer of APTS. The TEM images of modified GAC and zeolites also show a thick layer of APTS grafted on their surface.
Figure 5 shows the Raman spectra of CNTs and GAC. It is obvious that there are two sharp peaks located at∼1350 and ∼1580 cm-1. The peak at 1330-1360 cm-1is the D band which is related to disordered sp2-hybidized carbon atoms of nanotubes containing vacancies, impurities, or other symmetry-breaking defects. The peak near 1580 cm-1is the G band which is related to graphite E2g symmetry of the interlayer mode reflecting structural integrity of sp2-hybridized carbon atoms of the
nanotubes. Hence, the extent of carbon-containing defects of adsorbents can be evaluated by intensity ratio of the D band to G band (ID/IG).18The ID/IGratios of raw and modified adsorbents are 0.496 and 0.415 for CNTs and 1.040 and 0.995 for GAC. The ID/IG ratio slightly decreased after the modification, indicating that the modified CNTs and GAC possess more graphitized structures and less carbon-containing defects. The raw and modified zeolites exhibit no peaks due to lack of carbon atoms.
Figure 6 reveals the TGA curves of raw and modified adsorbents. It is obvious that the TGA curves of raw CNTs and GAC show a little weight loss close to 1% below 450 and 520
°C, respectively. After that a significant weight loss begins and ends at 670 and 700°C, in which a 4.29 and 9.22% remaining weight was found for raw CNTs and GAC, respectively. The modified CNTs and GAC have a broader temperature range for weight loss and exhibit three main weight loss regions. The first weight loss region (<550 °C) can be attributed to the evaporation of adsorbed water and the elimination of surface functional groups. The rapid weight loss region (550-620°C for CNTs and 550-720°C for GAC) can be assigned to the decomposition of carbon in CNTs and GAC. The third region only shows a very little weight loss close to 1%, in which 17.4 and 12.95% remaining weight was observed for CNTs and GAC, respectively. After the modification, the remaining (16) Hsu, H.; Lu, C. Sep. Sci. Technol. 2007, 42 (12), 2751–2766.
(17) Boehm, H. P. Carbon 1994, 32 (5), 759–769. 1620(18) Tsai, C. L.; Chen, C. F. Diamond Relat. Mater. 2003, 12 (9), 1615–. Figure 2. Equilibrium amount of CO2adsorbed on various raw and
modified adsorbents with a Cinof 10%.
Figure 3. Diagram of the possible mechanism for chemical adsorption
of CO2on APTS-modified CNTs in the absence of water.
weights of CNTs and GAC increased from 4.29 to 17.40% and from 9.22 to 12.95%, respectively, indicating that more APTS was grafted on the CNT surface. The TGA curve of raw and modified zeolites exhibits a weight loss of∼24% at 600 and 200°C, respectively, which could be due to the evaporation of adsorbed water and the elimination of surface functional groups. After that no significant weight losses with temperature were
observed because the gasification temperature of Si in zeolites and APTS is over the temperature range tested herein. Therefore, the C, H, and N burn off did not signal a significant weight change in TGA results on zeolites.
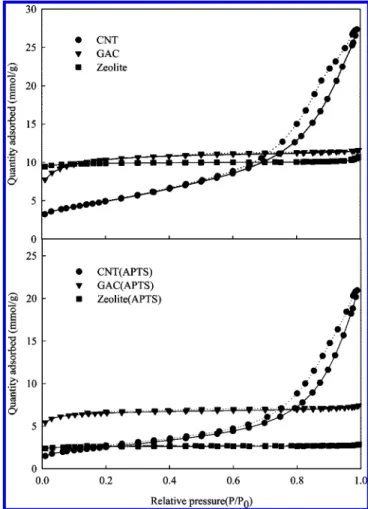
Figure 7 presents the adsorption/desorption isotherms of N2 via raw and modified adsorbents. It is clear that the adsorbents have more adsorption capacity of N2 after the modification, indicating a smaller amount of porosity within modified adsorbents due to the grafting of APTS on the adsorbent surface. The adsorption isotherms for raw and modified CNTs show a type IV shape according to IUPAC classification,19displaying a rise in N2 adsorption capacity with relative pressure. This reflects that both raw and modified CNTs have a broad pore size distribution. The adsorption/desorption isotherms of N2via raw and modified GAC and zeolites are approximately type I, which is classified as the Langmuir type and is characterized by the formation of a complete monolayer. After a sharp increase up to relative pressure of 0.1, the adsorption isotherms show a very small increment with relative pressure, indicating that the GAC and zeolites have small pores and their pore size distributions are very narrow. The adsorption/desorption iso-therms of GAC and zeolites nearly coincide with each other, implying the absence of adsorption hysteresis.
The physical properties of raw and modified adsorbents are given in Table 1. It is seen that the pore structure of adsorbents partially changed after the modification, which results in the decrease in the surface area and pore volume but a rise in average pore diameter. This could be explained by the grafting of APTS on the small pores of adsorbents. Most pore volumes (19) Gregg, S. J.; Sing, K. S. W. Adsroption, Surface Area and Porosity; Academic Press: New York, 1982.
Figure 5. Raman spectra of raw and modified CNTs and GAC.
Figure 6. TGA curves of raw and modified adsorbents.
Figure 7. Adsorption (solid line) and desorption (dash line) isotherms
of N2via raw and modified adsorbents.
of modified CNTs are in the 5-20 nm size range while most pore volumes of raw and modified GAC and zeolites are in the size range of 1.7-5 nm. It must be noted that the low detection limit for pore size of the employed BET analyzer is around 1.7 nm. Therefore, a quantification of the inner diameter distribution of adsorbents less than 1.7 nm is not possible in this study.
Figure 8 displays the IR spectra of modified adsorbents. It is observed that the IR spectra of modified CNTs exhibit several significant bands at 3674, 3200-3305, 2900-2971, 1391-1560, 1000-1200, and 800 cm-1 which are associated with bridge Si-OH acidic groups,20 asymmetric and symmetric NH
2 stretching -OH, CH stretching from CH2CH2CH2-NH2 groups,21NH
2deformation of hydrogen bonded amine group,22 and Si-O-Si(C)23and O-Si-O vibrations,24respectively. The abundance of these surface amine functional groups can provide numerous chemical adsorption sites for CO2 capture. The modified GAC has the remarkable bands at 3101, 1530, and 1020-1081 cm-1while the modified zeolites have the profound band at 1054 cm-1.
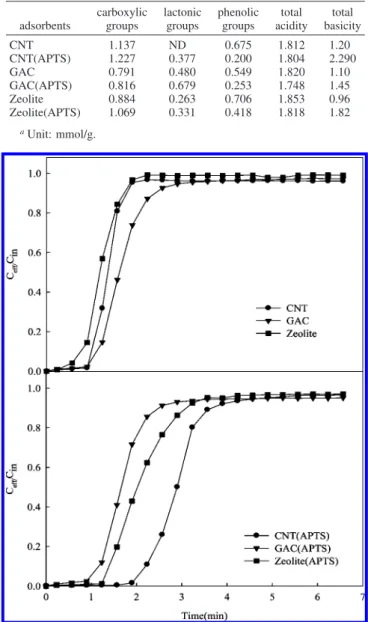
The results of Boehm titration are given in Table 2. It is seen that the amounts of carboxylic and lactonic groups increased but the amounts of phenolic groups decreased after the modification. The decrease in phenolic groups could be explained by the reaction between APTS and phenolic groups on silica during the modification. Similar findings have been reported in the literature.22The total basicity of adsorbents, which can be related to the chemical adsorption site for CO2capture, increased after the modification due to the grafting of amine groups on the adsorbent surface. The total basicity is in the following order: CNTs > GAC > zeolites for raw adsorbents and CNTs > zeolites > GAC for modified adsorbents.
3. Adsorption Behaviors. Figure 9 shows the breakthrough curves of CO2adsorption via raw and modified adsorbents with a Cinof 50%. It is evident that initially the CO2can be efficiently adsorbed on adsorbents with capture efficiencies >96%. The breakthrough times, the time at which effluent CO2concentration reaches 5% allowable breakthrough concentration, are in the following order: GAC > CNTs > zeolites for raw adsorbents and CNTs > zeolites > GAC for modified adsorbents. The breakthrough time becomes longer after the modification, and the modified CNTs were found to be the best of these adsorbents to achieve high CO2capture.
(20) Ha, V. T. T.; Tiep, L. V.; Meriaudeau, P.; Naccache, C. J. Mol.
Catal. A 2002, 181 (1-2), 283–290.
(21) Chang, A. C. C.; Chuang, S. S. C.; Gray, M.; Soong, Y. Energy
Fuels 2003, 17 (2), 468–473.
(22) Huang, H. Y.; Yang, R. T.; Chinn, D.; Munson, C. L. Ind. Eng.
Chem. Res. 2003, 42 (12), 2427–2433.
(23) Jing, S.; Lee, H.; Choi, C. J. Korean Chem. Soc. 2002, 41 (5), 769–773.
(24) Zhang, C.; Liu, Q.; Xu, Z. J. Non-Cryst. Solids 2005, 351 (16-17), 1377–1382.
Table 1. Physical Properties of Raw and Modified Adsorbentsa
% of total PV in stated pore size (nm) range adsorbents SA APD PV 1.7-5 5-20 >20 CNT 394 8.9 0.91 54.2 43.9 1.9 CNT(APTS) 198 12.2 0.63 31.7 63.5 4.8 GAC 954 2.0 0.48 96.6 3.3 0.1 GAC(APTS) 508 2.02 0.25 95.6 4.1 0.3 Zeolite 788 1.89 0.35 92.5 6.3 1.2 Zeolite(APTS) 203 1.95 0.09 97.7 1.1 1.2
aNote: SA, surface area (m2/g); APD, average pore diameter (nm);
PV, pore volume (cm3/g).
Figure 8. IR spectra of modified adsorbents.
Table 2. Results of Boehm Titrationa
adsorbents carboxylic groups lactonic groups phenolic groups total acidity total basicity CNT 1.137 ND 0.675 1.812 1.20 CNT(APTS) 1.227 0.377 0.200 1.804 2.290 GAC 0.791 0.480 0.549 1.820 1.10 GAC(APTS) 0.816 0.679 0.253 1.748 1.45 Zeolite 0.884 0.263 0.706 1.853 0.96 Zeolite(APTS) 1.069 0.331 0.418 1.818 1.82 aUnit: mmol/g.
Figure 9. Breakthrough curves of CO2adsorption via raw and modified
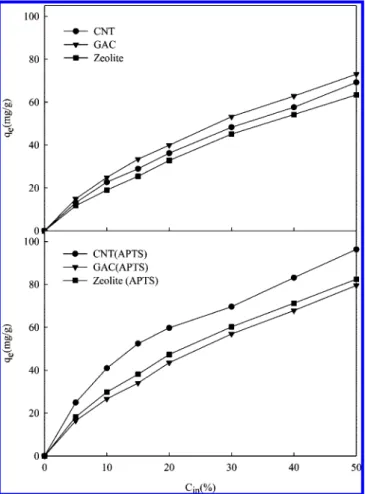
Figure 10 shows the adsorption isotherms of raw and modified adsorbents with a Cinrange of 5-50%. It is seen that the qe increased with Cinand was enhanced after the modification. With a Cinof 50%, the qeof CNTs, GAC, and zeolites respectively are 69.2, 72.9, and 63.5 mg/g for raw adsorbents and 96.3, 79.5, and 82.4 mg/g for modified adsorbents. The CNTs show the greatest enhancement in qe(27.1 mg/g), followed by the zeolites (18.9 mg/g) and then the GAC (6.6 mg/g).
Figure 11 shows the qec and qep of raw and modified adsorbents with a Cinof 50%. It is evident that both qecand qep
increased after the modification. The CNTs exhibit the greatest enhancement in qecand qep, followed by the zeolites and then the GAC. The qepvalues are much higher than the qecvalues, indicating that the mechanism of CO2 adsorption on these adsorbents appears mainly attributable to physical force, which makes the regeneration process of CO2 at a relatively low temperature become feasible. The increase in qep could be attributed to the increase in affinity between CO2molecules and adsorbent surface while the increase in qeccould be explained by the increase in total basicity and surface amine groups as shown in Table 2 and Figure 8, respectively.
The effect of relative humidity (RH) on the adsorption of CO2 via modified CNTs was evaluated with a Cin of 50%. Moisture was introduced into the gas stream by dispersing the diluting gas through a water bath before being mixed with pure CO2gas. The results indicated that the qeslightly increased with a rise in RH, which could be explained by the fact that with the adsorption of water on the surface of modified CNTs may cause the dissolution of CO2 into water. Furthermore, the carbamate ion formed in reaction of CO2 and surface amine groups may further react with CO2and H2O to form bicarbonate ion (HCO3-), or the amine groups themselves can also directly react with CO2and H2O to form HCO3-. Similar findings have been reported in the literature for adsorption of CO2 on polyethylenimine-modified MCM41.15
4. Comparison with Literature Results. The comparisons of qevia various raw and modified adsorbents are given in Table 3. Different adsorbents such as silica xerogel, SWCNT, SBA-15, MCM41, and activated carbon have been reported and modified by various kinds of grafting agents such as APTS, PEI, NH3, EDA, and TA. It is apparent that the qe of these adsorbents can be usually be enhanced after the modification. Under analogous conditions, the APTS-modified CNTs possess good performance of CO2 adsorption as compared to those reported in the literature, reflecting that the APTS-modified CNTs are promising adsorbents for CO2 capture from gas streams. And as the costs of commercially available CNTs are continuously decreasing, it is possible to utilize these novel materials in the near future.
Conclusions
The raw and APTS-modified CNTs, GAC, and zeolites were selected as adsorbents to study their physicochemical properties (25) Knowles, G. P.; Delaney, S. W.; Chaffee, A. L. Ind. Eng. Chem.
Res. 2006, 45 (8), 2626–2633. Microporous Mesoporous Mater. 2003, 62 (1-2), 29–45(26) Xu, X.; Song, C.; Andresen, J. M.; Miller, B. G.; Scaroni, A. W.. Figure 10. Adsorption isotherms of CO2 via raw and modified
adsorbents.
Figure 11. Physisorption and chemisorption capacities of CO2via raw
and modified adsorbents with a Cinof 50%.
Table 3. Comparisons of qevia Various Raw and Modified Adsorbents adsorbents grafting agents qe (mg/g) conditions references CNTs APTSa 40.9 C in) 10%, T ) 25°C this work APTS 96.3 Cin) 50%, T ) 25°C activated carbon 53 Cin) 99%, T ) 36°C 8 NH3 77 SBA-15 2.2 Cin) 15%, T ) 60°C 12 APTS 6.6 SWCNT 87 Cin) 99%, T ) 35°C 13 SBA-15 APTS 9.9 Cin) 4%, T ) 25°C 21
silica xerogel APTS 25 Cin) 5%, T ) 25°C 22
amorphous silica gel TAb 46 C in) 90%, T ) 20°C 25 MCM41 PEIc 19 C in) 99%, T ) 75°C 26 SBA-15 EDAd 20 C in) 15%, T ) 25°C 27 aAPTS ) 3-aminopropyl-triethoxysilane.bTA )
N-[3-(trimethoxysilyl)-propyl]diethylenetriamine.cPEI ) polyethylenimine.dEDA )
N-[3-(tri-methoxysilyl)propyl]ethylenediamine.
and adsorption behaviors of CO2from gas streams. The surface nature of these adsorbents was changed after the modification including the increase in affinity between CO2molecules and adsorbent surface and the increase in total basicity and amine groups, which makes these adsorbents that adsorb more CO2 gases. After the modification, the CNTs show the greatest enhancement in adsorption capacity of CO2, followed by the zeolites and then the GAC. Under analogous conditions, the APTS-modified CNTs have good performance of CO2 adsorp-tion as compared to many types of carbon and silica adsorbents reported in the literature, reflecting that the APTS-modified CNTs are promising adsorbents for CO2 capture from gas streams. The adsorption mechanism of CO2appears principally
attributable to physical force, which makes the regeneration process of CO2at a relatively low temperature become feasible and thus reduces a significant amount of energy requirement. Further work is currently underway to investigate the revers-ibility of CO2adsorption by these adsorbents.
Acknowledgment. Support from the National Science Council, Taiwan, under a Contract No. NSC95-2623-7-009-014 is gratefully acknowledged.
EF8000086
(27) Zheng, F.; Tran, D. N.; Busche, B. J.; Fryxell, G. E.; Addleman, R. S.; Zemanian, T. S.; Aardahl, C. L. Ind. Eng. Chem. Res. 2005, 44 (9), 3099–3105.