亞 東 技 術 學 院
Operation Efficiency Analysis and Improvement in Taiwanese Motherboard
Manufacturers
Yi-Horng Lai
Department of Healthcare Administration , Oriental Institute of Technology
Abstract
Utilizing Data Envelopment Analysis (DEA) approach, this study examines the relative efficiency of 12 Taiwanese motherboard manufacturers in 2004. The study has indicated how to use DEA to identify individual manufacturing companies that are less efficient than other comparable units in terms of output factors relative to input factors. This study utilizes Merge and Acquisition approach (M&A approach) for corporations to improve their efficiency. DEA approach is a tool to find out who is the best candidate to be merge and acquisition to get productivity.
Keywords: Motherboard, Efficiency Analysis, Merge and Acquisition approach
Introduction
The computer motherboard industry in Taiwan is highly competitive. In the past decade, the number of manufacturers is dropping from hundreds to forties. To get more orders and survive in the completive market, they demand achieving the highest levels of performance through continuous improvement and learning. It is therefore imperative that managers understand where they stand relative to competitors and best practices regarding their productivity.
Efficiency and productivity analyses can be vital managerial control tools for companies which want to operate efficiently. Besides, comparative and efficiency information can provide impetus for significant improvements and can let institutions know new practices and new paradigms. This study focuses on the efficiency of Taiwanese motherboard manufacturers. This is accomplished by comparing the sales and resources used by each company with those of all other companies. To future utilize the results this study choose Merge and Acquisition approach (M&A approach) for those inefficient firms to improve their efficiency. M&A approach is a convenient tool to become more efficient and competitive quickly in a highly competitive industry such as computer industry. The objectives of this study are analyzing the relative efficiency in Taiwanese motherboard manufacturers and improve their efficiency.
For those inefficient firms, it is very important for them to find the procedures to improve their efficiency. A more inclusive multiple-input, multiple-output framework for evaluating productive efficiency and providing efficiency information on how to become a well-managed company seems essential to improving decision making at poorly managed companies. Uncovering and understanding best practices is often limited by the simplicity of the analytical
framework. Simple gap analyses can provide important insight but are somewhat limited in scope because they take a one-dimensional view of a service, product, or process and because they ignore any interaction, substitutions, or trade-offs between key variables.
Porter [13] recommended that Taiwanese firms can remain competitive internationally with continuous improvement in technology, skills, and professionalism. Taiwanese motherboard manufacturer managers can increase firm efficiency through constant evaluation and assessment of production performance. This study provides a means of assessing production performance of Taiwanese motherboard manufacturers. The results of this study can lay the ground for future research to find the sources of production inefficiencies of low ranking manufacturers. Efficiency improvements in inefficient firms will increase the average efficiency and competitiveness of the entire Taiwanese motherboard industry.
Literature Review
Data Envelopment Analysis (DEA) approach is a powerful technique that not only supplements traditional approaches but also provides a more comprehensive insight into how well an organization is really performing.
2.1. Data Envelopment Analysis Approach
DEA approach is a relatively new technique for measuring company efficiency using a frontier approach. The DEA technique supplements traditional approaches and provides more comprehensive insights into organizational performance. DEA approach is a powerful tool that can be utilized to analyze and improve company performance [10] and is being generally used generally as a tool for measuring the technical efficiency of various organizations [6, 16]. DEA thus represents a good tool for performance measurement. Appendix A illustrates the mathematical model of DEA.
DEA is a linear programming model devised by Charnes, Cooper and Rhodes [4]. It measures the technical efficiency, or productivity, for each member of a set of comparable producing units. Charnes, Cooper and Rhodes extended the approach of Farrell [5] to establish a model that broadened the single-input and single-output ratio measurement of efficiency of a single Decision Making Unit (DMU) into a multiple-input and multiple-output setting. Their extended model measures technical efficiency. The technical efficiency of a DMU is computed using the measure of efficiency illustrated in Equation 1.
∑
∑
× × = input weight output weight Efficiency (Equation 1)DEA approach focuses on measuring the technical efficiency of DMUs. Meanwhile, efficiency represents an attempt to produce a given output with minimum inputs [9]. In DEA approach, no particular structure is superimposed on the research data for identifying the efficient units [7]. Instead, a best-practice structure is empirically constructed by applying linear programming to inputs and outputs. Moreover, this feature also means that units with different configurations of inputs and outputs can be recognized as efficient in production process implementation. DEA approach determines the inefficiency of a particular unit by comparing it to efficient units with similar configurations. This arrangement contrasts with parametric techniques where a particular measure of inefficiency is associated with statistical averages that may or may not be applicable to the composition of that unit. DEA labels a unit as either
efficient or inefficient compared to its reference set of performance measurement. So, the reference set of a unit is comprised of efficient units that most resemble that unit in input and output levels.
DEA approach has been applied in various organizations such as health care [6, 12], education [1, 15], government [8], banks [11], and the computer industry [17].
2.2. The Merger and Acquisition Approach
Merger and acquisition are two commonly ways to pursue growth and profit. An acquisition occurs when a large organization purchases a smaller firm, or vice versa. A merger occurs when two organization of about equal size unite to form one enterprise. Among mergers and acquisition in recent years, same-industry combinations have predominated. A general market consolidation is occurring in many industries, especially computer industry. Analysts agree that the Merger & Acquisition approach (M&A approach) trend that first become apparent in computer industry in the late 1990s shows no signs of slowing, primarily because of the benefits it has created and continues to create for the companies involved and for shareholders, such as HP and Compaq.
M&A approach is driven by plenty of motives. One of the most popular is efficiency theory [18]. For example, the argument of cost savings often advanced in support of firm mergers includes excess capacity. Other motivations for mergers are scale economies arising from technological change, and excess capital looking for investment opportunities. Firms can provide improved capacity utilization and gain economies of scale by M&A approach.
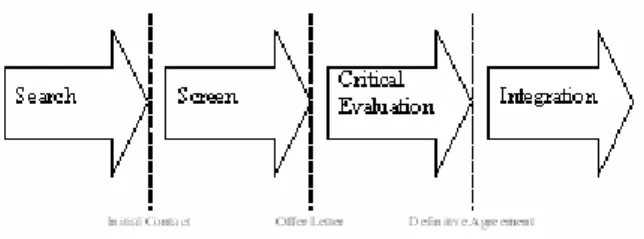
Robinson [14] breaks down merger and acquisition activity into four distinct process steps: search, screen, critical evaluation, and integration (Figure 1).
Figure 1. Robison’s strategic acquisition process.
In figure 1, the search step begins with a strategic plan that leads to a strategic acquisition objective and ends with identification of target buyers or seller. This step deals primarily with searching for suitable acquisition candidates. The screen step begins with initial contact with target businesses and ends with preparation of intent letters to the selected target. This step involves a preliminary evaluation and negotiation with targets to determine if an acquisition is feasible. The critical evaluation step begins with an agreement in principle and ends with a definitive agreement and “closed deal”. This step involves a detailed investigation of the selected acquisition candidate and definitive negotiation. The integration step begins with the transfer the strategic objective. This step involves integration of the acquired business into the acquiring entity to accomplish the strategic business objective.
An acquisition should meet a strategic need within the acquirer’s organization and, ultimately, should increase shareholder value. Evaluating acquisition candidates, therefore, requires a through understanding of the acquirer’s underlying business strategy. Only with such an understanding can synergies created by a potential acquisition be
adequately identified, understood, and quantified. Evaluating a candidate as a stand-alone entity is somewhat routine. But the nuances involved in any created synergies can be subtle and not easily quantified. To justify the acquisition, candidate evaluation requires more than finding an opportunity where the target’s economic performance outweighs the buyer’s cost of capital [14].
Research Methodology
In this study, data from 12 motherboard manufacturers in 2004 are collected. In Taiwanese motherboard industry, it’s very usual each company has multiple inputs and multiple outputs. Besides, production function is different in each company. DEA approach focuses on a best-practice frontier, instead of on population central-tendencies and handles multiple inputs and multiple outputs simultaneously. Hence this study show how DEA approach may be further extended to measure the nature and extent of motherboard industry in Taiwan. DEA approach is a tool to find out who is the best candidate to be merge and acquisition to get efficiency and productivity. It can be believed that such computations hold the potential of becoming a useful tool assisting financial analysts and managers in their routine evaluation of the performance of corporations and industries.
There are two steps in this study. The first step is “operation efficiency analysis”. According to the application procedure of DEA approach, the operation efficiency scores of Taiwanese motherboard manufacturers can be calculated. The second step is “operation efficiency improvement”. DEA approach and M&A approach be combined for those inefficiency who want to improve their operation efficiency and productivity.
3.1. Definition and Selection of DMUs
A wealth of data is available, in the form of easily available standard corporate financial reports, for any corporation with publicly traded stock. As noted above, this work employs such data which is taken from the Market Observation Post System of the Taiwan Stock Exchange Corporation (TSEC). This data is used to perform DEA approach to measure the relative efficiency of Taiwanese motherboard manufacturers.
There are many motherboard manufacturers in Taiwan, and there are total of 12 motherboard finished goods manufacturers that are listed on the TSEC, as listed in Table 1 [19]. These 12 Taiwanese motherboard manufacturers are all DMUs in this study.
Table 1. The 12 Taiwanese Motherboard Manufacturers in this Study
Company TSEC Code Company Name Web Address
ECS 2331 Elitegroup Computer Systems http://www.ecs.com.tw
USI 2350 ASE Group http://www.usi.com.tw
ASUS 2357 Asustek Computer http://www.asus.com.tw
GIGABYTE 2376 Giga-Byte Technology http://www.gigabyte.com.tw
MSI 2377 Micro-Star International http://www.msi.com.tw
DFI 2397 DFI Corporation http://www.dfi.com.tw
BIOSTAR 2399 Biostar Group http://www.biostar.com.tw
SHUTTLE 2405 Shuttle Computer Group http://www.spacewalker.com
CHAINTECH 2425 Chaintech Computer Company http://www.chaintech.com.tw
EPOX 5414 EPoX International http://www.epox.com
AOPEN 3046 AOpen Inc. http://www.aopen.com.tw
Since DEA approach is designed to examine a linear industrial production efficiency frontier, it is important to keep the list of participating companies relatively homogeneous, so that key production activities carried out by the companies are comparable [16]. The main operational activity of the 12 companies discussed in this work is motherboard production. This study uses the latest financial reports posted by these Taiwanese motherboard manufacturers, which are those from 2004.
3.2. Determination of Input and Output Factors
As measures of the inputs in this study as following indicators: -Input 1: Current Assets (CA)
-Input 2: Fixed Assets (FA) -Input 3: Other Assets (OA)
-Input 4: Cost of Goods Sold (COGS)
-Input 5: Marketing and Administrative Expenditures (MAE) -Input 6: Research and Development Expenditure (RDE) -Input 7: Other expenses (OE)
The inputs encompass a flow of total assets, raw materials, labor, overheads, and all expenditures. To measure the flow of outputs, the variables are used as the following indicators:
-Output 1: Revenue from Motherboard (RFMB) -Output 2: Revenue from Other Products (RFNMB) -Output 3: Other Revenues and Gains (OR)
The outputs encompass all the revenues a company earned within one year.
This work examines the Taiwanese motherboard manufacturers listed on the Taiwan Stock Exchange Corporation (TSEC). These public companies were duly approved by the Futures & Stocks Administrator Committee and the Ministry of Finance of Taiwan, with Simple Balance Sheets and Simple Income Statements. The financial reports of the companies provide the data source for this study. The selected study period was 2004, during this year 12 Taiwanese motherboard manufacturers (See Table 2) posted their Simple Balance Sheets and Simple Income Statements which is built by TSEC.
Table 2. The Financial Reports of 12 Taiwanese Motherboard Manufactures in 2004
Company CA FA OA COGS MAE RDE OE RFMB RFNMB OR ECS 12996086000 2031120000 905062000 15700472000 1374190000 404352000 183426000 14563303000 2702612000 391259000 USI 13150699000 3919914000 684962000 42732556000 1431707000 941702000 461828000 8352000000 45681582000 540409000 ASUS 50357809000 9047880000 1204496000 64421844000 5708404000 3090858000 291622000 9683083000 70168538000 11251350000 GIGABYTE 16475169000 3162940000 314816000 33433209000 1872581000 891701000 866120000 26681000000 12192054000 343494000 MSI 27128090000 3093470000 352369000 60615185000 3511975000 1612880000 509611000 23086958000 44073271000 579902000 DFI 2524175000 232132000 44572000 1993132000 157735000 90743000 64084000 2333558000 73584000 28719000 BIOSTAR 2176574000 360829000 38137000 5089686000 377783000 122645000 168376000 4066323000 1521568000 25780000 SHUTTLE 2653262000 982601000 225177000 6135611000 331575000 121577000 125568000 2961412000 3884783000 36466000 CHAINTECH 1306675000 39750000 14570000 2921806000 215406000 71811000 515924000 934380000 2304820000 25027000 EPOX 1380848000 283692000 115362000 3555873000 326735000 105257000 199561000 2569634000 1343120000 33342000 AOPEN 4761573000 743314000 116517000 15843890000 699172000 315430000 180255000 2782567000 12539290000 68396000 JETWAY 2245199000 188810000 31544000 4416650000 190234000 58528000 120898000 1432357000 3376814000 31682000
This study applies the output-oriented DEA model (See Equation 2) to reveal the extent to which inputs can be augmented while maintaining the same level of outputs. The model fits the current situation of Taiwanese motherboard
manufacturers: when outputs are fixed, companies should reduce inputs if they want to improve their efficiency. The work uses a DEA model to establish a foundation for measuring the efficiency of Taiwanese motherboard manufacturers. Max ( ) 1 1 0
∑
∑
= + = −+ + s r r m i i s s ε φ (Equation 2) s.t. 0 1 i i n j ij jx +s =x − =∑
λ i=1, 2,…, m; 0 0 1 r r n j rj jy s φ y λ + + = =∑
r=1, 2,…, s; , −, +≥0, r i j s s λThe evaluation system is Non-Archimedean Standard. In a Non- Archimedean evaluation system all excess input and output slack are given a value of a very small number (ε), that is, it can be assumed that the value of excess input and output slack is negligible. In a standard evaluation system a unit of excess input or output slack is valued at the same price.
Results
In this part, the operation efficiency of the 12 Taiwanese motherboard companies in 2004 is analyzed. Then, this study tried to improve the efficiency of inefficiency companies by Merge and Acquisition approach (M&A approach).
4.1. Calculation of Efficiency Scores
The main analysis method used in this study is the DEA approach. DEA can compare the technical efficiency of similar business units that use multiple inputs to produce multiple outputs. The DEA approach is a linear programming model that attempts to compare company efficiency, expressed as ratio of outputs to inputs, with that of a group of similar companies producing the same products [2, 3]. A scale efficiency measure can be defined as
0 0 0
γ
φ
π
=
.If
π
=
1
, a DMU is scale-efficient; otherwise. Ifπ
>
1
, a DMU is scale-inefficiency. Efficient units are those with efficiency scores of 100%, whereas other units with efficiency scores below 100% are classified as inefficient units. As noted by Norman and Stocker [9], “100% relative efficiency is attained by any unit only when compared with other units; it is a relative measure rather than absolute.” (p.7).Table 3 shows the efficiency scores of 12 Taiwanese motherboard companies. There are totally 12 DMUs solved, including 3 inefficiency DMUs and 9 inefficiency DMUs. ECS, GIGABYTE and SHUTTLE are inefficiency in 2004.
Table 3. The Efficiency Scores of 12 Taiwanese Motherboard Manufacturers
DMU Unit Score (%)
DMU01 ECS 100.00 DMU02 USI 96.19 DMU03 ASUS 100.00 DMU04 GIGABYTE 100.00 DMU05 MSI 100.00 DMU06 DFI 100.00 DMU07 BIOSTAR 100.00
DMU08 SHUTTLE 100.00 DMU09 CHAINTECH 90.19 DMU10 EPOX 93.41 DMU11 AOPEN 100.00 DMU12 JETWAY 100.00 4.2. Improvement of Efficiency
After understanding where the companies stand relative to their competitors, it is very important for these inefficiency companies about how to improve their efficiency and productivity.
Most observes agree that mergers are driven by a complex pattern of motives, and that no single approach can render a full account. Trautwein [18] point out companies can get efficiency and productivity by means of M&A approach. DEA approach is a powerful tool for choosing candidate for M&A. This study only focuses on these inefficiency companies, so this study try to improve the efficiency of CHAINTECH, EPOX and USI by M&A approach. Maybe they can improve efficiency by merge with each other. So, this study try to merge inefficiency companies each other for improve efficiency.
The most important issue of M&A approach is how to choose candidate for M&A. For these inefficiency firms in this study, CHAINTECH can merge with EPOX or USI (DMU13 and DMU15 in Table 4), USI merge with EPOX (DMU14 in Table 4), and EPOX with USI and CHAINTECH (DMU16 in Table4). The financial data of these hypothetical DMUs is the summary of candidate partners. For example, DMU13 are the summations of the associated input and output levels of CHAINTECH and EPOX. There are 4 hypothetical DMUs in this study (See Table 4). These 4 hypothetical DMUs mean 4 ways for these inefficiency companies improve efficiency by M&A approach.
Table 4. The Financial Data of M&A Candidatures (Hypothetical DMUs)
DMU Company CA FA OA COGS MAE RDE OE RFMB RFNMB OR DMU13 CHAINTECH+EPOX 3189476000 804584000 388125000 7317913000 506367000 179456000 298641000 4263440000 3788548000 54624000 DMU14 EPOX+USI 13061092000 4579630000 967171000 36049002000 1580622000 887131000 370456000 10801194000 28192168000 969381000 DMU15 USI+CHAINTECH- 12976128000 4621832000 1074010000 36505677000 1555753000 871191000 483305000 9740246000 29819620000 973047000 DMU16 CHAINTECH+EPOX+USI 14613348000 5003023000 1214653000 39936296000 1821371000 968889000 576201000 12402440000 30900168000 998526000
Table 5. The Efficiency Scores of 12 Taiwanese Motherboard Manufacturers with 4 M&A Candidatures
DMU Unit Score (%)
DMU01 ECS 100.00 DMU02 USI 98.19 DMU03 ASUS 100.00 DMU04 GIGABYTE 100.00 DMU05 MSI 100.00 DMU06 DFI 100.00 DMU07 BIOSTAR 100.00 DMU08 SHUTTLE 100.00 DMU09 CHAINTECH 92.16 DMU10 EPOX 94.39 DMU11 AOPEN 100.00 DMU12 JETWAY 100.00 * DMU13 CHAINTECH+EPOX 97.07 * DMU14 EPOX+USI 99.41 * DMU15 USI+CHAINTECH 100.00 * DMU16 CHAINTECH+EPOX+USI 99.44
The merging company needs to ensure its operation efficiency could be improved (or maintained the original level at least) after M&A. 4 hypothetical DMUs (DMU13, DMU14, DMU15 and DMU16) are created to represent the result of merger and acquisition (See Table 4). The efficiency scores of these 12 original motherboard manufactures and 4 hypothetical companies are shown as Table 5. For these hypothetical manufactures, only DMU 15 is efficiency. It means USI can choose CHAINTECH as M&A partner for improve efficiency. Although USI and CHAINTECH are inefficiency, they can operate efficiency by merging with each other.
Summarize, DEA approach indeed provides a new way to evaluate M&A candidate for these inefficiency improve efficiency by M&A approach.
Conclusions
The study analyzes the efficiency of the 12 Taiwanese motherboard manufacturers in 2004. The study has indicated how use DEA approach to identify individual manufacturing companies that are less efficient that other comparable units in terms of output factors relative to input factors. The study results obtained show that out of 12 motherboard manufacturers, 9 firms were found to be relatively efficient and 3 firms were inefficiency. ECS, GIGABYTE and SHUTTLE are 3 inefficiency Taiwanese motherboard manufacturers in 2004 (See Table 3).
This study adopted Merge and Acquisition approach (M&A approach) to improve a company’s efficiency. This study evaluate M&A candidate by means of DEA approach. This study provided rich and detail information on how the DEA results were accepted by companies in the context of deciding candidates for M&A. DEA provided new insights to senior managers on evaluating M&A candidates which are not available from other methods for assessment. This study found that USI can choose CHAINTECH as M&A partner for improve efficiency (See Table 5).
This study developed a general framework for combining M&A approach with DEA approach. Empirical results indicate that the useful information for M&A activity can be obtained from analyzing hypothetical DMUs’ efficiency. For inefficiency units, DEA results may be used as a supporting tool to those companies can use DEA as an assistant tool to choose candidates for M&A. It can be believed that such computations hold the potential of becoming a useful tool assisting financial analyst and mergers in their routine evaluation of the performance of corporations and industries.
References
[1] Aud, S., Competition and Efficiency Effects of Charter School. Doctoral dissertation, George Mason University, Virginia. 2002.
[2] Banker, R. D. and Thrall, R. M., Estimation of returns to scale using data envelopment analysis, European Journal of Operational Research, 62, pp.75-84. 1992.
[3] Brockett, P. L., Charnes, A., Cooper, W. W., Huang, Z. M., & Sun, D. B. (1997). Data transformations in DEA cone ratio envelopment approaches for monitoring bank performances. European Journal of Operational Research, 98(2), 250-268.
[4] Charnes, A., Cooper, W. W., & Rhodes, E., Measuring the Efficiency of Decision Making Units. European Journal of Operational Research, 2(6), pp.391-465. 1978.
[5] Farrell, M. J., The measurement of productive efficiency. Journal of the Royal Statistical Society, 123(3), pp.253-290. 1957.
[6] Giokas, D., The use of goal programming, regression analysis and data envelopment analysis for estimating
efficient marginal costs of hospital services. Journal of Multicriteria Decision Analysis, 11(4-5), pp.261-268. 2002.
[7] Mester, L. J., A study of bank efficiency taking into account risk-preferences. Journal of Banking & Finance, 20(6), pp.1021-1045. 1996.
[8] Nguyen, K. L. T., Joint Production of Rice and Aquatic Animal Food Species Implications for Pesticide Use in
Vietnam. Doctoral dissertation, University of Maryland, Maryland. 2000.
[9] Norman, M., & Stoker, B., Data Envelopment Analysis: The Assessment of Performance. New York: NY: John Wiley & Sons. 1991.
[10] Norton, R., Which offices or stores really perform best? A new tool tells. Fortune, 130(9), pp.38. 1994.
[11] Oral, M., & Yolalan, R., An Empirical Study on Measuring Operating Efficiency and Profitability of Bank
Branches. European Journal of Operational Research, 46(3), pp.282-294. 1992.
[12] Ozcan, Y. A., & McCue, M. J., Development of a Financial Performance Index for Hospitals: DEA Approach. The Journal of the Operational Research Society, 47(1), pp.18-26. 1996.
[13] Porter, M. E., The competitive advantage of Taiwan. Harvard University, Institute for Strategy and Competitiveness. Retrieved December 31, 2003, from http://www.isc.hbs.edu/econ-natlcomp.htm. 2001.
[14] Robinson, B. R., Strategic acquisitions: a guide to growing and enhancing the value of your business. Burr Ridge, IL: Irwin Professional Publishing. 1995.
[15] Ruggiero, J., & Vitaliano, D. F., Assessing the efficiency of public schools using data envelopment analysis and
frontier regression. Contemporary Economic Policy, 17(3), pp.321-331. 1999.
[16] Silkman, R. H., Measuring efficiency: An assessment of data envelopment analysis. San Francisco, CA: Jossey-Bass Inc. 1986.
[17] Thore, S. F., Phillips, F., Ruefli, T. W., & Yue, P., DEA and the Management of the Product Cycle: The U.S.
Computer Industry. Computers Operations Researches. 23(4), pp.341-356. 1996.
[18] Trautwein, F., Merger Motives and Merger Prescriptions. Strategic Management Journal., 11(4), pp.283-295. 1990.
[19] Yahoo Taiwan Finance, The stock prices of Taiwanese Motherboard manufacturers. Retrieved January, 31, 2006, from http://tw.stock.yahoo.com/s/kimo_listE18.html?rr=10758426934670.9913211909937998. 2006.