情緒智商為壓力與工作績效關係研究之調節變數
66
0
0
全文
(2) 誌 謝 論文得以順利完成要感謝很多人,首先要感謝恩師吳毓麒老師的耐心指導,從論文 的方向、動機和架構給學生很多建議,讓學生在撰寫論文能有更嚴謹且周延的思考,在 此向老師表達最深的謝意。再者,在論文口試時,承蒙鄭育仁老師、蔡進士老師對論文 的指正與建議,並提供許多寶貴的意見讓論文能更加完整。也要感謝李揚老師在期初與 期末 proposal 及課堂上指導,使我在學習過程中進步良多。 進行問卷調查時,感謝朋友們及梁大哥的幫忙,更感謝參與問卷調查金融保險業的 各位先進,因為有你們的協助讓問卷蒐集可以順利完成。也要謝謝所有一起陪我度過這 段歲月的同學們-同指導老師一點都不胖的施大大、有大將之風的淑娟、常常一同在 308 奮鬥到很晚,幫我很多常聽我訴苦的逸涵;帶很大家許多歡樂的邵哥哥、大姊頭美怡、 雅婷、小台、志傑、孟熙;常一起上課的冠豪、湘旻、亭廷,除了課業上的協助外,在 研究所生涯中分享彼此的酸甜苦辣,很開心我們一起走過來。能夠有機會在高大經營管 理研究所接受多位良師的教導,並認識很多優秀的同學,這讓我在研究生涯中留下了一 段難以忘懷的求學回憶。 另外,要感謝冠婷姐的教導讓我在研究所除了學業外,還有機會可以學習待人接物 的方法和態度。最後也是最重要的,感謝我親愛的爸爸在工作之餘還抽空幫我發問卷, 感謝我親愛的家人多年來鼓勵與支持,讓我可以無後顧之憂的完成研究所學業。謝謝在 這過程中所有關心我的師長、學長姐、學弟妹及朋友們,由衷的感謝大家。. 陳怡嬛 謹誌 高雄大學經營管理研究所 民國九十八年六月. I.
(3) 情緒智商為壓力與工作績效關係研究之調節變數 指導教授:吳毓麒 博士 國立高雄大學經營管理所. 學生:陳怡嬛 國立高雄大學經營管理所. 摘要 之前的研究結果顯示工作壓力與績效具有不一致的關係。它們未能有一致關係的其 中一個可能解釋原因是它們可能存在調節作用。本研究調查情緒智商對工作壓力與績效 間的影響。樣本總共包括 446 名受訪者。透過階層迴歸分析,在控制性別、年齡、教育 背景、家庭狀況、任職期間和工作層級後,結果顯示情緒智力跟工作績效是正相關,且 情緒智商會調節工作壓力與績效間的關係。但是,結果並沒有證實工作壓力與績效是負 相關。我們根據文獻將工作壓力分為兩個層面-時間壓力和焦慮,進一步採用探索性分 析調查結果發現,此兩構面和工作績效具有不同的關係。時間壓力和工作績效是正相 關;而焦慮和工作績效是負相關。這個結果顯示工作壓力與績效間的關係不穩定的原因 之一可能是因為存在不同的壓力源。此外,本研究在實證上也證實了壓力與績效間的關 係存在調節效果。. 關鍵字: 關鍵字:工作壓力、 工作壓力、情緒智商、 情緒智商、工作績效. II.
(4) Emotional Intelligence as a Moderator of the Relationship between Stress and Job Performance Advisor: Dr. Yu-Chi Wu Institute of Business and Management National University of Kaohsiung Student: Yi-Hsuan Chen Institute of Business and Management National University of Kaohsiung. ABSTRACT Prior researches have shown inconsistent findings for the relationship of job stress-performance. One of the possible reasons for the failure to consistent relationship may be the existing moderating effect. We investigate the impact of emotional intelligence on job stress and job performance. The samples included 446 respondents. A series of hierarchical regressions, while controlling gender, age, educational background, family status, job tenure, and job level, indicated that emotional intelligence augmented positive job performance and moderates the relationship of job stress-performance. However, the results did not confirm the negative relationship between stress and job performance. Moreover, our exploratory findings show that two dimensions of job stress, time pressure and anxiety, have different relationships with job performance. Time stress is positive to job performance, but anxiety is negative to job performance. The results suggest that the inconsistent relationship of stress-performance may exist the different source of stress. In addition, it is also importance to considerate the moderator in stress-performance relationship for theoretical and practical.. Keywords: Job stress, Emotional intelligence, Job performance. III.
(5) Contents Acknowledgment ..................................................................................................................I Abstract in Chinese ........................................................................................................... ΙI Abstract in English ...........................................................................................................III Contents ................................................................................................................. IV List of Tables ......................................................................................................... VI List of Figures ...................................................................................................... VII Chapter One. An Introduction ........................................................................ 1. 1.1. Research Background ........................................................................................1. 1.2 1.3. Research Purpose and Questions .......................................................................3 Research Procedure............................................................................................4. Chapter Two Literature Review ..................................................................... 5 2.1 2.2 2.3. Preamble ............................................................................................................5 Job Stress ...........................................................................................................5 Job Performance.................................................................................................7. 2.4. Emotional Intelligence .......................................................................................8. Chapter Three Research Methodology ........................................................ 11 3.1. Preamble .......................................................................................................... 11. 3.2 3.3 3.4 3.5 3.6. Research Hypotheses ....................................................................................... 11 Sample..............................................................................................................14 Questionnaire Design.......................................................................................15 Data Analysis Techniques ................................................................................19 Pilot Test ..........................................................................................................20. Chapter Four Data Analysis and Results..................................................... 22 4.1 4.2 4.3 4.4. Data Collection ................................................................................................22 Descriptive Statistics........................................................................................22 Reliability.........................................................................................................28 The Influence of Demographic Variables on the Constructs ...........................31. 4.5 4.6 4.7. Correlation Analysis.........................................................................................35 Hierarchical Regression Analysis ....................................................................36 Discussion ........................................................................................................41 IV.
(6) Chapter Five Conclusions and Suggestions................................................. 43 5.1. Preamble ..........................................................................................................43. 5.2 5.3 5.4 5.5. Research Findings............................................................................................43 Research Contributions and Managerial Implications.....................................45 Limitation.........................................................................................................47 Suggestion for Future Research .......................................................................48. Refferences ..........................................................................................................................49 Appendix A: :Questionnaire .........................................................................................54 AppendixB: :Items of the Questionnaire in English ............................................57. V.
(7) List of Tables Table 3-1 Pilot Test Reliability of Job Stress, Emotional Intelligence and Job Performance ...........................................................................................................21 Table 4-1 Summary of Questionnaires and Response Rates ..................................................22 Table 4-2 The Description of the Respondent Sex ..................................................................23 Table 4-3 The Description of the Respondent Age..................................................................23 Table 4-4 The Description of the Respondent Age Range.......................................................23 Table 4-5 The Description of the Respondent Educational level. .........................................24. Table 4-6 The Description of the Respondent Family Status ..................................................24 Table 4-7 The Description of the Respondent Job Tenure .....................................................24 Table 4-8 The Description of the Respondent Job Tenure Range............................................25 Table 4-9 The Description of the Respondent Job Level .......................................................25 Table 4-10 The Description of the Respondent Type of Office ...............................................26 Table 4-11 Characteristics and Reliability of Job Stress..........................................................29 Table 4-12 Characteristics and Reliability of Job Performance...............................................29 Table 4-13 Characteristics and Reliability of Emotional Intelligence .....................................30 Table 4-14 The Influence of Demographic Variables on Job Stress ........................................32 Table 4-15 The Influence of Demographic Variables on Emotional Intelligence.............................................................................................................33 Table 4-16 The Influence of Demographic Variables on Job Performance .............................34 Table 4-17 Correlations............................................................................................................36 Table 4-18 Results of Regression Analysis between Job Stress and Job Performance............37 Table 4-19 Results of Regression Analysis between Sub-factors of Job Stress and Job Performance..............................................................................................38 Table 4-20 Results of Regression Analysis between Emotional Intelligence and Job Performance ...........................................................................................................39 Table 4-21 Results of the Moderating Role of Emotional Intelligence (EI)............................40 Table 4-22 Summary of Hypotheses Test ................................................................................42. VI.
(8) List of Figures Figure 1-1 Research Procedure..................................................................................................4 Figure 3-1 The Conceptual Framework and Hypotheses ........................................................14 Figure 4-1 The Moderating Effect of Emotional Intelligence (EI) ..........................................41. VII.
(9) Chapter One An Introduction 1.1 Research Background According to the World Competitiveness Yearbook (WCY) by the International Institute for Management Development (IMD) in 2007, the average working hours of Taiwanese is 2,256 per year, 41.6 per week, and ranked at the 5th place over the world in 2006. Taiwanese are working longer and harder than the other countries, and job stress continues increasing. Besides, the Analysis of Working Employees Tiredness from Council of Labor Affairs on August 2008 revealed that the most tiring occupation is financial institution and insurance. It is reported that sale-oriented in these years may put too much stress on employees of financial institutions. This study is researching the effect of such phenomenon on Taiwanese financial industry. First of all, here is a brief description of the overall background of Taiwanese financial industry. Before 1991, there were fewer financial institutions in Taiwan. The contents of tasks were not quite various, and also the rate of turnover of employees in financial companies was lower. However, after 1991, Taiwan’s government put much effort to liberalize the country's financial industry. The operation of number of private financial companies in Taiwan rapidly increased. What’s more, after the time Taiwan joining in World Trade Organization (WTO) in 2002, domestic financial market was completely opened. Many famous international investment financial companies which have rich capital and management experience entered the financial market of Taiwan and set new branches. It is undoubtedly a tremendous impact for the operation of local financial institutions. They gradually change their managerial strategies, such as selling various products and setting performance standards per month for employee. To achieve the standards of performance,. 1.
(10) they promote aggressively the financial products. Financial and insurance industry in Taiwan nowadays has confronted a more competitive environment. Except good strategy to cope, employee in companies also should be regarded, because employee performance is key factor for success of financial and insurance companies (Campbell, 1990; Dyne, Jehn, & Cummings, 2002). However, financial and insurance employees as boundary spanning role servers always need to satisfy the demands of organization and customers at the same time (Bettencourt & Brown, 2003; Zeithaml, Berry, & Parasuraman, 1988), and this makes them much stressed. Too much stress will make workers and organization enormously damaged. Past researches found over-stress affected badly workers’ health, for their mental health will be nervous and decreased attention; for their physical aspect, it can cause headache and other diseases (Beehr & Newman, 1978). Moreover, if the stress of work under sale-oriented can not be effectively overcome, job performance will reduce, and even lead to workers’ absence or turnover (Gupta & Beehr, 1979). Although most empirical studies showed job stress to job performance appeared to be negative relationship (Friend, 1982; Jamal, 1984, 1985; Allen, Hitt, & Greer, 1982), some researches still point out their relationship to be positive (Arsenault & Dolan, 1983; Hatton et al., 1995). The relationship between job stress and job performance is uncertain. Jex (1998) suggested that the effect of job stress on job performance may ignore other important factors and may be moderated by several variables. Job stress does not direct to stressors but it is a perceived state. Different personalities of individual will affect perceived stress (Siu, 2003). Jordan, Ashkanasy, and Hartel (2002) pointed out “emotional intelligence as an individual-difference variable that moderates stimulus-behavior linkages” (p. 369). In this study, we expect that the effect of emotional intelligence will be as moderator of stress-performance, because it possesses many abilities to explain the way of regulating. 2.
(11) emotions.. 1.2 Research Purpose and Questions Job stress is a very important issue in the industrial society, because it is costly. But most researches and theories of stress are from the western (Jamal, 1999; Xie, 1996). To test the western theories in Chinese society can enlarge the generalization of them. Under the very competitive of Taiwanese banking industry, the organizations expand the scope of employees’ tasks and set the standards of job performance monthly for enlarging businesses and increasing market share. These take great load on employees and making job stress of financial workers were the most over all professions. Too much job stress will negatively affect individual job performance, and it will affect the competition of organization. Emotional intelligence is popular in the last two decades and it is one of important personalities. In this study, we add emotional intelligence to figure out if that will affect the relationship between job stress and job performance. According to the above situation, here are three questions in this research: 1. Will employees feeling high job stress perform less effectively than those feeling low job stress? 2. Will job performance of employees with high emotional intelligence be different from that of employees with low emotional intelligence? 3. Will emotional intelligence influence (moderate) the relationship between employee’s job stress and job performance? These research questions above are major especially when financial institutions in Taiwan come up the stress for employees.. 3.
(12) 1.3 Research Procedure This study follows the procedure as illustrated in Figure 1-1.. Identifying research objectives. Reviewing related literature and Formulating research hypotheses. Establishing research model. Questionnaire design. Data collection and analysis. Discussions and suggestions. Figure 1-1 Research Procedure. 4.
(13) Chapter Two Literature Review 2.1 Preamble This chapter begins introducing relevant literatures and definitions about job stress, job performance, and emotional intelligence. These concepts and findings are importance to offer the theoretical base for the current research.. 2.2 Job Stress Stress is a rising concern in each country, because it is costly (King & Gradner, 2006). Working in the organization is major part of stress due to job occupying most of individual time. Employer’s demands may affect employee stress which is “an unpleasant emotional experience associated with elements of fear, dread, anxiety, irritation, annoyance, anger, sadness, grief, and depression.” (Motowidlo, Packard, & Manning, 1986, p. 618) Lepine, Podskoff, and LePine (2005) suggested “the stressors are the stimuli that evoke the stress process, and the strains are the outcome in the process” (p. 764). Stressors consist of work demand, lack of work control, less person-environment fit and so on (Karasek, 1979; King & Garder, 2006). Employee confronting similar level of stressors may be different reflection, and it may originate from different work experience. It is generally tend to view job stress is representing stimuli in the workplace that may or may not exceed an individual’s ability to deal (Schaubroeck et al., 1993). Perceived job stress is associated with time pressure and felt anxiety of tasks. According to Parker and Decotiis (1983) job stress has been “the feeling of a person who is required to deviate from normal or self-desired functioning in the work place as the result of opportunities, constraints, or demands relating to potentially important work-related outcomes” (p. 165). Job stress is a condition where job-related factors affect employee to 5.
(14) change his or her psychological state which deviate from normal functioning (Richardson & Rothstein, 2008; Newman & Beehr, 1979). Moreover, Beehr and Franz (1987) defined job stress as “the psychological state experienced by an individual when faced with demands, constraints, and/or opportunities that have important but uncertain outcomes.” Based on above, we defined job stress as unpleasant experience when faced the situation in the workplace deviate from self-desired functioning of demands, constraints, opportunities, and even threatening employee’s immediate situation, causing feeing anxiety, anger, and depression. Individuals perceived high job stress could waste employee attention, energy, and time to deal with stressors. In stressful environment individuals felt anxiety, lose concentration, stomach disorders, and headaches for physical and mental health (Beehr & Newman, 1978). Jamal (1984) study nurses to support that job stressors (role ambiguity, overload, conflict, and resource inadequacy) and role performance are negative linear relation. Dyne, Jehn, and Cummings (2002) studied stylists in US to report that work and home strain are negatively related to workers sales performance. Siu (2003) described job stress as dysfunctional functions and decreasing job performance. Beehr and Newman (1978) stated outcomes of job stress would change in quality and quantity of job performance. Job stress also directed effect job satisfaction, absenteeism, and even intention to turnover (Gupta & Beehr, 1979; Chiu et al, 2005; Firth et al, 2004). In opposition to negative relationships, Selye (1956) said that healthy or the happy pressure is enstress that viewed job stress as challenges and associated with positive effects. Meglino (1977) observed individual at low level of stress could not perceive challenge, and therefore be impossible to enhance performance. High job stress could lead better performance. A few researches supported that the inverted-U concept (Yerkes & Dodson, 1908) integrated negative linear and positive linear concepts, and suggested that 6.
(15) organizations should be maintaining moderate level of job stress to arrive peak employee performance (Tuten & Neidermeyer, 2004). It views stress as challenge before optimal point and after that becomes bad. The relationship between job stress and job performance is controversy. One of the reasons is that the response of stressor is two dimensions. LePine et al. (2005) through meta-analysis found stressor associated with hindrance-oriented (e.g., role ambiguity and role conflict) are negative to job performance, and second dimension stressors associated with challenge-oriented (e.g., time pressure) are positive to job performance. But Sullivan and Bhagat (1992) argued lack of some concepts is failure to think about individual characteristics and disorder of perceived stress. For individual with high need of achievement in high stressful workplace may improve performance; individual with low need of achievement in high stressful workplace may not improve performance.. 2.3 Job Performance Job performance of employee is an important research because it is essential for organizational success (Dyne, Jehn, & Cumming, 2002; Campbell, 1990). Job performance has been by evaluating “the degree to which organizational and personal goals are reached (Pruden & Reese, 1972).” And job performance indicates quantity and quality of outcomes which individual or group effort attainment (Schermerhorn, Hunt, & Osborn, 2005). Robbins (2005) described job performance as “how amount of effort an individual will exert in his or her job” (p254). Moreover, job performance relies on “the demands of the job, the goals and missions of the organization, and beliefs in the organization about which behaviors are most valued.” (Befort & Hattrup, 2003; Motowidlo & Schmit, 1999; Murphy & Shiarella, 1997) According to above, we defined job performance as the degree which the individual effort reaches quantity and quality of missions or goals in the organization. Performance appraisal tool is important for organizational human management. 7.
(16) Ivancevich and Matteson (2002) described performance appraisal “providing important feedback about how well the individual is getting along in the organization” (p. 79). Performance appraisals are intended to below aims (Schermerhorn et al., 2005, p. 168-169): 1.. Defined the criteria about how to measure their performance.. 2.. Justice rewards given to employee let them feel confident.. 3.. Rating strengths and weaknesses of individual performance offers feedback for adjusting employee performance to fit with organizational expected goals.. 4.. Evaluated promotions and reward increases are based on performance appraisals. Four functions of performance appraisal tool indicated that is not only supervise and. correct employee behaviors but also modified performance to suit goals of organization for individual. Performance appraisal could be an essential guideline to upgrade organizational production.. 2.4 Emotional Intelligence In the early 1980, similar concept of emotional intelligence had begun. Gardner (1983) proposed concept of interpersonal and intrapersonal intelligence offering the base for later researches. Salovey and Mayer (1990) first used phrase of emotional intelligence and defined emotional intelligence as the “ability to monitor one’s own and others’ feelings and emotions, to discriminate among them and to use this information to guide one’s own thinking and actions” (p. 189). Afterward they redefined emotional intelligence which added the cognitive component as “the ability to perceive emotions, to access and generate emotions so as to assist thoughts, to understand emotions and emotional knowledge, and to reflectively regulate emotions so as to promote emotional and intellectual growth.” (Mayer & Salovey, 1997, p. 5) Goleman (1995) published the popular book “Emotional Intelligence” that described concept of emotional intelligence detailed and defined it as an individual ability to understand, deal,. 8.
(17) and manage emotions both internally and others. According to above, we defined emotional intelligence as individual competence to aware, regulate, and utilize emotions effectively in self and others. Salovey and Mayer (1990) proposed that emotional intelligence included three factors: evaluation and expression of emotions in the self and the other, regulation of emotions in the self and the other, and utilization of emotions. Individuals with evaluation and expression of emotions are ability to know their emotions. They can express accurately their feeling and are also conscious of the other emotions through verbal and non-verbal expression. The second factor is regulations of emotion that people are able to manage and regulate their emotions in order to keep in positive states even though experience negative affective. Emotional intelligence individual not only regulates himself or herself well also care for and appease others' emotions, so could establish good social relationship. The third factor is utilization of emotions included of thinking about more future plans (flexible planning), understanding self emotion well to solve problem creativity (creative thinking), paying attention to more important work (redirected attention), and strengthening ability when facing challenging task (motivation). The ability of emotional intelligence advantages individual to success in the life and organization. High EI individual tries to understand self emotions and adapts appropriate emotional management instead of avoiding or accusing negative emotions. They tend to use strategies such as social support and disclosure of feelings for keeping emotions on the desired state. The high EI of managers is related positively to managers’ job satisfaction (Carmeli, 2003), job performance (Slaski & Cartwright, 2002; Carmeli, 2003), transformational leadership style (Mandell & Pherwani, 2003), and negatively to managers’ withdrawal intention (Carmeli, 2003). In many vocations, emotional competencies are essential to facilitate performance 9.
(18) (Stough & De Guara, 2003; King & Gradner, 2006). The higher emotional intelligence employees, the more likely they are satisfied their jobs (Dong & Howard, 2006). Higgs (2004) measured emotional intelligence which adapted EIQ-G (emotional intelligence questionnaire general) developed by Dulewicz and Higgs (2000) and this instrument consists self-awareness, emotional resilience, motivation, inter-personal sensitivity, influence, conscientiousness and integrity, and intuitiveness. They indicated that is strong relationship between emotional intelligence with job performance on UK call centres.. 10.
(19) Chapter Three Research Methodology 3.1 Preamble Based on review of the previous literature, the principal research conducts how job stress and emotional intelligence affect job performance, and how emotional intelligence influences the relationship between job stress and job performance. This chapter includes research hypotheses, sample process, questionnaire designs, data analysis techniques and pilot test.. 3.2 Research Hypotheses 3.2.1 Main effects of job stress on job performance Most research identified a negative stress-performance relationship, and concluded the effects of role ambiguity and role conflict have negative relationships with job performance (Gilboa, Shirom, Fried, & Cooper, 2008; Fried et al., 1998). Siu (2003) explained that job stress was dysfunctional and decreased job performance. Beehr and Newman (1978) stated the outcomes of job stress would be changes in quality and quantity of job performance. Job stress could waste individuals’ time and energy dealing with stressors, so that they could not concentrate on the immediate task and so become less able to drive performance. Therefore, we hypothesized job stress has a negative effect on job performance.. H1: :There is a negative relationship between job stress and job performance.. The literature explores the relationship between stress and performance, and it may be a negative linear, positive linear, or inverted-U relationship. Although theorists prefer to support a curvilinear concept, most empirical research indicates a negative linear relationship between stress and performance (Siu, 2003; Friend, 1982; Jamal, 1984, 1985; Dyne, Jehn, & 11.
(20) Cumming, 2002). However, some empirical research that tests the relationship between stress and performance has shown mixed and inconsistent findings. One of the possible reasons for the failure to find a consistently and statistically significant relationship between stress and performance may be the existing moderator (Jex, 1998). This study proposes emotional intelligence is a moderator of job stress-job performance. 3.2.2 Emotional intelligence as a moderator of the stress-performance relationship Main effects of emotional intelligence on job performance Emotional intelligence allows an individual to be aware of, regulate, and utilize emotions effectively in self and others (Salovey & Mayer, 1990, 1997; Goleman, 1995). Goleman (1989, 2001) argued emotional intelligence is a required factor for performance and is positively to correlated successful outcomes of the individual in the organization. Most research studied the effects of emotional intelligence on management leadership skills. The high-emotional-intelligence managers displayed high levels of their job satisfaction, job performance, transformational leadership style, and low levels of intention to leave their job (Carmeli, 2003; Slaski & Cartwright, 2002; Mandell & Pherwani, 2003). A few studies were done on the emotional intelligence of employees. Emotional competencies were found to necessary to facilitate performance on many occupations. (Stough & De Guara, 2003; King & Gradner, 2006). Also, Higgs (2004) indicated that emotional intelligence is strongly correlated with job performance in UK call centres. High-emotional-intelligence individuals could manage themselves and have the social competence to manage others and advance interpersonal relationships. Motowidlo, Packard, and Manning (1986) found that depression had a significant negative effect on performance. High-emotional-intelligence employees have the ability to be aware of and manage their emotions keeping in positive metal states, leading to good job performance. It is hypothesized that employees with higher emotional intelligence will have better performance than those 12.
(21) with lower emotional intelligence. H2 : There is a positive relationship between emotional intelligence and job performance.. The moderator role of emotional intelligence The relationship between job stress and job performance is inconsistent. Jex (1998) argued that may ignore some major factors and suggested to add broader range of moderators to the relationship of stress-performance. Source of stress does not always induce stress directly, but come from perceive of stress (Siu, 2003). Besides, dispositional variables are associated with stress perceived and some researches argue that they could be moderating the effect of stress outcomes in the organization (Parker & DeCotiis, 1983; Ivancevich & Matteson, 1980). As Jordan, Ashkanasy, and Hartel (2002) indicated “emotional intelligence as an individual-difference variable that moderates stimulus-behavior linkages” (p. 369). Furthermore, Carmeli (2003) suggested that future research should further investigate the effect of emotional intelligence may play in the relationship of job stress and job attitudes. Emotional intelligence influences an individual response and ability to deal effectively with organizational demands (Slaski & Cartwright, 2002). The ability of regulating emotions may facilitate to manage personal resources effectively (Lazarus, 1999; King & Gradner, 2006). High emotional intelligence individuals tend to understand emotions through cognitive reappraisal and use strategies such as social resources and disclosure of feelings in the stressful workplace (King & Gradner, 2006; Siu, 2003). Core ability of emotional intelligence may associate to “resilience and adaptability in stressful environments.” (Matthews, et al., 2006; Bar-On, 2000) Emotional intelligence person is likely able to control some interferences or at least moderate them to an acceptable degree (Carmeli, 2003). This study expects emotional intelligence as moderator of stress-performance, and generates the. 13.
(22) following hypothesis. H3: : Emotional intelligence will moderate the relationship between stress and job performance, such that the negative relationship between job stress and job performance is stronger for employees those who are low emotional intelligence than who are high emotional intelligence. Figure 3-1 is the research model and describes the relationship between job stress, job performance, and emotional intelligence. The relationship between job stress and job performance is expected to be moderated by emotional intelligence. That included three hypotheses. Emotional Intelligence. H3 Job. H2 Job. Stress. Performance. H1. Figure 3-1 The Conceptual Framework and Hypotheses. 3.3 Sample Process To choose sample well is important in the study. The population of this study selects financial industry, including banks, insurance, securities, and property and casualty insurance and so on. Because the Analysis of Working Employees Tiredness from Council of Labor Affairs revealed that the most tiring occupation is financial institution and insurance. It is reported that employees in these jobs were heavy workloads, time pressure, and anxiety which resulted from sales performance requirements, sample of employees in financial institutions can be used appropriately in this study. This study chooses Taiwan’s Top 100 14.
(23) financial institutions on May 7, 2008 (No. 396) by CommonWealth Magazine.. 3.4 Questionnaire Design 3.4.1 Job Stress Parker and Decotiis (1983) defined job stress has been “the feeling of a person who is required to deviate from normal or self-desired functioning in the work place as the result of opportunities, constraints, or demands relating to potentially important work-related outcomes” (p. 165). This measure was assessed with 13-item scale developed by Parker and DeCotiis (1983). The content of job stress items has two components, time stress and anxiety. Feeling of time stress included eight items. Sample items are “Too many people at my level in the company get burned out by job demands” and “I have too much work and too little time to do it in.” Job-related feelings of anxiety included five items. Sample items are “I have felt fidgety or nervous as a result of my job” and “Sometimes when I think about my job L get a tight feeling in my chest.” The literatures usually used this job scale items as overall job stress (Hunter & Thatcher, 2007; Jamal, Baba, & Riviere, 1998; Jamal, 2004) and that has good psychometric properties (Jamal & Baba, 2000; Baba, Jamal, & Tourigny, 1998). This measure is assessed in five-point Likert scale, ranging from 1 strongly disagreement with the item to 5 strongly agreement with the item. A higher score on this instrument is a higher degree of job stress. 3.4.2 Emotional Intelligence We defined emotional intelligence as individual competence to aware, regulate, and utilize emotions effectively in self and others (Salovey & Mayer, 1990, 1997; Goleman, 1995). This self-report emotional intelligence test (SREIT) was developed by Schutte et al. (1998) comprises 33 items. It is one of best-known tests and widely used in the literature (e.g., Carmeli, 2003; Ciarrochi, Deane, & Anderson, 2002). The short form questionnaire. 15.
(24) developed as the basis on Salovey and Mayer’s (1990) original model of emotional intelligence comprises 62 items. After adapting factor analysis of original 62 items, 33 items were retained which established high internal consistency (α = 0.87) and test-retest reliability (α = 0.78). The existing scales of emotional intelligence about SREIT are designed to suit to the workplace (Brackett & Mayer, 2003; Boyatzsis, Goleman, & Rhee, 2000). Petrides and Furnham (2000) argued a dimension of SREIT did not map onto original model of Salovey and Mayer (1990) which included three factors and adapted factor analytic research found four provisional factors (optimism and mood regulation, appraisal of emotions, social skills, and utilization of emotions), but they did not offered the reliability and validity of factors (Brackett & Mayer, 2003). So we adapt SREIT which is one factor to measure emotional intelligence. Sample items are “I easily recognize my emotions as I experience them (evaluation and expression of emotions)”; “when I am faced with obstacles, I remember times I faced similar obstacles and overcame them (regulation of emotions)”; “Some of the major events of my life have led me to re-evaluate what is important (utilization of emotions).” This measure were assessed in five-point scale (ranging from 1 = strongly disagreement, to 5 =. strongly. agreement). A higher score on this SREIT is a higher degree of emotional intelligence. 3.4.3 Job performance Job performance is defined the degree about which the individual effort reaches quantity and quality of missions or goals in the organization (Schermerhorn, Hunt, & Osborn, 2005; Robbins, 2005). Job performance was measured adapted by Singh et al. (1996) from Dubinsky and Mattson (1979) original scale and widely used in the literatures (e.g., Kalbers & Cenker, 2008; Fogarty et al., 2000). This self-appraisal instrument contains six items. One of six self-appraisal questions regarding compared with their coworkers, and the other is the respondent’s own performance. Sample items are “How would you rate yourself in terms of 16.
(25) the quantity of work (e.g., sales) you achieve?” and “How do you rate yourself in terms of your performance potential among coworkers in your company?” The Cronbach’s alpha of the literature for this scale was 0.8 (Singh et al., 1996). It is assessed on five-point Likert scale, ranging from 1 = poor to 5 = excellent. A higher score on this instrument is a higher job performance. For avoiding possible bias we used self-appraisal method to measure performance. The previous research used self-appraisal performance to overcome the problem of “halo-error” related to supervisory ratings (Fisher, 2001; Brownell, 1982; Nealy & Owen, 1970). Brownell (1982, p17) noted “halo-error” as the tendency to evaluate “globally” or, in other words, to evaluate on only one cognitive dimension, and a high intercorrelation among separate dimensions is evidence of halo error. Nonetheless self-appraisal performance may exist a leniency bias (Heneman, 1974) and inflate self-evaluation (Mabe & West, 1982), the accuracy of self-appraisal performance was still supported (Tuten & Neidermeyer, 2004; Farh & Werbel, 1986). Though such inflation may exist, so long as the bias is not systematic of the independent variables, the result will not be affected (Brownell & Mclnnes, 1986). Performance appraisal methods most include two approaches: comparative and absolute methods (Schermerhorn, Hunt, & Osborn, 2005). Comparative methods indicate that individual is better than another in the organization, such as method of force distribution. It used few categories which rate a specific proportion. For example, Baruch (1996) adopted this measure for self-appraisal performance, seven-point scale : 7 (very high) = among the up 5 percent; 6 = among the upper 10 percent ; 5 = among the upper 20 percent ; 4 = among the upper 30 percent ; 3 = among the upper 40 percent ; 2 = among the upper 50 percent ; 1(very low) = among the lower 50 percent (p. 65). It may happen that someone is “the best of a bad lot.” (Schermerhorn, Hunt, & Osborn, 2005, p171) Contrary to comparative methods, absolute methods have concrete measure criterions, such as a Likert scale. It allows assigning. 17.
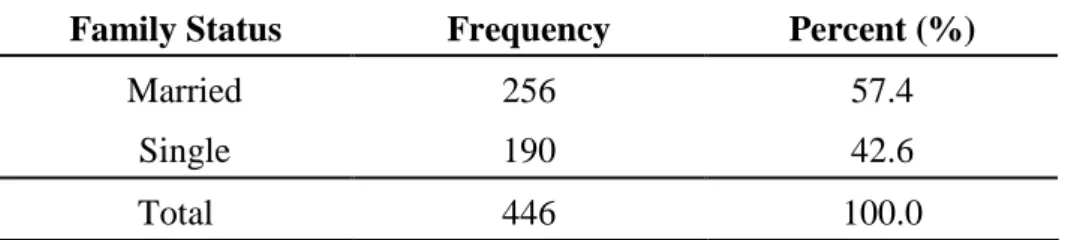
(26) the individual performance on each category. For example, Pellegrin et al., (2001) adopted 5-point Likert scale to measures patient satisfaction: 5 = excellent, 4 = very good, 3 = good, 2 = fair, 1= poor. So we use the Likert scales for self-appraisal performance. 3.4.4 Control Variables We controlled individual and organizational features that may affect our study variables, including sex dummy (1 for male, 2 for female); age, measured by the actual number of years; educational level (from 1 to 4 indicating from high school degree, certificate of graduation degree ,university degree, postgraduate degree); family status (1 for married, 2 for single); job tenure, measured by the number of years that an employee has been in his company; and job level (1 for manager, 2 for non-manager). 1. Sex (male, female) According to Analysis of Working Employees Tiredness from Council of Labor Affairs, it found female employee perceived job stress is higher than male employee. Differences between male and female respondent may be included. 2. Age Although some research indicted age and performance is not significant relationship (Richardson, 1994). But Higgs (2001) provide the evidence that older employees tend to perform more effectively than younger those. So we should take in account of age. 3. Educational Level Generally believed that educating individuals to understand and deal with job stress. But the literature indicates job stress and educational level is a negative relationship (Parker & Decotiis, 1983). We include educational level, whether the relationship is positive or negative. 4. Family Status Married people report higher level of job performance than single people (Fogarty, 1994). 18.
(27) Married people are more likely than single people to perceive more responsible on their work. Besides, Mehay and Bowman (2005) shows married men in this organization receive higher performance ratings than single men. So we include family status as a control variable. 5. Job tenure Tenure in the organization has positive impact on job performance, because employees are learning and enhance skills from their works (Schmidt & Hunter, 2004). Job tenure is associated with developing skills and an understanding of products and customers (Hunter & Thatcher, 2007). So we view job tenure as a control variable. 6. Job level The literature has found that job performance increases as the job level (Siu, 2003). This study also controls two different job level- manager and non-manager.. 3.5 Data Analysis Techniques After the questionnaires are acquired, SPSS (Statistical Package for the Social Sciences) is used to analysis data. The statistical methods are applied as below. 1. Descriptive statistics analysis An analysis transform the raw data into a form included frequency allocation and percentage for easy to understand the information of samples. 2. Reliability test A reliability test by calculating the Cronbach’s Alpha coefficients is adapted to ensure the internal consistency of variables in the questionnaire used for this study and we used Conbach’s α = 0.7 as standard to test the internal reliability. 3. Correlation analysis An analysis is used to explore the correlation among the independent variables, dependent variables, and demographic variables.. 19.
(28) 4. Hierarchical regression analysis We perform hierarchical regression analysis to measure independent variables (job stress and emotional intelligence) whether or not affect dependent variable. It has two steps. The first step is entering the control variables (sex, age, educational level, family status, job tenure, and job level) and the second step is entering the independent variables (job stress and emotional intelligence). Besides, we also use this analysis to test emotional intelligence whether or not as the moderator on the relationship between job stress and job performance. It has three steps. The first step is entering the control variables and the second step is entering the independent variables. Finally, for examining the interaction hypotheses, the interactional effect (job stress × emotional intelligence) is entered into the regression equations. 5. One-way ANOVA We use this analysis to test whether the demographic variables (sex, age, educational level, family status, job tenure, and job level) could influence job stress, emotional intelligence, and job performance.. 3.6 Pilot Test Before data collection, we conducted a pilot survey to assure clarity and reliability of the questionnaire. In other words, to ensure description of each item is understood by participators. Therefore, each item set was reduced and items modified during the piloting. Fifty questionnaires were delivered by the friends to financial institutions in South Taiwan. 42 fully completed questionnaires were returned for 84 percent return rate. The sample included 16 males and 26 females. The Cronbach’s α of completed returned questionnaires are listed in Table 3.1. The Cronbach’s α of job stress is 0.79; the Cronbach’s α of emotional intelligence is 0.907; the Cronbach’s α of job performance is 0.858. The pilot test showed reliabilities scores of 0.7 or better. It means the questionnaire is highly reliable. 20.
(29) Besides, some participators suggest modifying statement of some items on job stress. For let participators understand statement of questionnaire. After discussing with advisor, we accept some suggestions to adapt. Table 3-1 Pilot Test Reliability of Job Stress, Emotional Intelligence and Job Performance Cronbach’s α. Content Job Stress. 0.790. Emotional Intelligence. 0.907. Job Performance. 0.858. 21.
(30) Chapter Four Data Analysis and Results 4.1 Data Collection The study explores the phenomenon of the stress in Taiwanese financial industry. Top 100 financial institutions were chosen as sample. Due to limited time and resources we used convenient sampling and delivered the questionnaire through the relatives and friends. There were 10 questionnaires sent to each company and total amounted to 55 companies. The data collection was undertaken from December 2008 to February 2009. There are 550 questionnaires which were distributed to various financial companies from a convenient sampling participated in the study. A total of 498 questionnaires were returned and a response. rate is 90.54%. After data cleaning, 52 incomplete questionnaires were abolished. A total of 446 are effective samples participated in the study around Taiwan and valid retrieving rate is 81.09%. It is listed in Table 4-1. Table 4-1 Summary of Questionnaires and Response Rates Questionnaires. Number. Percentage (%). Total Valid. 550. 100% 81.09% 9.45% 90.54%. Unusable Return. 446 52 498. 4.2 Descriptive Statistics 4.2.1 Demographic Characteristics The structure of respondents includes sex, age, educational level, family status, job tenure, job level and type of office.. 22.
(31) 4.2.1.1 Sex Description This study includes 266 females (59.6%) and 180 males (40.4%). It shows that the majority of the participants are females. It is listed in Table 4-2. Table 4-2 The Description of the Respondent Sex Sex. Frequency. Percent (%). Male. 180. 40.4. Female. 266. 59.6. Total. 446. 100.0. 4.2.1.2 Age Description The respondents’ average age is 37.2 years old (S.D. 8.51). It is shown in Table 4-3. The most frequency is aged 31-40, includes 191 people (42.8%). Aged 21-30 includes 112 participators (25.1%). Aged 41-50 includes 105 participators (23.6%). Aged over 51 years old includes 36 participators (8.1%). The less frequency is under 20 years old, includes 2 people (0.4%). It is listed in Table 4-4. Table 4-3 The Description of the Respondent Age. Age. Mean. S.D.. Min. Max. 37.21. 8.509. 17. 65. Table 4-4 The Description of the Respondent Age Range Age. Frequency. Percent (%). Under 20 years old. 2. 0.4. 21 to 30 years old. 112. 25.1. 31 to 40 years old. 191. 42.8. 41 to 50 years old. 105. 23.6. Over 51 years old. 36. 8.1. Total. 446. 100. 23.
(32) 4.2.1.3 Educational level Description This study includes 46 participators with high school degree (10.3%), 137 participators with Certificate of graduation degree (30.7%), 238 participators with university degree (53.4%), 25 participators with Postgraduate degree (5.6%). It shows that the majority of the participants are university degree. It is listed in Table 4-5. Table 4-5 The Description of the Respondent Educational level Educational Level. Frequency. Percent (%). High school. 46. 10.3. Certificate of graduation. 137. 30.7. University degree. 238. 53.4. Postgraduate degree. 25. 5.6. 446. 100.0. Total 4.2.1.4 Family Status Description. This study includes 256 participators with married (57.4%) and 190 males (42.6%). It shows that the majority of the participants are married. It is listed in Table 4-6. Table 4-6 The Description of the Respondent Family Status Family Status. Frequency. Percent (%). Married. 256. 57.4. Single. 190. 42.6. Total. 446. 100.0. 4.2.1.5 Job Tenure Description The respondents’ average tenures in their present organization are 8.99 (S.D. = 7.39). It is listed in Table 4-7. The most frequency is 2 to 5 years, includes 146 people (32.73%). 10 to 13 years of job tenures includes 83 participators (18.61%). 6 to 9 years of job tenures includes 61 participators (13.68%). Under 1 year of job tenures includes 47 participators (10.54%). 14 to 17 years of job tenures includes 42 participators (9.42%). 18 to 21 years of 24.
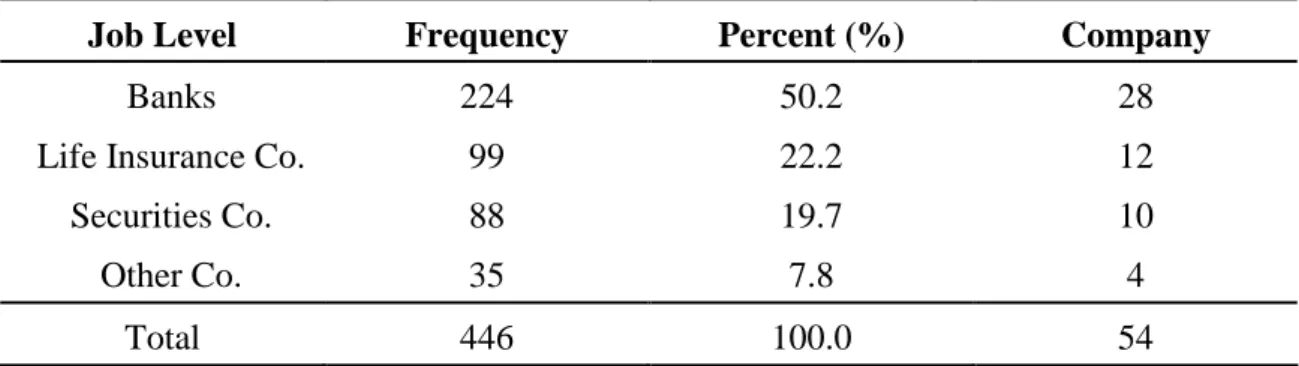
(33) job tenures includes 41 participators (9.19%). Over 22 years of job tenures includes 26 participators (5.83%). It is listed in Table 4-8. Table 4-7 The Description of the Respondent Job Tenure Mean. S.D.. Min. Max. 8.99. 7.288. 0.08. 37. Job Tenure. Table 4-8 The Description of the Respondent Job Tenure Range Job Tenure. Frequency. Percent (%). Under 1 year. 47. 10.54. 2 to 5 years. 146. 32.73. 6 to 9 years. 61. 13.68. 10 to 13 years. 83. 18.61. 14 to 17 years. 42. 9.42. 18 to 21 years. 41. 9.19. Over 22 years. 26. 5.83. 446. 100.0. Total 4.2.1.6 Job Level Description. This study includes 104 manager (23.3%) and 342 non-manager (76.7%). It shows that the majority of the participants are non-manager. It is listed in Table 4-9. Table 4-9 The Description of the Respondent Job Level Job Level. Frequency. Percent (%). Manager. 104. 23.3. Non-Manager. 342. 76.7. Total. 446. 100.0. 4.2.1.7 Type of Office Description This study includes 224 participators worked in banks (50.2%), 99 participators worked in life insurance companies (22.2%), 88 participators worked in securities companies (19.8%), and 88 participators worked in other organizations (such as property and casualty insurance 25.
(34) Co.) . It shows that the majority of the participants work in bank. It is listed in Table 4-10. Table 4-10 The Description of the Respondent Type of Office Job Level. Frequency. Percent (%). Company. Banks. 224. 50.2. 28. Life Insurance Co.. 99. 22.2. 12. Securities Co.. 88. 19.7. 10. Other Co.. 35. 7.8. 4. Total. 446. 100.0. 54. 4.2.2 Variable Characteristics This study measures job stress, emotional intelligence and job performance. The description of questionnaire as follow could understand the level of job stress, emotional intelligence and job performance of participators. 4.2.2.1 Job Stress The mean and standard deviation of job stress questions are listed in Table 4-11. The mean of job stress is 2.94 (S.D. = 0.56). The mean of thirteen questions of job stress ranges between 2.43 and 3.36. The numbers are within one standard deviation to average (2.38 ~ 3.5). The high score items are “I have felt fidgety or nervous as a result of my job” (M = 3.36, S.D. = 0.925), “My job gets to me more than it should” (M = 3.35, S.D. = 0.809), and “I frequently get the feeling I am married to the company” (M = 3.32, S.D. = 0.854). The low score items are “I sometimes dread the telephone ringing at home because the call might be job-related” (M = 2.43, S.D. = 0.973), “I feel like I never have a day off” (M = 2.58, S.D. = 0.905), and “There are lots of times when my job drives me right up the wall” (M = 2.67, S.D. = 0.896). 4.2.2.2 Emotional Intelligence The mean and standard deviation of Emotional Intelligence questions are shown in Table 26.
(35) 4-12. The mean of Emotional Intelligence is 3.74 (S.D. = 0.4). That shows bank employees could have the better ability to control self emotions. The mean of thirty-three questions of emotional Intelligence ranges between 3.43 and 4. The numbers locate within one negative and positive standard deviation to average (3.34 ~ 4.14). The high score items are “Emotions are one of the things that make my life worth living” (M = 4, S.D. = 0.695), “I compliment others when they have done something well” (M = 4, S.D. = 0.670), and “I expect good thing to happen” (M = 3.93, S.D. = 0.796). The low score items are “When I am faced with a challenge, I give up because I believe I will fail” (M = 3.43, S.D. = 0.692), “I know what other people are feeling just by looking at them” (M = 3.43, S.D. = 0.676), and “I know when to speak about my personal problems to others.” (M = 3.49, S.D. = 0.772) 4.2.2.3 Job Performance The mean and standard deviation of job performance questions are shown in Table 4-13. The mean of job performance is 3.42 (S.D. = 0.52). The mean of six questions of job performance ranges between 3.33 and 4. The numbers locate within one negative and positive standard deviation to average (2.9 ~ 3.94). The high score items are “How do you rate yourself in terms of quality of your performance in regard to customer relations?” (M = 3.61, S.D. = 0.674), “How do you rate yourself in terms of quality of your performance in regard to knowledge of your products, company, competitors' products, and customer needs?” (M = 3.42, S.D. = 0.665), and “How do you rate yourself in terms of your ability to reach your goals?” (M = 3.4, S.D. = 0.672). The low score items are “How do you rate yourself in terms of quality of your performance in regard to management of time, planning ability, and management of expenses?” (M = 3.33, S.D. = 0.684), “How would you rate yourself in terms of the quantity of work (e.g., sales) you achieve?” (M = 3.37, S.D. = 0.699), and “How do you rate yourself in terms of your performance potential among coworkers in your company?” (M = 3.37, S.D. = 0.707).. 27.
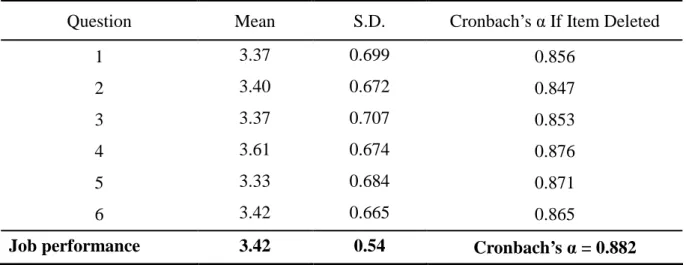
(36) 4.3 Reliability Reliability means accuracy of measurement questionnaire. This research tests reliability analysis to confirm the internal consistency. Using Cronbach’s coefficient alpha measures reliability of the three scales. The higher the coefficient of Cronbach’s α is, the higher the internal consistency is. For the reliability analysis done by this research, the Cronbach’s α of job stress is 0.851. The result is shown in Table 4-11. Although deleted item 8 of job stress could raise reliability, in order to as much information as possible to display, the study keep this item. The Cronbach’s α of job performance is 0.882. The result is listed in Table 4-12. The coefficient of six items Cronbach’s α if item deleted range from 0.847 to 0.876, so there did not need to cancel any items. From Table 4-13 we found that the Cronbach’s α of emotional intelligence is 0.942. Deleting anyone of thirty three emotional intelligence items could not raise the level of reliability, so we did not need to cancel any items. Thus, all scales are found over the 0.7 reliability level as a minimum level for acceptable reliability, which means the study is highly reliable and trustworthy.. 28.
(37) Table 4-11 Characteristics and Reliability of Job Stress Question. Mean. S.D.. Cronbach’s α If Item Deleted. 1. 3.36. 0.925. 0.838. 2. 3.09. 1.013. 0.837. 3. 3.35. 0.809. 0.844. 4. 2.81. 0.966. 0.839. 5. 2.67. 0.896. 0.837. 6. 3.02. 0.971. 0.832. 7. 2.77. 0.888. 0.836. 8. 3.32. 0.854. 0.872. 9. 2.89. 0.880. 0.838. 10. 2.88. 0.902. 0.839. 11. 2.43. 0.973. 0.840. 12. 2.58. 0.905. 0.837. 13. 3.16. 0.840. 0.836. Job Stress. 2.94. 0.56. Cronbach’s α = 0.851. Table 4-12 Characteristics and Reliability of Job Performance Question. Mean. S.D.. Cronbach’s α If Item Deleted. 1. 3.37. 0.699. 0.856. 2. 3.40. 0.672. 0.847. 3. 3.37. 0.707. 0.853. 4. 3.61. 0.674. 0.876. 5. 3.33. 0.684. 0.871. 6. 3.42. 0.665. 0.865. 3.42. 0.54. Cronbach’s α = 0.882. Job performance. 29.
(38) Table 4-13 Characteristics and Reliability of Emotional Intelligence Question. Mean. S.D.. Cronbach’s α If Item Deleted. 1 2 3 4 5 6 7 8 9 10 11 12 13 14 15 16 17 18 19 20 21 22 23 24 25 26 27 28 29 30 31 32 33. 3.49 3.75 3.92 3.76 3.48 3.78 3.85 4 3.83 3.93 3.72 3.69 3.67 3.8 3.65 3.83 3,.87 3.75 3.80 3.75 3.50 3.74 3.81 4.00 3.63 3.88 3.54 3.43 3.43 3.76 3.69 3.66 3.68. 0.772 0.646 0.634 0.661 0.699 0.675 0.659 0.695 0.673 0.796 0.754 0.669 0.667 0.689 0.68 0.634 0.706 0.664 0.625 0.668 0.734 0.608 0.670 0.670 0.650 0.623 0.704 0.692 0.676 0.625 0.670 0.674 0.649. 0.942 0.941 0.941 0.941 0.941 0.941 0.940 0.940 0.941 0.941 0.941 0.940 0.941 0.940 0.940 0.940 0.940 0.940 0.941 0.940 0.942 0.940 0.940 0.941 0.940 0.940 0.940 0.941 0.940 0.941 0.941 0.941 0.940. Emotional Intelligence. 3.74. 0.4. Cronbach’s α = 0.942. 30.
(39) 4.4 The Influence of Demographic Variables on the Constructs 4.4.1 The Influence of Demographic Variables on Job Stress The one–way ANOVA is conducted to find the relationship between demographic variables and job stress. At the 0.05 level of significance, Table 4-14 indicates that significant differences are found between all demographic variables and job stress (p < 0.05). By Independent-Sample T test, we can know that male feels high level of job stress than females, single employees feel high level of job stress than married employees, and managers feel high level of job stress than non-managers. By LSD Post Hoc Tests, we can know that employees who are 21 to 30 years old feel more job stress than who are over 41 years old; employees who have university degree feel more job stress than who have high school and certificate of graduation, employees who have postgraduate degree feel more job stress than who have high school and certificate of graduation; employees who are under 5-year tenure feel more job stress than who are over 14-year tenure, and employees who are under 1-year tenure feel more job stress than who are 6 to 13 year tenure.. 31.
(40) Table 4-14 The Influence of Demographic Variables on Job Stress Demographic Source Variables Sex. Age. Educational Level Family Status. Job tenure. Job Level. Sum of df Squares. Mean. F. Sig.. LSD. 4.182. 0.041. 1>2. 2.721. 0.029. 2>4,5. 5.967. 0.001. 3>1,2 4>1,2. 5.678. 0.018. 2>1. 4.306. 0.000. 1>3,4,5,6,7 2>5,6,7. 13.279. 0.000. 2>1. Square. Between Groups. 1.283. 1 1.283. Within Groups. 136.218. 444 0.307. Total. 137.501. 445. Between Groups. 3.312. 4 0.828. Within Groups. 134.189. 441 0.304. Total. 137.501. 445. Between Groups. 5.352. 3 1.784. Within Groups. 132.149. 442 0.299. Total. 137.501. 445. Between Groups. 1.736. 1 1.736. Within Groups. 135.765. 444 0.306. Total. 137.501. 445. Between Groups. 7.642. 6 1.274. Within Groups. 129.860. 439 0.296. Total. 137.501. 445. Between Groups. 3.993. 1 3.993. Within Groups. 133.508. 444 0.301. Total 137.501 445 Note: Sex, age, educational level, family status, job tenure and job level are dummy variables with 1 equal to “male”, “Under 20 years old”, “high school graduate”, “married”, “Under 1 year”, and “manager”, respectively. 4.4.2 The Influence of Demographic Variables on Emotional Intelligence Through the one-way ANOVA, at the 0.05 level of significance Table 4-15 indicates that only job tenure is not significant differences with emotional intelligence (p > 0.05). By Independent-Sample T test, we can know that males feel themselves more emotional intelligence than females, married employees feel themselves more emotional intelligence than single employees, and managers feel themselves more emotional intelligence than non-managers. By LSD Post Hoc Tests, we can know that employees who are over 41 years old feel themselves more emotional intelligence than who are 21 to 30 years old; employees. 32.
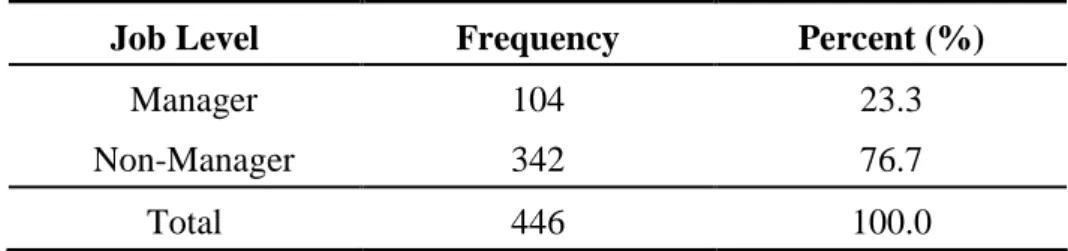
(41) who have postgraduate degree feel themselves more emotional intelligence than who have certificate of graduation and university degree. Table 4-15 The Influence of Demographic Variables on Emotional Intelligence Demographic Source. Sum of. Variables. Squares. Sex. Age. Educational Level Family Status. Job tenure. Job Level. df. Mean. F. Sig.. LSD. Square. Between Groups. 1.321. 1. 1.321. Within Groups. 69.924. 444 0.157. Total. 71.245. 445. Between Groups. 1.465. 3. Within Groups. 69.780. 442 0.158. Total. 71.245. 445. Between Groups. 1.704. 3. Within Groups. 69.541. 442 0.157. Total. 71.245. 445. Between Groups. 0.808. 1. Within Groups. 70.436. 444 0.159. Total. 71.245. 445. Between Groups. 0.038. 3. Within Groups. 71.206. 442 0.161. Total. 71.245. 445. Between Groups. 3.409. 1. Within Groups. 67.836. 444 0.153. 0.488. 0.568. 0.808. 0.013. 3.409. 8.388. 0.004. 3.093. 0.027. 1>2. 4>2 5>2. 3.610. 0.013. 4>2 4>3. 5.096. 0.024. 0.079. 0.971. 22.314 0.000. 1>2. 1>2. Total 71.245 445 Note: Sex, age, educational level, family status, job tenure and job level are dummy variables with 1 equal to “male”, “Under 20 years old”, “high school graduate”, “married”, “Under 1 year”, and “manager”, respectively. 4.4.3 The Influence of Demographic Variables on Job Performance At the 0.05 level of significance, Table 4-16 indicates that significant differences are found between all demographic variables and job performance (p < 0.01). By Independent-Sample T test, we can know that males feel more job performance than females; married employees feel more job performance than single employees; manager feel more job performance than non-manager. 33.
(42) By LSD Post Hoc Tests, we can know that employees who are over 21 years old feel more job performance than who are under 20 years old, employees who are over 31 years old feel more job performance than who are 21 to 30 years old; employees who have postgraduate degree feel more job performance than who have high school, certificate of graduation, and university degree; employees who are over 2-year tenure feel more job performance than who are under 1-year tenure, employees who are 18 to 21-year tenure feel more job performance than who are 2 to 5-year tenure. Table 4-16 The Influence of Demographic Variables on Job Performance Demographic Source. Sum of. Variables. Squares. Sex. Age. Educational Level Family Status. Job tenure. Job Level. df. Mean. F. Sig.. LSD. Square. Between Groups. 4.279. 1. 4.279. Within Groups. 126.429. 444. 0.285. Total. 130.708. 445. Between Groups. 4.301. 3. 1.434. Within Groups. 126.407. 442. 0.286. Total. 130.708. 445. Between Groups. 4.615. 3. 1.538. Within Groups. 126.094. 442. 0.285. Total. 130.708. 445. Between Groups. 3.335. 1. Within Groups. 127.373. 444. 3.335. Total. 130.708. 445. 0.287. Between Groups. 7.305. 3. 2.435. Within Groups. 123.403. 442. 0.279. Total. 130.708. 445. Between Groups. 3.971. 1. 3.971. Within Groups. 126.738. 444. 0.285. 15.027 0.000. 5.013 0.002. 5.392. 0.01. 11.625. 0.001. 1>2 2,3,4,5>1 3,4,5>2. 4>1,2,3. 1>2. 8.722 0.000 2,3,4,5,6,7,>1 6>2 13.910 0.000. 1>2. Total 130.708 445 Note: Sex, age, educational level, family status, job tenure and job level are dummy variables with 1 equal to “male”, “Under 20 years old”, “high school graduate”, “married”, “Under 1 year”, and “manager”, respectively.. 34.
(43) 4.5 Correlation Analysis Table 4-17 describes Pearson correlation coefficients of job performance, job stress, emotional intelligence, and demographic variables, such as age and job tenure. This table shows several variables are related, but it indicates no problems of multicolinearity since the value of correlation are less than 0.6. 4.5.1 Job Stress There are no significant correlations are found between job stress and job performance (γ = 0.05, p > 0.05). Additionally, Pearson correlation coefficients also revealed employees’ age (γ = -0.18, p < 0.001), job tenure (γ = -0.22, p < 0.001) are negative correlation to job stress. 4.5.2 Emotional Intelligence The value of correlation indicates that emotional intelligence is a significant and positive relationship with job performance (γ = 0.5, p < 0.001). Furthermore, regarding emotional intelligence, it shows that age (γ = 0.13, p < 0.01) is positive correlation to emotional intelligence. Nevertheless, job tenure is not correlation with emotional intelligence. 4.5.3 Job Performance As Regards the relationship between job performance and demographic variables is concerned. There are a positive relationship is found between the employees’ age (γ = 0.19, p < 0.001) and job tenure (γ = 0.16, p < 0.001) and job performance.. 35.
(44) Table 4-17 Correlations variable. Job performance. Job performance. 1.00. Job stress. 0.05. Emotional intelligence. 0.50***. Age. 0.19***. a. Job stress. Emotional. Age. intelligence. 0.02 - 0.18***. 0.13**. 0.16*** - 0.22*** 0.03 0.71*** Job tenure a Note: Two-tailed tests; *p<0.05, **p<0.01, ***p<0.001 n = 446 employees. Job tenure in the organization is reported in years.. 4.6 Hierarchical Regression Analysis This research uses hierarchical regression analysis to test the relationship of job stress, emotional intelligence, and job performance by using SPSS statistical software. Through hierarchical regression analysis let us understand the independent variables and interaction prediction of multiple variables to dependent variable. 4.6.1 Job Stress and Job Performance Using hierarchical regression analysis evaluates the linear relationship between a job stress and job performance under controlling demographic variables. Model 1 displays the results of the coefficient of control variables to job performance. It shows that sex (β = 0.128, p < 0.01), Educational level (β = 0.15, p < 0.01), and job level (β = 0.099, p < 0.05) are significantly positive to job performance. Model 2 adds job stress to estimate job performance. Table 4-18 lists the result of correlation of hierarchical regression analysis between job stress and job performance that job stress is statistically unrelated to job 2. 2. performance (β = 0.076, p > 0.05). The significantly small adjust R (adjust R = 0.005) should be also considered the possibility of a lack of fit. H1 is not supported. Job stress does not predict the change in performance on linear regression.. 36.
(45) In order to find the relationship between job stress and job performance, non-linear regression is used. But non-linear regression model is U-shaped showing that low and high level of job stress led to higher job performance (β2 = 0.2848, F = 17.27, p < 0.001). The result is not consistent with phenomenon, so we do not consider it. Table 4-18 Results of Regression Analysis between Job Stress and Job Performance Job performance Model 1 Step 1: Sex. Model 2. 0.128**. 0.121*. Age. 0.089. 0.091. Educational level. 0.150**. 0.138**. Family status. 0.081. 0.081. Job tenure. 0.080. 0.090. job level. 0.099*. 0.112*. 0.103. 0.076 0.108. 0.103. 0.005. 8.385***. 7.576***. Step 2: Job stress (JS) 2. R △R 2 F. Notes : *p<0.05, **p<0.01, ***p<0.001 However, according to Parker and Decotiis (1983) who separated job stress into time stress and anxiety, Table 4-19 shows that the relationship between time stress and job performance is significantly positive (β = 0.27, p < 0.001). In addition, anxiety is significantly negative to job performance (β = - 0.205, p < 0.01). The significantly adjust R 2. (adjust R = 0.031) should be also consider fitness of the model.. 37. 2.
(46) Table 4-19 Results of Regression Analysis between Sub-factors of Job Stress and Job Performance Job performance Model 1 Step 1: Sex. Model 2. 0.128**. 0.115*. Age. 0.089. 0.102. Educational level. 0.150**. 0.125**. Family status. 0.081. 0.074. Job tenure. 0.080. 0.066. job level. 0.099*. 0.096*. Step 2: Time Stress. 0.270***. Anxiety 2. R △R 2 F. 0.103. - 0.205** 0.134. 0.103. 0.031. 8.385***. 8.436***. Notes : *p<0.05, **p<0.01, ***p<0.001 4.6.2 Emotional Intelligence and Job Performance Table 4-20 tests hypothesis 2. Model 1 displays results of the coefficient of control variables to job performance. Model 2 adds emotional intelligence to estimate job performance. Result consists with H2: emotional intelligence is related positively and significantly to job performance (β = 0.48, p < 0.001). This result suggests that an increase one unit of employee emotional intelligence reflected 0.48 units of job performance under 2. 2. other variable fixed. A significantly large adjust R (adjust R = 0.212) indicates a good fit of the simple linear regression model. The model could explain 31.5% of the variation of 2. self-rating job performance. (R = 0.315). 38.
(47) Table 4-20 Results of Regression Analysis between Emotional Intelligence and Job Performance Job performance Model 1 Step 1: Sex. Model 2. 0.128**. 0.083*. Age. 0.089. 0.017. Educational level. 0.150**. 0.169***. Family status. 0.081. 0.055. Job tenure. 0.080. 0.152**. job level. 0.099*. 0.003. 0.103. 0.480*** 0.315. 0.103. 0.212. Step 2: Emotional Intelligence (EI) R2 △R 2 F. 8.385***. 28.781***. Notes : *p<0.05, **p<0.01, ***p<0.001 4.6.3 Emotional Intelligence as the Moderator Table 4-21 reports hierarchical regression coefficients with emotional intelligence as the moderator. Model 1 displays results of the coefficient of control variables to job performance. Model 2 adds job stress and emotional intelligence to estimate job performance. It also indicates the ability of emotional intelligence to explain job performance. The coefficient of emotional intelligence is significantly positive to job performance (β = 0.477, p < 0.001). To test the moderating effects of emotional intelligence on the relationship between job stress and job performance while controlling gender, age, educational level, family status, job tenure and job level. H3, which states that the higher individual emotional intelligence, the weaker negative relationship between job stress and job performance is supported. As shown in model 3, adding the interaction term of job stress and emotional intelligence result in a. 39.
(48) statistically significant increase in R2 = 1.9 % and F-ratio =24.469 at the 0.05 level of significance. The interaction of job stress and emotional intelligence is related positively and significantly to job performance (β = 1.126, p < 0.001). Table 4-21 Results of the Moderating Role of Emotional Intelligence (EI) Job performance Model 1 Step 1: Sex. Model 2. Model 3. 0.128**. 0.079. 0.077. Age. 0.089. 0.018. 0.016. Educational level. 0.150**. 0.161***. 0.155***. Family status. 0.081. 0.055. 0.048. Job tenure. 0.080. 0.158**. 0.141*. job level. 0.099*. 0.011. 0.023. Step 2: Job stress (JS) Emotional intelligence (EI) Step 3: JS * EI R2 △R2 F. 0.046 0.477***. 0.103 0.103. 0.317 0.214. 8.385***. 25.349***. - 0.929*** - 0.051 1.126*** 0.336 0.019 24.469***. Notes : *p<0.05, **p<0.01, ***p<0.001. Following Cohen and Cohen (1983) plot the regression of job performance on job stress at high and low emotional intelligence, the cut values for two levels are plus and minus one standard deviation from the mean. We illustrate the result presented in model 3 with Figure 4-1 that the plot of the interaction of job stress and emotional intelligence in job performance. On the high emotional intelligence, the mean of job performance on high job stress is 4.289 and the mean of job performance on low job stress is 4.125. On the low emotional intelligence, the mean of job performance on high job stress is 2.976 and the mean of job performance on low job stress is 3.444. At a level of emotional intelligence one standard 40.
(49) deviation above the sample mean, the line is positive. At the one standard deviation below the sample mean for emotional intelligence, the stress-performance slope is negative. Thus EI is a better moderator of the relationship between job stress and job performance. 4.5 4.289. 4.125. Job Performance. 4 3.5. 3.444 2.976. 3. -─. 2.5 2. Low. High EI Low EI. High. Job Stress. Figure 4-1. The Moderating Effect of Emotional Intelligence (EI). 4.7 Discussion This study examines the impact of emotional intelligence on job stress and job performance by investigating financial insurance employees in Taiwan. The result of hypotheses tests are summarized in Table 4-22. The hypothesis 1 results indicate that job stress is unrelated to job performance. Further we separate job stress into two dimensions-time pressure and anxiety. This study shows that under high level of time stress could increase job performance of employees, but under high level of anxiety would decrease job performance of employees. The hypothesis 2 shows that emotional intelligence is positive to job performance, In other words, higher emotional intelligence employees than lower emotional intelligence employees may have higher job performance. The finding also indicates that emotional intelligence is an importance predictor of job performance. According to our study emotional intelligence is necessary to facilitate performance in financial industry. 41.
數據

+7

相關文件
[r]
Lecture 1: Introduction and overview of supergravity Lecture 2: Conditions for unbroken supersymmetry Lecture 3: BPS black holes and branes. Lecture 4: The LLM bubbling
Lecture 1: Introduction and overview of supergravity Lecture 2: Conditions for unbroken supersymmetry Lecture 3: BPS black holes and branes.. Lecture 4: The LLM bubbling
Taking second-order cone optimization and complementarity problems for example, there have proposed many ef- fective solution methods, including the interior point methods [1, 2, 3,
[r]
A Boolean function described by an algebraic expression consists of binary variables, the constant 0 and 1, and the logic operation symbols.. For a given value of the binary
y A stochastic process is a collection of "similar" random variables ordered over time.. variables ordered
(1) Formation of event organizational structure (2) Event management. (3) Event promotion (4) Event production
