行政院國家科學委員會補助專題研究計畫成果報告
※※※※※※※※※※※※※※※※※※※※※※※※※
※ ※
※
霧社水庫集水區的螞蟻多樣性結構與功能研究(I) ※
※
※
※※※※※※※※※※※※※※※※※※※※※※※※※
計畫類別:■個別型計畫
□整合型計畫
計畫編號:NSC89-2621-Z-002-075-
執行期間:89 年 8 月 1 日至 90 年 7 月 31 日
計畫主持人:洪淑彬
共同主持人:李後晶
本成果報告包括以下應繳交之附件:
□赴國外出差或研習心得報告一份
□赴大陸地區出差或研習心得報告一份
□出席國際學術會議心得報告及發表之論文各一份
□國際合作研究計畫國外研究報告書一份
執行單位:國立台灣大學昆蟲學系
中
華
民
國九十年
十
月
卅一
日
行政院國家科學委員會專題研究計畫成果報告
霧社水庫集水區的螞蟻多樣性結構與功能研究(I)
Study on the str uctur e and function of ant community in Wushe
Dam ar ea (I)
計畫編號:NSC89-2621-Z-002-075-
執行期限:89 年 8 月 1 日至 90 年 7 月 31 日
主持人:洪淑彬
共同主持人:李後晶 國立臺灣大學昆蟲學系
一、中文摘要 螞蟻分佈於廣泛的棲所中且在各種生 態系中扮演不同的生態功能角色,因此螞 蟻群聚常被用來作為評估不同生態系的環 境狀況和管理措施的生物指標。我們假設 螞蟻群聚在我們研究地區的不同生態系 中,因環境因子、土壤狀況、人為干擾和 管理措施而有顯著不同,且螞蟻能對廣大 範圍的變動提供良好評估,因此有潛力成 為不同生態系生物多樣性現況與變動的良 好生物指標。為評估此種功能,我們嚐試 尋找對各種生物多樣性改變敏感的螞蟻類 群,建立螞蟻種豐度、種歧異度和種組成 與環境因子、植生結構和土壤動物的相關 關係,並建立以螞蟻為中心的食物網,以 瞭解螞蟻的生態功能。 選擇高海拔之翠峰至鳶峰一帶設一試 驗區,區內選擇草生地、次生林、原始林、 廢耕地等不同生態系,每月調查螞蟻相之 組成,由草生地、原始林、次生林、廢耕 地之螞蟻組成來比較不同生態系之生物歧 異度變異;由次生林、原始林之螞蟻組成 調查則可瞭解演替過程之歧異度變動;透 過原始林與草生地螞蟻相比較則可釐清人 為活動對螞蟻歧異度之干擾;而進行廢耕 地、次生林與原始林之螞蟻相比較則可量 化及評估人為操作對生物多樣性之作用, 進而作為生物多樣性維護與復育之參考。 本研究探明螞蟻的種類及組成,優勢 種週年數量變動,空間分佈變化及其生物 歧異度之變動,並建立不同生態系、不同 演替階段、不同管理措施或人為干擾之螞 蟻群聚時空分佈與動態與其他植生分佈之 相關性,並評估螞蟻作為生態系品質與保 育管理措施等生物指標的可行性。 關鍵詞:螞蟻,蟻科,生物指標,生物多 樣性 AbstractAnt species distributed over a wide range of habitats and played many different ecological function roles in varied
ecosystems. Therefore, ant species assemblages have been used as biological indicators of environmental condition and management practices in many different ecosystems. We hypothesize that assemblages of ant species in different ecosystems of our study area will show significant differences depending on
environmental factors, soil condition, human perturbations, and management practices. In addition, they are capable of providing an assessment over a wide range of stresses. So, they may have potential as a biological indicator of biodiversity condition in many different ecosystems in our study area. To assess this hypothesis, we try to find the group of ants that are sensitive to provide early warning for changes of biodiversity in the ecosystem. Associations between ant species, and environmental conditions and vegetative structure will be analyzed first. Trophic webs in different ecosystems will be constructed then, to clarify plant-ant-soil arthropod interrelationship.
One high-latitude area was chosen as research area. In this area, ant fauna will be surveyed every month in various ecosystems of grassland, secondary forest, virgin forest, and stop-cultivated land. From the
comparison of ant composition in grassland, virgin forest and secondary forest, we can understand the change patterns of
biodiversity in different ecosystems. However, the biodiversity changes in succession process can be revealed by the comparison between ant composition in secondary and virgin forest. By comparing the ant fauna among virgin forest and grassland, we will understand the interference of human activity on the
biodiversity. In addition, quantification and evaluation of human manipulation on the impact of biodiversity will also obtained by comparing the ant fauna among
stop-cultivated land, secondary forest and virgin forest. This result can serve as a reference for the future work on the maintenance and recovery of biodiversity.
In this study, we unveil the ant fauna, the population fluctuation of the dominant species, the changes of spatial distribution and biodiversity. In addition, we will analyze the relationships among soil types, environmental factors and ant community in various ecosystems. Furthermore, we can evaluated the suitability of using ant as a biological indicator of ecosystem quality and conservation managing tactics judging from the relationships of ant community's time and spatial distribution and plant community and established from various ecosystems,
succession stages, managing tactics or human interference.
Keywords: ants, Formicidae, biological
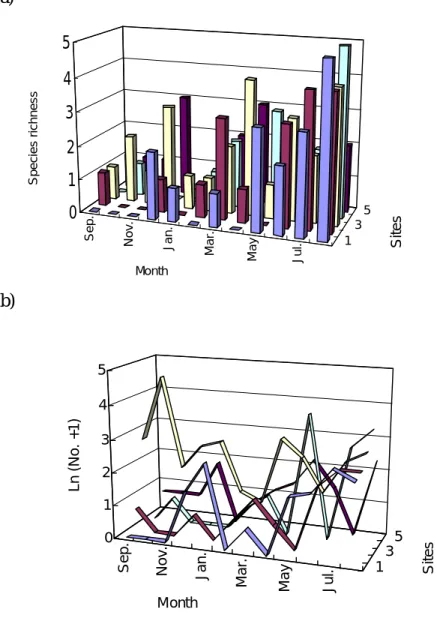
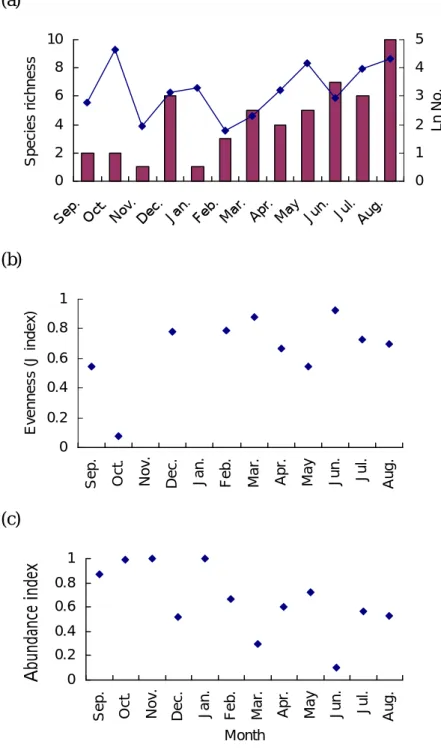
indicator, biodiversity 二、緣由與目的 本研究目的在探討霧社水庫集水區螞 蟻群聚之組成與生態功能,以瞭解不同生 態系之生物多樣性狀況,釐清人為活動對 生物多樣性之干擾,及評估人為操作對生 物多樣性的維護與復育之作用;並藉由不 同生態系中螞蟻之生物多樣性與環境因子 及植物分佈型之相關性分析,來評估以螞 蟻群聚作為生物指標以評估生態系品質之 可行性。 選擇高海拔之翠峰至鳶峰一帶設一試 驗區,區內選擇草生地、次生林、原始林、 廢耕地等不同生態系,每月調查螞蟻相之 組成,由草生地、原始林、次生林、廢耕 地之螞蟻組成來比較不同生態系之生物歧 異度變異;由次生林、原始林之螞蟻組成 調查則可瞭解演替過程之歧異度變動;透 過原始林與草生地螞蟻相比較則可釐清人 為活動對螞蟻歧異度之干擾;而進行廢耕 地、次生林與原始林之螞蟻相比較則可量 化及評估人為操作對生物多樣性之作用, 進而作為生物多樣性維護與復育之參考。 三、結果與討論 從 2000 年九月至 2001 年八月每月一 次之採樣調查結果顯示,在本試驗區共計 採集到三亞科八屬十四種的螞蟻(附錄)。其 中以黃腳黃蟻(Paratrechina flavipes)數量 最多,佔總個體數(n=431)之 71%,五個不 同的樣區皆有分布。而在種分布的均勻度 上,全區之均勻度指數為 0.47,表示在此 區中蟻相分布並不均勻(Fig.1)。 (一) 不同生態系螞蟻種類及組成 各生態系全年的螞蟻種的豐度,以五 年廢耕地全年所採集到的螞蟻種類數八種 最多;而二年廢耕地和瑞岩溪自然保護區 次之,皆為七種;二十年次生林地螞蟻的 種類數少,僅有四種;原始林區有五種的 採集記錄。就個體數而言,則以二十年次 生林地採集到的數量最多(n=222),原始林 次之,種類數較多的五年廢耕地、二年廢 耕地及瑞岩溪自然保護區數量較少(n=35, 34, 51) (Fig. 2a)。 在種的均勻度上,以二年廢耕地 0.706 最高;二十年次生林地最低(0.22);其餘五 年廢耕地原始林及瑞岩溪自然保護區之均 勻度分別為 0.62、0.36 及 0.48(Fig. 2b)。 以整個試驗區分布最廣、採樣數最多 之黃腳黃蟻,所佔比例作為豐量指標的結 果發現,的十年次生林地、原始林及二年 廢耕地等三個生態系黃腳黃蟻的比例皆高 於 50%,其值依序為 0.87、0.82 及 0.55。 而五年廢耕地及瑞岩溪自然保護區二地黃
腳 黃 蟻 的 比 例 分 別 為 0.11 和 0.15(Fig. 2c),並非數量最多的種類。在五年廢耕地 的採集記錄中,以荷氏黃蟻(P. kraepelin) 所佔的比例最高(0.4, n=35),其次為黑褐毛 山蟻(Lasiu talpa)(0.34);而瑞岩溪自然保護 區 則 以 擬 態 長 腳 家 蟻 (Aphaenogaster minulus)的比例最高(0.53)。 (二) 螞蟻種類及組成之週年動態 全年的螞蟻種的豐度變動以八月所採 集到的螞蟻種類數十種最多,而個體數則 以十月最高(104);一月及十一月皆只有黃 腳黃蟻一種;二月採集到的個體數最少, 僅有六隻、三種。就均勻度而言,則以十 月最低(0.08),黃腳黃蟻的豐量指數以十月 最高 (Fig. 3)。 四、計畫成果自評 (一) 蒐集不同生態系、演替相採樣調查所 得之螞蟻群聚資料,俾便瞭解霧社水庫集 水區各生態系中螞蟻群聚之組成、結構與 功能。 (二) 自不同耕作方式形成之農業生態系與 自然生態系中,採樣取得螞蟻群聚資料, 以瞭解人為干擾對生物多樣性之影響。 (三) 於不同栽培作物或耕作方式之墾植區 採集螞蟻群聚之資料,以便發展與評估廢 耕農地復育管理之策略。 五、參考文獻 林宗岐。1998。台灣產家蟻亞科(膜翅目: 蟻科)系統分類學與動物地理學研究。國立 台灣大學植物病蟲害學研究所博士論文。 748 頁。 蔡偉皇。1998。台灣產顎針蟻屬、鋸針蟻 屬及細顎針蟻屬(膜翅目:蟻科)之分類學研 究。國立台灣大學植物病蟲害學研究所碩 士論文。89 頁。
Andersen, A. 1988. Dispersal distance as a
benefit of myrmecochory. Oecologia 75: 507-511.
Bolton. 1995. A New General Catalogue of the Ants of the World. Harvard University Press, Cambridge, Mass. 504 pp.
Cairns, J., and J. R. Pratt. 1993. A history of biological monitoring using benthic macroinvertebrates, pp. 10-27. In: Rosemberg, D. M., and V.
H. Resh, eds. Freshwater
Biomonitoring and Benthic
Macroinvertebrates. Chapman & Hall, New York.
Chesson, P. L. 1985. Coexistence of competitors in spatially and temporally varying environments: a look at the combined effects of different sorts of variability. Theor. Popul. Biol. 28: 263-287.
Hanzawa, F. M., A. J. Beattie, and C. C. Culver. 1988. Directed dispersal: demographic analysis of ant-seed mutualism. Am. Nat. 131: 1-13. Holloway, J. D., and N. E. Stork. 1991. The
dimensions of biodiversity: the use of invertebrates as indicators of human impact, pp. 37-61. In:
Hawksworth, D. L., ed. The
Biodiversity of Microorganisms and Invertebrates: Its Role in Sustainable Agriculture. CAB International. Wallingford, UK.
Horn, H. S. 1976. Succession, pp. 187-214.
In: May, R. M. ed. Theoretical
Ecology. Blackwell Scientific Publications, Oxford.
Kremen, C. 1992. Assessing the indicator properties of species assemblages for natural areas monitoring. Ecol. Appl.
2: 203-217.
Kremen, C., R. K. Colwell, T. L. Erwin, D. D. Murphy, R. F. Noss, and M. A.
Sanjayan. 1993. Terrestrial
arthropod assemblages: their use in conservation planning. Conserv. Biol. 7: 796-808.
Kromp, B. 1990. Carabid beetles
(Coleoptera: Carabidae) as
bioindicators in biological and conventional farming in Austrian potato fields. Biol. Fert. Soils 9: 182-187.
Pacala, S. W., and D. J. Deutschaman. 1996. Details that matter: the spatial structure of individual trees maintains forest ecosystem functions. Oilkos 74: 357-365.
Peck, S. L., B. McQuaid, and C. L. Campell. 1998. Using ant species (Hymenoptera: Formicidae) as a
biological indicator of
agroecosystem condition. Environ. Entomol. 27(5): 1102-1110.
Price, P. W. 1975. Insect Ecology. John Wiley & Sons, Inc., New York. 514 pp.
Resh, V. H., and E. P. McElravy. 1993.
Contemporary quantitative
approaches to biomonitoring using benthic macroinvertebrates, pp. 159-154. In: Rosemberg, D. M., and
V. H. Resh, eds. Freshwater
Biomonitoring and Benthic
Macroinvertebrates. Chapman & Hall, New York.
Rissing, S. W. 1986. Indirect effects of granivory by harvester ants: plant
species composition and
reproductive increase near ant nests. Oecologia 68: 231-234.
Rodgerson, L. 1998. Mechanical defense in seed adapted for ant dispersal. Ecology 79: 1669-1677.
Samways, M. J. 1981. Comparison of ant community structure (Hymenoptera: Formicidae) in citrus orchards under chemical and biological control of red scale, Aonidiella aurantii (Maskell)
(Hemiptera: Diapididae). Bull. Entomol. Res. 71: 663-670.
Schluter, D., and R. E. Ricklefs. 1993. Species diversity: an introduction to the problem, pp. 1-10. In: Ricklefs,
R. R., and D. Schluter, eds. Species
Diversity in Ecological
Communities. Chicago University Press, IL.
Southwood, T. R. E. 1978. Ecological Methods. Halsted Press, New York. 524 pp.
Wiegert, R. G. 1976. Ecological Energetics. Halsted Press, New York. 457 pp. Wiegert, R. G., and C. E. Petersen. 1983.
Energy transfer in insects. Ann. Rev. Entomol. 28: 455-486.
Williams, K. S. 1993. Use of terrestrial arthropods to evaluate restored riparian woodlands. Restoration Ecol. June: 107-116.
Wilson, E. O. 1988. The current status of ant taxonomy. pp. 3-10. in: J. C.
Trager, ed. Advances in
Myrmecology. E. J. Brill, New York. Yeatman, E. M., and P. J. M. Greenslade. 1980. Ants as indicator of habitat in three conservation parks in south Australia. South Aust. Nat. 55: 20-26.
(a) (b) Sep. Nov. Jan. Mar. May Jul. 1 3 5 0 1 2 3 4 5 Species richness Month Sites
Sep. Nov. Jan.
Mar. May Jul.
1 3 5 0 1 2 3 4 5 Ln (No. +1) Month Sites
Fig. 1. Spices richness and individuals of ants collected in each sampling site during Sep. 2000 to Aug. 2001. Sites 1 refer to 2 y abandoned orchard, 2 to 5 y abandoned farm, 3 to 20 y secondary forest, 4 to Primary forest, and 5 to Natural protected area, respectively.
(a) 0 1 2 3 4 5 6 7 8 9 1 2 3 4 5 Richness (b) 0 0.1 0.2 0.3 0.4 0.5 0.6 0.7 0.8 0 1 2 3 4 5 Evenness (J index) (c) 0 0.2 0.4 0.6 0.8 1 0 1 2 3 4 5 Sites Abundance index
Fig. 2. Spices richness, evenness and abundance index of ants collected in each sampling site during Sep. 2000 to Aug. 2001. Sites 1 refer to 2 y abandoned orchard, 2 to 5 y abandoned farm, 3 to 20 y secondary forest, 4 to Primary forest, and 5 to Natural protected area, respectively.
(a) 0 2 4 6 8 10
Sep. Oct. Nov. Dec. Jan. Feb. Mar. Apr. May Jun. Jul. Aug.
Species richness 0 1 2 3 4 5 Ln No. (b) 0 0.2 0.4 0.6 0.8 1
Sep. Oct. Nov. Dec. Jan. Feb. Mar. Apr. May Jun. Jul. Aug.
Evenness (J index) (c) 0 0.2 0.4 0.6 0.8 1
Sep. Oct. Nov. Dec. Jan. Feb. Mar. Apr. May Jun. Jul. Aug.
Month
Abundance index
Fig. 3. Monthly fluctuations of spices richness, evenness and abundance index of ants collected in each sampling site during Sep. 2000 to Aug. 2001.
Appendix. List of ant species collected in each sampling site during Sep. 2000 to Aug. 2001. Species 2 y abandoned orchard 5 y abandoned farm 20 y secondary forest Primary forest Natural protected area