行政院國家科學委員會補助專題研究計畫
;
成 果 報 告 □期中進度報告(計畫名稱)
過渡金屬氧化物薄膜物理與元件研究-鈣鈦礦結構磁性金屬氧
化物薄膜之相分離與晶界磁電阻特性與關係研究 (3/3)
計畫類別:□ 個別型計畫
;
整合型計畫
計畫編號:NSC 94-2112-M-009-008-
執行期間:2005 年 08 月 01 日至 2006 年 09 月 30 日
計畫主持人:溫增明
共同主持人:
計畫參與人員: 張維仁、
成果報告類型(依經費核定清單規定繳交):□精簡報告;
完整報告 本成果報告包括以下應繳交之附件: □赴國外出差或研習心得報告一份 □赴大陸地區出差或研習心得報告一份;
出席國際學術會議心得報告及發表之論文各一份 □國際合作研究計畫國外研究報告書一份 處理方式:除產學合作研究計畫、提升產業技術及人才培育研究計畫、列 管計畫及下列情形者外,得立即公開查詢 □涉及專利或其他智慧財產權,□一年□二年後可公開查詢 執行單位:交通大學 電子物理系中 華 民 國 95 年 12 月 25 日
Content
Page中文摘要 --- 3
Abstract --- 4
I. Phase Separation in La
0.7Ce
0.3MnO
3--- 6
1. Introduction --- 6
2. STM Experiments --- 7
3. Results and Discussion for Phase Separation --- 10
Reference --- 13
II. Electronic Structure of La
0.7Ce
0.3MnO
3--- 15
1. Introduction --- 15
2. Experimental Setup & Theoretical Calculations --- 15
3. Results & Discussion --- 16
4. Conclusion --- 19
Reference --- 20
III. The Persistent Magnetoresistive Memory Effect in
La
0.375Pr
0.25Ca
0.375MnO
3--- 21
1. Introduction --- 21
2. Experiment Results and Discussions --- 23
2.1 Time-relaxation Behavior Measurement --- 23
2.2 Time-relaxation Data at Various Temperatures --- 24
2.3 R-H Oscillation Experiments at Various Temperatures --- 26
3. Summary and Conclusions --- 29
[中文摘要]
關鍵詞:掃瞄式電子穿隧顯微鏡、相分離、電子參雜、X 光吸收光譜、LDA+U 計 算、遲滯現象。 近幾年來,在超巨磁阻(Colossal Magneto-Resistance; CMR)中,雙重交換 (double exchange)的電子傳輸機制所不能解釋的部分,相分離扮演著重要的角 色。另一方面,E. Dagotto 也提出將其相分離理論用在解釋高溫超導現象上。這 一 年 來 的 研 究 中 , 除 了 成 功 製 備 難 度 較 以 往 電 洞 參 雜 (hole-doped; La0.7Ca2+0.3Mn3+/4+O3)高出許多的電子參雜(electron-doped; La0.7Ce4+0.3Mn2+/3+O3) CMR 薄膜樣品之外,更直接利用電子穿隧顯微鏡來探討相分離是否也如電洞參 雜的 CMR 材料一樣存在電子參雜的樣品中?我們利用穿隧掃瞄電子顯微鏡觀察 到La0.7Ca0.3MnO3與La0.7Ce0.3MnO3皆具有奈米尺度的相分離現象。藉由將相分離的 影像以直方圖來做統計,我們可以很清楚的看出相分離現象在LCaMO 與 LCeMO 中 隨溫度的演進。為了更進一步瞭解LCeMO 的電子結構,我們做了 X 光吸收光譜的 實驗。結果顯示LCeMO 的空軌域確實比 LCaMO 來的少,也就是說電子確實有參雜 進入eg能帶。這結果也與LDA+U 的計算結果相符。另一方面,(La1-x-yPrx)CayMnO3 (LPCMO) 也和 La1-xCaxMnO3 相同,具有 CMR
效應。除此之外,LPCMO 的磁化強度及電阻在升降溫和變化磁場時顯現出遲滯
現象,並且隨時間而慢慢鬆弛趨近一穩定態。在本研究裡,我們對LPCMO 的持
久電阻記憶效應做了進一步的探討,並得到初步的結論。和 La1-xCaxMnO3 相比
Abstract
Key words: scanning tunneling microscopy (STM), phase separation, electron-doped manganites, XAS, LDA+U calculation., (La1-x-yPrx)CayMnO3, and the
persistent magnetoresistive memory effect
Phase separation has been obviously observed in colossal magnetoresistance (CMR) manganites and, evidently, may play an important role on transport properties, except double exchange mechanism. On the other hand, E. Dagotto applied his theory of percolation on transport properties of high temperature superconductor. To this end, more experimental results are needed. In this project, we had successfully coped the challenge of getting single-phase electron-doped films, La0.7Ce4+0.3Mn2+/3+O3, more
difficulties to hole-doped manganites. We had used the scanning tunneling spectroscopy (STM) image technique to observe evidence of nanoscale phase separation in the divalent-doped La0.7Ca0.3MnO3 thin films at various temperatures. In
addition, we also present the results of the scanning tunneling spectra (STS) and spectroscopic images obtained in the tetravalent-doped La0.7Ce0.3MnO3 thin films
(LCeMO). The results show that, similar to the divalent-doped compounds, the phase separation starts to emerge in the vicinity of the transition temperature. The evolution of the separating phase as a function of temperature is clearly demonstrated in the histogram. Further, x-ray absorption spectroscopy (XAS) was used to investigate the electronic structure in LCeMO. The results of XAS are consistent with those from LDA+U calculations in that the doping of Ce has shifted up the Fermi.
However, although displaying the same CMR phenomena as La1-xCaxMnO3
(LCaMO), (La1-x-yPrx)CayMnO3 (LPCMO) shows another tremendous characteristics:
resistance R(T) and magnetization M(T)! In this report, aware of the more glassy-separated phase existences in LPCMO, we presume this hysteresis resulting from the long time relaxation behavior. As a consequence, we conducted a detailed study on the persistent magnetoresistive memory effect (PMME), which is believed to be intimately related to the detailed process toward to equilibrium state of a glassy phase coexistent system. The quality of the LCaMO and LPCMO samples was carefully characterized by measuring the R(T) and M(T). The crystalline structure and electronic structure of the films were checked by X-ray diffraction and X-ray absorption near edge spectroscopy(XANES). In particular, LPCMO thin film, showing CMR effect, was taken to conduct temperature-dependent PPME experiments. From the results, we obtained the equilibrium states of resistance of LPCMO at various temperatures, proposed a picture within a phase-size-related phase seperation regime, and explained this glassy phase coexist system different with the not-glassy phase coexist system in LCaMO.
I. Phase Separation in La
0.7
Ce
0.3
MnO
3
1. Introduction
A dramatic colossal magnetoresistance (CMR) effects in the hole-doped manganites were discovered in 1990s [1-3]. The origins of CMR in perovskite-type manganites (R1-xAxMnO3, where R being trivalent rare-earth element and A being
divalent alkaline earth ions for hole-doped manganites) were widely investigated and the attention was focus on their rich phase diagram. In these compounds, the valence of manganese is a mixture of Mn3+ (t2g3 eg1) and Mn4+ (t2g3), in which double
exchange (DE) mechanism [4-6] was inducted to describe the behavior of electrons in eg orbital between Mn3+ and Mn4+. The theoretical understanding is still fragmental,
especially on intrinsic inhomogeneities [7], and the DE mechanism alone is failed to explain the transport properties of hole-doped manganites in high temperature region [8].
Intuitively, substituting the divalent cation with the tetravalent cation, such as Ce, Sn, etc., should impel the valence state of Mn to a mixed-valent state of Mn2+ and Mn3+ It then raises curiosities on how the electric transport and magnetic properties of tetravalent cation doped manganites would prevail, as compared with the divalent-doped system. When the trivalent rare-earth atom is substituted by tetravalent cerium, the manganites will be converted into an electron-doped state and the valence states are driven in a mixture of Mn3+ (t2g3 eg1) and Mn2+ (t2g3 eg2) [9-14]. Because of
the double exchange mechanism, operating between neighboring Mn3+/Mn2+, La1-xCexMnO3 should own metal-insulator transition and ferromagnetism. Actually,
La0.7Ce0.3MnO3 (LCeMO) have a TC of about 260 K, which is about the same to
manganites in transitional mechanism and phase segregation.
The correlation between the electronic and magnetic properties of peroviskite manganites, and intrinsic inhomogeneities, has been studied by transmission electron microscope (TEM) [15, 16] measurements and scanning tunneling spectroscopy (STS) of scanning tunneling microscope (STM) [17-20]. Fäth et al. [17] observed the cloudlike patterns of La0.7Ca0.3MnO3 in the scale of 10 nanometers just blew Curie
temperature (TC), which imply phase separation and electronic inhomogeneities.
Renner et al. [20] showed charge ordering and phase separation in real space with atomic scale. These phenomena showed the significance of phase separation to CMR and metal-insulator transition, and implied incomplete theories and phase diagrams to prove out intrinsic inhomogeneities. Phase separation had been observed in many hole-doped manganites, and it seemed to be general for these compounds. The transportable carriers are both in eg orbitals either the electron-doped or hole-doped
manganites, so it inspires a doubt, “Is phase separation universal? ”. The single-phase La1-xCexMnO3 films make a good comparison possible between electron-doped and
hole-doped system.
2. STM Experiments
Epitaxial films of LCeMO were grown on (100) SrTiO3 substrate by pulsed laser
deposition, using KrF (248 nm) excimer laser. The target was polycrystalline bulk and typically properties reported by previous literatures [9], and still in mixed-phase. Stoichiometric amounts of CeO2, La2O3 (which had been preheated) and MnCO3
powders were heated in air at 1100 for 20 hours then being ground, palletized, and ℃ sintered at 1400 for 27 hours and repeat again. To avoid mixed℃ -phase situation, we varied the substrate temperature and laser energy density for optimal growth [21]. To
acquire single phase LCeMO thin films, the substrate temperature was kept at 725 ℃ and oxygen pressure was controlled at 0.35 Torr. After deposition, the chamber was vented by oxygen and cooled down to room temperature. The film thickness was approximately 170 nm.
As shown in Fig. 1(a), the x-ray diffraction (XRD) of thin films is in single phase. The resistance and magnetization versus temperature (R-T and M-T) denote the metal-insulator transition (TMI) and Curie temperature (TC) are both about 260 K as
shown in Fig. 1(b). The valance states of single-phase LCeMO films were investigated by C. Mitra et al. [14], in which the results of X-ray absorption spectroscopy shown that all ions of this compound were in correct valence state. Our LCeMO films had also been checked in the same experiments. Hysteresis curves at 10, 100, and 200 K denoted the coercive field and saturated field are about 5, 50, 200 Oe and 0.15 T, respectively, and is lower than the external field (0.35 Tesla) applied in STS measurements.
Figure 1
STM were used to obtain surface topographic and spectroscopic images at constant current mode with Pt0.8Ir0.2 tip. The sample was biased at 0.7 V relative to tip
in the measurement of spectroscopic image as a standard lock-in technique [20]. The lock-in amplifier applied a small signal of sine wave on bias voltage (≤ 3%) and sensed the modulated tunneling current to output dI/dV data during scanning. STM was operated at a very slow scanning rate in measurements to improve the resolution of spectroscopic images, and the differential conductance (dI/dV) signal from lock-in amplifier were recorded with z-axis signal simultaneously. The I-V characteristics were scanned at each 16th point of STS with a voltage range from +1 V to –1 V. Fig. 2(c) illustrates the I-V characteristics of metallic phase (A curve) and insulating phase (B curve) at 80 K. The metallic states have a linearer I-V curve, compared to the I-V curves of insulating states, which leads to a smaller dI/dV value at the bias voltage 0.7 V, and being assigned on spectroscopic images as a dark region whereas the insulating states are assigned to the light regions of STS. Moreover, the contrast of spectroscopic images shows the relative intensity of every pixel, not absolute value between images. When choosing scanning area for STS, the maximum peak to peak depths of topography in spectroscopic images are smaller then 20nm [Fig. 2(a), (b)] in order to avoid turbulent tunneling current, which will show some components on the modulated frequency, and spectroscopic images sometimes depict insulating region along the sharp grain-boundaries.
(c) Figure 2
3. Results and Discussion for Phase Separation
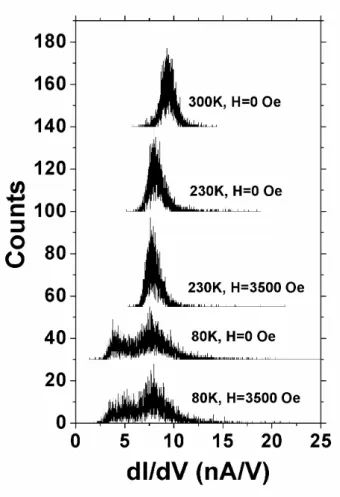
We had measured STS over a wide temperature range which covers both side of the transition in 100 × 100 nm2 area. Some steep relief of surface shut metallic phase in ravines even though applying 0.35 Tesla field. In most regions of surfaces, the metal-insulator separations were not directly relative to topography. At 300 K, there are small dark regions in spectroscopic images and they shift with applying magnetic field as shown in Fig. 3. Although the dark regions showed being more metallic to others, I-V characteristics were considerably non-linear at 300 K. The inhomogeneities of LCeMO were less perceptible at 300 K, comparing with the inhomogeneities below 230 K, and possessed a narrow dI/dV distribution [Fig.4] even if being applied magnetic field. Further more, the temperature was cool down to 230 K, a whole of LCeMO appear more metallic phase but the contrast of images was not vivid. After magnetic field was enhanced, dI/dV distribution [Fig. 4] shifted to metallic region (low dI/dV value) and the difference between metallic and insulating regions of spectroscopic image became visible. This is obviously to connect the enhanced hopping probability of eg electrons, operated by DE mechanism, with the
the patterns of insulating and metallic phase just blew Tc, as shown in the literature
[17], but in the STS of LCeMO, the high contrast of metallic and insulating state revealed until cooling down to 200K, which was unlike the behavior of LCMO. The spectroscopic images at 80 K demonstrate the competition between metallic and insulating phase [Fig. 4]. The phase distribution was perturbed by an applied magnetic field of 0.35 T and the contrast of spectroscopic image became muddy. As shown in Fig. 5, the metallic state (~3.7 nA/V) move to insulating state let the phenomenon of phase separation blur out, and the average tunneling conductance are 7.172 nA/V and 7.268 nA/V for H = 0 and 0.35 T respectively. The results, comparing with the STS of at hillside of R-T curve (Metallic state was enhanced, average tunneling conductance from 8.297 nA/V to 7.986 nA/V, by adding external magnetic field at 230 K.), are very attractive. The insulating states increased in LCMO [17, 20] by applied magnetic field (~0.3 T), and the metallic states increased with magnetic field (> 1 T), which had been accepted intuitionally, but low field MR (LFMR) and high field MR (HFMR) are both negative. Obviously, the different mechanisms between HFMR and LFMR dominate the MR behavior of electron-doped and hole-doped manganites. There are still MR effects at low temperature, much below Tc and having achieved the maximum magnetization, whether hole- or electron-doped lanthanum manganites. If only DE mechanism dominates the ferromagnetic transition, the full ferromagnetism of whole manganites will not induce MR effects at low temperature. Additionally, M-T curves somehow sagged in low temperature region (< 50 K) and R-T curves decrease with temperature below TMI, but residual resistance was not zero as T→0.
That may be due to spin-glasses phenomena or complex competition between FM and AFM.
In summary, we had measured the STS of LCeMO films from 300 to 80K. Beside similar R-T, M-T transition and eg band majority spin carriers [21], the result
showed that phase separation coexist in hole-doped and electron-doped compounds, which can be observed clearly in histogram of dI/dV distribution.
(a)-1 (a)-2 (a)-3
(b)-1 (b)-2 (b)-3
(c)-1 (c)-2 (c)-3
Figure 4
Reference:
[1] P. Schiffer, A. P. Ramirez, W. Bao, S. -W. Cheong: Phys. Rev. Lett. 75, 3336 (1995)
[2] A. Urushibara, Y. Moritomo, T. Arima et al.: Phys. Rev. B 51, 14103 (1995)
[3] Y. Tomioka, A. Asamitsu, H. Kuwahara, and Y. Moritomo, and Y. Tokura: Phys. Rev. B 53, R1689 (1996)
[4] C. Zener, Phys. Rev. 82, 403 (1951)
[5] P. W. Anderson and H. Hasegawa, Phys. Rev. 100, 675 (1955) [6] P. -G. de Gennes, Phys. Rev. 118, 141 (1960)
[7] Nanoscale Phase Separation and Colossal Magnetoresistance / the physics of manganites and related compounds, edited by Elbio Dagotto (Springer, 2003) [8] A. J. Millis, P. B. Littlewood, and B. I. Shraiman, Phys. Rev. Lett. 74, 5144 (1995)
[9] P. Mandal and S. Das, Phys. Rev. B 56, 15073 (1997)
[10] John Philip and T R N Kutty, J. Phys.: Condens. Matter 11,8537 (1999)
[11] P. Raychaudhuri, S. Mukherjee, A. K. Nigam, J. John, U. D. Vaisnav, R. Pinto and P. Mandal, J. Appl. Phys. 86, 5718 (1999)
[12] J-S Kang, Y J Kim, B W Lee, C G Olson and B I Min, J. Phys.: Condens. Matter 13,3779 (2001)
[13] C. Mitra, P. Raychaudhuri, K. Dörr, K. -H. Müller, L. Schultz, P.M. Oppeneer, and S.Wirth, Phys. Rev. Lett. 90, 017202 (2003)
[14] C. Mitra, Z. Hu, P. Raychaudhuri, S. Wirth, S. I. Csiszar, H. H. Hsieh, H. -J. Lin, C. T. Chen, and L. H. Tjeng, Phys. Rev. B 67, 092404 (2003)
[15] James C. Loudon, Nell D. Mathur and Paul A. Midgley, Nature 420, 797 (2002) [16] Y. Murakami, J. H. Yoo, D. Shindo, T. Atou and M. Kikuchi, Nature 423, 965
(2003)
[17] M. Fäth, S. Freisem, A. A. Menovsky, Y. Tomioka, J. Aarts, J. A. Mydish, Science 285, 1540 (1999)
[18] T. Becker, C. Streng, Y. Luo,V. Moshnyaga, B. Damaschke, N. Shannon and K. Samwer, Phys. Rev. Lett. 89, 237203 (2002)
[19] Ch. Renner, G. Aeppli, B.-G. Kim, Yeong-Ah Soh and S.-W. Cheong, Nature 416, 518 (2002)
[20] S. F. Chen, P. I. Lin, J. Y. Juang, T. M. Uen, K. H. Wu, Y. S. Gou and J. Y. Lin, Appl. Phys. Lett. 82, 1242 (2003)
II. Electronic Structure of La
0.7
Ce
0.3
MnO
3
1. Introduction
Previously, the transport properties and the electronic structure of LCeMO had been reported with results obtained from the tunneling junction, photoemission, and XAS experiments [1-5]. The results showed that the valance state of Mn is indeed a mixed valence of Mn2+/Mn3+, and it’s probably electron-doped. However, there are discrepancies among the reported results. For instance, the tunneling junction experiments suggested that the itinerant carriers in LCeMO are the minority spin carriers [1], which was in sharp contrast to the conclusion of the majority spin carriers drown from XAS experiments and theoretical calculations [5, 6]. Our results unambiguously clarified some of the outstanding controversies in this system.
2. Experimental Setup & Theoretical Calculations
Details of preparing the single phase LCeMO on (100) SrTiO3 substrates by
pulsed-laser deposition and the associated structure-property analyses were reported in Ref. [7]. The x-ray scattering and x-ray diffraction results indicated that the obtained LCeMO films were highly epitaxial single-phase samples with negligible traces of impurity phases like CeO2 and MnO. The O K-edge and Mn L-edge XAS
spectra were carried out using linear polarized synchrotron radiation from 6-m high-energy spherical grating monochromator beamline located at NSRRC in Taiwan. Details of XAS experiments can be found in Ref. [8]. Being different from previous XAS measurements at 300 K [3-5], the O 1s XAS spectra of LCeMO and LCaMO were taken by x-ray fluorescence yield at 30 K, which directly probed the electronic structure in the ferromagnetic state for both samples. The band structure calculations
were performed using the full-potential projected augmented wave method [9] as implemented in the Vienna ab initio simulation package (VASP) [11] within the local-density approximation plus on-site Coulomb interaction U (LDA+U) scheme [11]. In the LDA+U calculations, we used Coulomb energy U=5.0 eV and exchange parameter J=0.95 eV for Ce(La)-4f electrons, while U=4.0 eV and J=0.87 eV were used for Mn-3d electrons [5].
3. Results & Discussion
To characterize the valence state of manganese in LCeMO, Mn L-edge XAS spectra of MnO2, Mn2O3, MnO, LCaMO, and LCeMO were measured and are shown
in Fig. 2.1(a) for comparison. The spectral weight of Mn L-edge for LCeMO evidently exhibits the characteristics of both Mn2+ and Mn3+, which has been previously interpreted as manifestations of Mn2+/Mn3+ mixed-state in LCeMO [3-4]. In Fig. 2.1(b), O K-edge XAS spectrum of LCeMO reveals a shoulder near absorption edge as compared with the first pronounced peak of LCaMO at 529 eV. These results suggest that there are fewer unoccupied states in eg↑ band of LCeMO than in that of
LCaMO due to extra electrons doped into the eg band of LCeMO, presumably
originated from substituting Ca2+ with Ce4+. Based on these XAS results, the electronic structure of LCeMO appears to be consistent with the scenario of the majority spin carriers associated with strong Hund’s rule effects. On the other hand, for the minority spin scenario to prevail one would expect otherwise a strong O K-edge spectral weight in the vicinity of the absorption edge. The electronic structure diagrams for the scenarios discussed above are depicted schematically in Fig. 2.1 (c). The density of states spectra obtained from LDA+U calculations (Fig. 2.2) also revealed that both LCeMO and LCaMO are majority spin half-metals with fewer
unoccupied eg↑ states in LCeMO. This is in good agreement with the observed XAS
spectra mentioned above. The above analyses unambiguously demonstrate that electrons are indeed doped into LCeMO. Moreover, as displayed in the inset of Fig. 2.1(b), the mixed-valence Mn2+/Mn3+ also leads to typical magneto-transport properties of CMR manganites, with Tc and TIM being around 260 K, which is also
consistent with most of the previous reports [1-5].
Fig. 2.2
4. Conclusion
In summary, we have presented the detailed results of Mn L-edge and O K-edge XAS which suggest that LCeMO is a majority spin carrier ferromagnet. The results also display clear evidence of electron-doping into the eg↑ sub-band of LCeMO.
However, both Hall measurements and LDA+U band structure calculations indicate that the doped electrons did not drive LCeMO into a n-type manganite and the itinerant carriers are still holes, but with a much less concentration as compared with that of LCaMO.
Reference:
[1] C. Mitra et al., Phys. Rev. Lett. 90, 017202 (2003). [2] C. Mitra et al., Appl. Phys. Lett. 79, 2408 (2001). [3] C. Mitra et al., Phys. Rev. B 67, 092404 (2003).
[4] J.-Y. Lin et al., J. Magn. Magn. Mater. 282, 237 (2004). [5] S. W. Han et al., Phys. Rev. B 69, 104406 (2004).
[6] Q. Zhang and W. Zhang, Phys. Rev. B 68, 134449 (2003). [7] W. J. Chang et al., J. Appl. Phys. 96, 4357 (2004).
[8] I. P. Hong et al., Europhys. Lett. 58, 126 (2002); H. D. Yang et al., Phys. Rev. B 68, 092507 (2003).
[9] G. Kresse and D. Joubert, Phys. Rev. B 59, 1758 (1999). [10] G. Kresse and J. Furthmüller, Phys. Rev. B 54, 11169 (1996).
[11] A. I. Liechtenstein, V. I. Anisimov, and J. Zaanen, Phys. Rev. B 52, R5467 (1995).
III. The Persistent Magnetoresistive
Memory Effect in La
0.375
Pr
0.25
Ca
0.375
MnO
3
1. Introduction
In this study, we tried to unveil the influence of phase separation nature on the electric transport of La0.375Pr0.25Ca0.375MnO3 (LPCMO) thin film, one of
well-characterized CMR materials. In this material the time-relaxation behavior of resistance at various applied fields may reflect a significant phenomenon associated with the competition between charge ordering (CO) and ferromagnetic-metal (FM) phases especially near the transitions. It denotes that the resistance continuously changes upon time after the disturbing factors ceased to acting may have been the process approaching the equilibrium distribution of coexisting phases. This behavior observed in LPCMO is apparently a strong support to the PS model, especially when we are looking for the equilibrium state at various temperatures. The importance of the equilibrium state cannot be over emphasized since the equilibrium state is the ground base of theoretical models aimed to interpreting the exotic yet frequently variable transport behaviors exhibited in the family of CMR manganites. Nevertheless, measurement of the actual equilibrium resistance of LPCMO is a difficult, if not impossible, job in lab, since the relaxation time is usually way too long for realistic to laboratory experiments. As a consequence, albeit over fifty years since CMR materials were discovered, only few indirect experiment data showed the probable equilibrium state of temperature-dependent resistance R(T) in LPCMO by measuring the persistent magnetoresistive memory effect, in a narrow temperature region. Undoubtedly, the discussion or study limited in that region is not adequate to lend a
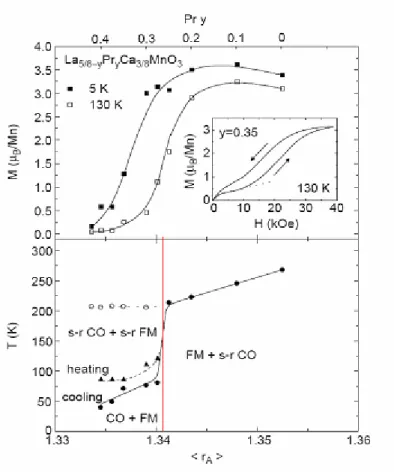
complete interpretation of transport characteristics of LPCMO. In this study we conducted systematic measurement of persist magnetoresistive memory effect (PMME) at various temperatures and applied fields. We then establish equilibrium state of the resistance of LPCMO over a wide range of temperatures and compared that with the phase separation evolution process as depicted in Fig. 3.1. We focus on the y = 0.25 Pr doping concentration which has been demonstrated to have phases evolution from two short range (s-r) phases to final two long range phases with decreasing temperatures. Furthermore, the evolution of phases was evidently supported from the observation of the resistance response to applied magnetic filed oscillation.
Fig. 3.1: <rA> donates the average ionic size. “y” is doping concentration of Pr. The
lower plot reveals different phase-coexistence at various temperatures. The red line is the guide of the eye for y = 0.25 [M. Uehara et al., Nature 399, 560 (1999).].
2. Experiment Results and Discussions
2.1
Time-relaxation Behavior Measurement
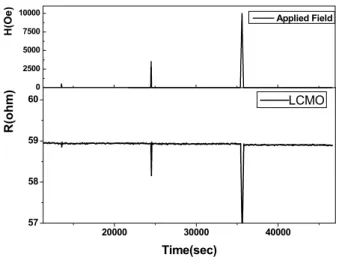
This method could help us find the equilibrium state of sample resistance at various temperatures because it must be lying somewhere between the minimum of the decreasing resistance and the maximum of the increasing one. Before we get into the detailed discussion of the PMME results, we first show the experimental results of La0.7Ca0.3MnO3 (LCaMO) and LPCMO respectively in Fig. 3.2 and Fig. 3.3. It is
evident that complete rejuvenation of resistance in obtained for LCaMO, indicating an absence of PMME for this material. On the contrary, for LPCMO, the also relaxation towards the equilibrium resistance is observed after the removal of the applied field. The behavior also is very much dependent on the strength of the applied field. Although it is not clear at present the actual mechanism, giving rise to the difference between LCaMO and LPCMO, it is, nevertheless, quite consistent with the hysteretic behavior of the R(T) and M(T) results described above. We suspect that, although both materials are found to have phase coexistent over wide range of temperatures, the formation of the coexistent phases may have very different natures. Namely, we note that in LCMO the coexisting phases are the parent paramagnetic insulating phase and newly formed ferromagnetic metallic phase. While for LPCMO, the phases transition involves a pair of new phases (the CO and FM phases) are formed from a single paramagnetic phases when temperature is lowered below TCO In any case, since the
PMME is only observable in LPCMO, we will focus on discussion of this effect on this particular material.
20000 30000 40000 57 58 59 60 0 2500 5000 7500 10000 R( ohm) Time(sec) LCMO H( Oe ) Applied Field
Fig. 3.2: The resistance remained almost the same after removals of different applied magnetic field impulses.
20000 30000 40000 10400 10800 0 2500 5000 7500 10000 R(ohm) Time(sec) LPCMO Applied Field H(O e)
Fig. 3.3: The drop of the resistance did not rejuvenate to its original value after removal of the applied magnetic field impulses.
2.2 Time-relaxation Data at Various Temperatures
In this study we tried to attain the metastable resistance-temperature dependence by utilizing PMME. After we conducted the PMME experiments at various
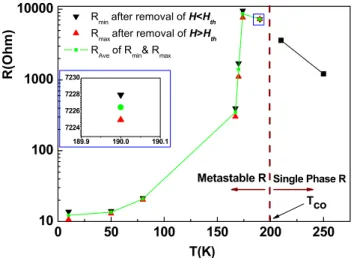
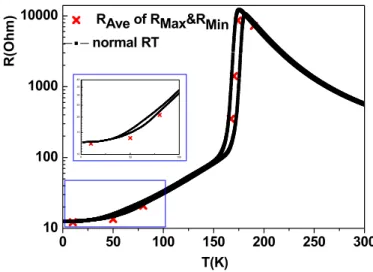
dependence. Fig. 3.4 illustrates the metastable RT dependence. Each data plotted in Fig. 3.4 represents a single PMME experiment at that temperature. Based on the data acquired from the PMME experiments, we could obtain Rmin, the minimum resistance
from 90-minute relaxation after the removal of H for H<Hth, and Rmax, the maximum
resistance we obtained from 90-minute relaxation after the removal of H for H>Hth. Rave denotes the arithmetic average of Rmaxand Rmin. The inset demonstrates, as an
example, the difference between Rmax and Rmin at T= 190 K. We further compare the
obtained metastable RT dependence with that obtained from a “standard” R(T) measurement (Fig. 3.5). As is evident from the results, both values agree quite well, indicating that the current measurements are closely related to the usual transport measurements. 0 50 100 150 200 250 10 100 1000 10000 189.9 190.0 190.1 7224 7226 7228 7230 R(Ohm) T(K)
Rmin after removal of H<Hth
Rmax after removal of H>Hth
RAve of Rmin& Rmax
Tco
Metastable R Single Phase R
Fig. 3.4: The diagram shows the single-phase R-T dependence above TCO linked with
0 50 100 150 200 250 300 10 100 1000 10000 0 50 100 10 15 20 25 30 35 40 R(O h m ) T(K) RAve of RMax&RMin normal RT
Fig. 3.5: The plot marks the metastable points of R(T) dependence by red crosses, comparing to that of a standard R(T) measurement. The inset reveals the disability of resistance rejuvenation at low temperatures.
2.3 R-H Oscillation Experiments at Various Temperatures
To further depict the scenario proposed above, we conducted R-H oscillation experiments at T = 190 K (Fig. 3.6, just below TCO), T = 174 K (Fig. 3.7, in the
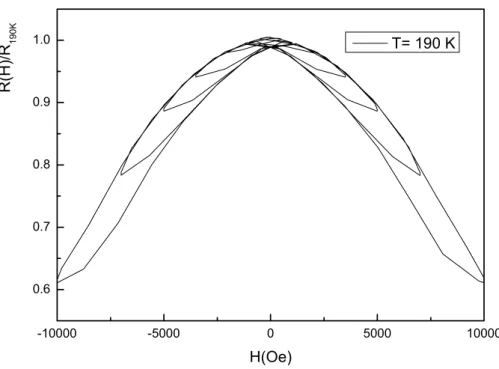
hysteresis region), and T = 130 K (Fig. 3.8, at low temperature). These experiments were designed to use the oscillating field to “stir” the metastable state that will effectively remove the effect of Hth and hence accelerate the relaxation. We first cooled the sample to the temperature aimed. Then, we applied a H which is larger than Hth, removed it, and measured the resistance relaxation for 200 minutes. This is done in order to compare subsequently the behaviors under oscillating H the same period of time. Finally, we applied an descendent oscillating H and measured the change of the resistance simultaneously over the same period of time. The results measured at T= 190 K is shown in Fig. 3.6. In this case, both the zero-field relaxation and oscillating field “stirred” relaxation display consistent behaviors with an
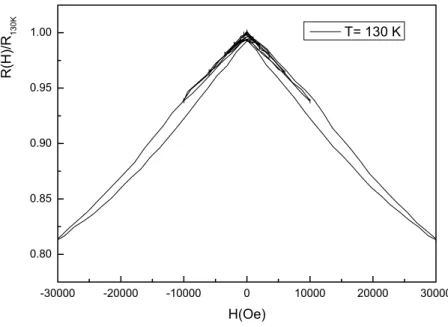
increasing relaxation in R. Fig. 3.6 illustrates the R-H hysteresis loops upon the R-H oscillation. The fact that the size of each loop responding to the descending field remains essentially the same is indicative of a relatively undisturbed phase-separation distribution under such conditions. Since Hth (190 K) ~ 2 T I smuch larger over than the Hosc.(max) applied here, we expect that the Hosc. applied here, though effectively changed the overall resistance by maybe usual magnetoresistance behavior, does not alter the phase separation distribution and hence did not affect the resistance relaxation (or PMME). Fig. 3.7 shows the results at T= 174 K, revealing that the stirring of the applied oscillating field causes an even larger increase in resistance with time than the original zero-field relaxation over the same duration of time. Fig. 3.7 shows a distinctly different R(H) hysteresis at this regime. The larger hysteresis R(H) loops indicates even a small field can affect the transport behavior significantly. We believe that in this temperature regime, since the coexisting new phases start to play a more significant role in determing the transport properties and are not yet robust enough. Thus, the resistnace is susceptible to even a small field. However, at T = 130 K (as shown in Fig.3.8) even the applied field is as large as 3 Tesla, due to the robustness of the long range ordered CO and FM phases, only very little hysteretic effects are discernible.
-10000 -5000 0 5000 10000 0.6 0.7 0.8 0.9 1.0 R(H) /R 1 90K H(Oe) T= 190 K
Fig. 3.6: The symmetric hysteresis of R-H with H oscillation is clearly observed.
-10000 -5000 0 5000 10000 0.2 0.4 0.6 0.8 1.0 1.2 1.4 0 100 200 300 0 2 4 6 8 10 H(Oe) R( H )/ R174K T= 174 K R(T) RAve of RMax&RMin
T(K)
-30000 -20000 -10000 0 10000 20000 30000 0.80 0.85 0.90 0.95 1.00 R( H)/ R13 0K H(Oe) T= 130 K
Fig. 3.8: The R-H hysteresis is small even with a larger H oscillation at T= 130 K.
3. Summary and Conclusions
In discussing the nature and consequences of the phase separation model, we propose a size-effective mechanism to relate the detailed distribution of the coexisting phases to the measured magneto-transport properties. By studying the time-relaxation of resistance at different temperatures, properties have been shown to intimately correlate the electric transport with competitions between the coexisting phases. In particular, we demonstrated that, although the PMME phenomena can be discerned over a much wider temperature range than previously anticipated, the properties are most susceptible to external disturbances (e.g. temperature change or applied magnetic field) when it is in the vicinity of phase transition regime. Our experiments also demonstrated that both the amount and robustness of the CO phases may be playing the dominant role in giving rise to the R(T) hysteresis in LPCMO. This may
also explain why the PMME is absent in LCMO system. The hysteretic and the relevant relaxation behaviors observed in this study could be due to two possibilities resulted from the formation of CO phase. One is the existence of CO-phase is the sole reason. The other is that the behavior may be general for phase coexistent systems; nevertheless, the relaxation process is too fast for the FM phase as compared to that of the CO phase. Thus, we only see the manifestations of the CO phase. Further work is certainly needed to discern these proposed possibilities.
Publication List
1. P.I. Lin, C.W. Luo, H.S. Liu, S.F. Chen, K.H. Wu, J.Y. Juang, T. M. Uen, Y.S. Gou, and J.Y. Lin, “On the origin of photogenerated terahertz radiation from current-biased superconducting YBCO thin films”, J. Appl. Phys. 95, 8046 (2004).
2. H.K. Zeng, A. Hsiao, W.-H. Hsu, S.-W. Wu, J.-Y. Lin, K.H. Wu, J.Y. Juang, T. M. Uen, Y.S. Gou, and J.-T. Kuo, “Miniaturized 3 GHz Cross-Coupled Planar Microwave Filters”, IEEE Trans. Appl. Supercond. 14, 107 (2004).
3. L. S. Lai, J. Y. Juang, K. H. Wu, T. M. Uen, Y. S. Gou, Physica C 133-138, 415 (2004).
4. W.J. Chang, C.C. Hsieh, J.Y. Juang, J.Y. Lin, K.H. Wu, T. M. Uen, and Y.S. Gou, “Preparation and magneto-transport properties of single-phase electron-doped La0.7Ce0.3MnO3 films”, accepted for publication by J. Appl. Phys. 96, 8 (2004). 5. T.C. Wang, J.Y. Juang, K.H. Wu, T. M. Uen, and Y.S. Gou, “Thermally activated
diffusion observed by in-situ RHEED intensity monitoring on interrupted SrTiO3 homoepitaxial growth”, Jpn. J. Appl. Phys. 43, 771 (2004).
6. T.C. Wang, J.Y. Lee, C.C. Hsieh, J.Y. Juang, K.H. Wu, T. M. Uen, and Y.S. Gou, “Activated kinetics of room temperature deposited SrTiO3 thin films investigated by RHEED monitored annealing with different heating rates”, accepted for publication by Jpn. J. Apply. Phys., July, (2004).
7. T.C. Wang, J.Y. Lee, J.Y. Juang, K.H. Wu, T. M. Uen, and Y.S. Gou, “RHEED in-situ monitored step edge diffusion during interrupted laser ablation epitaxial growth of SrTiO3”, accepted for publication by Chin. J. Phys., July, (2004).
8. Te-Chun Wang, Jung-Yuee Lee, Chih-Chang Hsieh, Jenh-Yih Juang, Kaung-Hsiung Wu, Tzeng-Ming Uen and Yih-Shun Gou, Jpn. J. Apply. Phys. 44, 1067-1068 (2005).
9. C. W. Lou , M. H. Chen , S. P.Chen , K. H. Wu , J. Y. Juang , J. –Y. Lin , T. M. Uen, and Y. S. Gou :“ Symmetry and doping dependence of the two superconducting gaps of underdoped textured YBa2Cu3O7-δ thin films “ submitted to Physical Review B (2005).
10. C. W. Lou , P. T. Shih , Y. -J.Chen , M. H. Chen , K. H. Wu , J. Y. Juang , J.-Y.Lin , T. M. Uen , and Y. S. Gou :“Spatially-resolved relaxation Dynamics of Photoinduced Quasiparticle in Underdoped YBa2Cu3O7-δ”, Physical Review B 72, 092506 (2005).
11. P. I. Lin, K. H. Wu, J. Y. Juang, J.-Y. Lin, T. M. Uen, and Y. S. Gou, “Generation of THz Radiation and Its Application in the Studies of Electrodynamics of High-Tc Superconductors in THz Regime”, 2005 Japan-Taiwan Symposium on Superconductive Electronics, Sapporo, Japan, Feb. (2005).
12. T. Y. Cheng, C. C. Hsieh, J. Y. Juang, J.Y-.Y Lin, K. H. Wu, T. M. Uen, Y. S. Gou, C. H. Hsu, Physica B 141-146, 365 (2005).
13. W. J. Chang, J. Y. Tsai, H.-T. Jeng, J.-Y. Lin, Kenneth Y.-J. Zhang, H. L. Liu, J. M. Lee, J. M. Chen, K. H. Wu, T. M. Uen, Y. S. Gou, and J. Y. Juang, Phys. Rev. B 72, 132410 (2005).
14. L. S. Lai, J. Y. Juang, K. H. Wu, T. M. Uen, Y. S. Gou, Physica C 99-103, 432 (2005).
15. L.S. Lai , H.K. Zeng, J.Y. Juang, K.H. Wu, T. M. Uen, J.Y. Lin, Y.S. Gou, “Physical properties of YBa2Cu3O7-δ thin films using microstrip ring resonators technique”, Physica C 443, 9 (2006).
16. C. W. Luo, C. C. Hsieh, Y.-J. Chen, P. T. Shih, M. H. Chen, K. H. Wu, J. Y. Juang, J.-Y. Lin, T. M. Uen, and Y. S. Gou, “Spatial dichotomy of quasiparticle dynamics in underdoped thin-film YBa2Cu3O7-δ superconductors”, Phys. Rev. B, 74, 184525 (2006).
17. S. F. Chen, W. J. Chang, C.C. Hsieh, S. J. Liu*, J. Y. Juang, K. H. Wu, T. M. Uen, Y. S. Gou, J.Y. Lin, “Anisotropic magnetoresistance of La0.7Ca0.3MnO3 thin film biepitaxial step junctions”, has been accepted by J. Appl. Phys. (2006).
18. T. Y. Cheng, C. W. Lin, L. Chang, C.H. Hsu, J.M. Lee, J.M. Chen, J.-Y. Lin, K. H. Wu, T. M. Uen, Y. S. Gou, J. Y. Juang, Phys. Rev. B. 74, 134428 (2006). 19. W. J. Chang, J.-Y. Lin, T. Y. Chung, J. M. Chen, C.-H. Hsu, S. Y. Hsu, T. M.
Uen, K. H. Wu, Y. S. Gou, and J. Y. Juang, “Fabrication and X-ray Absorption Spectroscopy in Layered Cobaltate NaxCoO2 thin films”, has been accepted by Journal of Magnetism and Magnetic Materials (2006).