VGE-A New Communication Platform for the General Public
12
0
0
全文
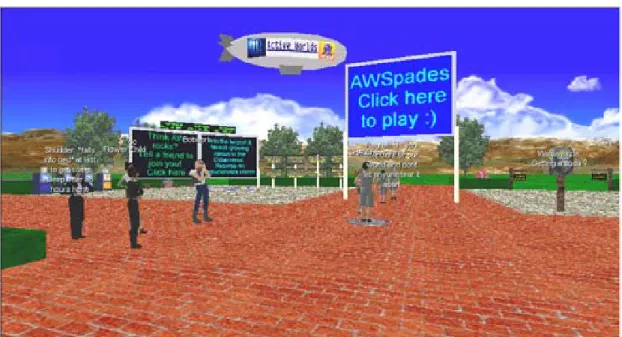
(2) geographic perspective, we will introduce a new concept of virtual geographic environments (VGE), and will study three cases for public participation based on VGE.. physical world, VGE can be defined as environments pertaining to the relationship between post-humans and 3-D virtual worlds (Lin and Gong, 2001).. 2. DEFINITION OF VIRTUAL GEOGRAPHIC ENVIRONMENTS. VGE are complex, non-linear, selforganized, evolving systems in which there are many 3-D virtual objects and virtual people who lead virtual social, political, and economic lives. As an example, Alphaworld, a famous Internet based online community, now has over 800,000 unique users and over 20,000 unique paid members (Active Worlds, 2000). Each member can build his house in Alphaworld. Figure 1 shows a 3-D Alphaworld site where many online users employ 3-D avatars to navigate the world and talk with each other. Figure 2 describes a ‘satellite’ map of Alphaworld landscapes in August 1999. Alphaworld can be considered as a newborn, simple but evolving virtual geographic environment.. To date, everything in this material world is being virtualized. Space-place becomes virtual space-flow, thus events occurring in cyberspace cannot be accurately located. But the continuous development of technologies such as 3-D graphics, visualization, virtual reality, and web-based VRML (the Virtual Reality Modeling Language) leads to the emergence of 3-D virtual worlds in cyberspace (Carey and Bell, 1997). With virtual space and virtual place, 3-D virtual worlds provide places where post-humans can work and live. In this environment, post-humans are the combination of humans in the real world with 3-D avatars that are 3-D graphical representations of participants in 3-D virtual worlds. In comparison with the concept of real geographic environments in the. Figure 1. A 3-D virtual place of Alphaworld, Image courtesy by Activeworlds.com. 2.
(3) Figure 2. ‘Satellite’ map of Alphaworld landscapes in August 1999, Image courtesy by Activeworlds.com. 3. THREE CASES In VGE, there may be many diverse virtual communities and application systems. Geospatial application systems can be seen as divisions, or as whole virtual laboratories embedded in VGE for handling geographic phenomena and processes on the Earth. In this paper, we present three cases for studying public participation in visual impact assessment of urban landscape, in wildfire model-driven behaviour simulation, and in country park management. From the perspective of human-computer (data) interface, the three cases deal with relationships of human-data, human-model, and human-human respectively. 3.1 Visual Impact Assessment of Urban Landscape. As an important component of society and environment, the urban landscape's visual quality is attracting people's attention. To satisfy people's appreciation for high quality urban landscape, urban planners try to improve the visual sustainability in urban landscape and maintain valuable natural landscape resources with high visual quality in urban space (Oh, 1994). The recent upsurge in public interest in preserving the beauty of public lands has resulted in development of scenic assessment based on public input (Arthur et al., 977). Questionnaires or verbal surveys and community meeting are the most commonly used nonquantitative method for sampling scenic preference of various groups. These traditional approaches, however, are often limited by time and space, and hard to answer some “what if ” 3.
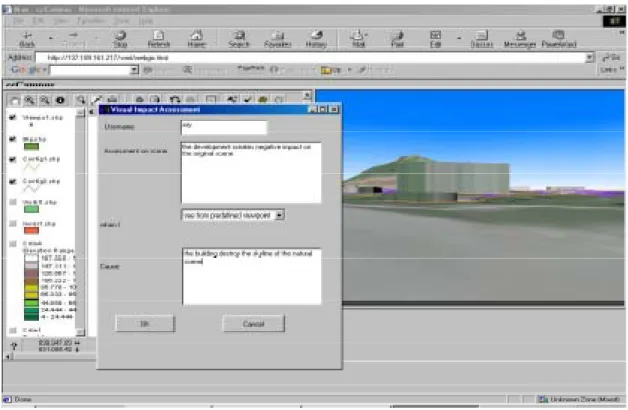
(4) questions . In this research, we integrating the Web GIS and the VRML/Java by EAI to develop a distributed system for public participatory visual impact assessment. (Marrin, 1997). Figure 3 demonstrates the client/server system architecture. The server side includes the. Figure 3. System architecture for public participatory visual impact assessment customized Internet map server, application server, and database server. The application server is mainly based on the ESRI ArcIMS server 3.0. This system can implement landscape simulation, viewpoint and view corridor analyses, spatial query on intervisibility, visual impact assessment, and participation log management. Using the campus of the Chinese University of Hong Kong as an example, Figure 4 describes the interface of the prototype system for public participatory assessment. Suppose that a building is added in the CUHK campus,. then the user named ZZY can view the new 3D landscape via the selection of viewpoints across the Web ( see Figure 4). ZZY will identity that the new building may destroy the skyline of the original scene, and may lead to negative impact as he choose a specific viewpoint. A visual assessment panel allows ZZY to address his assessment (see Figure 4). The information about the user and assessment is recorded and managed by a database server. Figure 5 displays the participation log.. 4.
(5) Figure 4. The interface of the prototype system for visual impact assessment. Figure 5. The participation log 3.2 A virtual studio for wildfire behavior simulation and ecological planning. 5.
(6) Wildfire is often portrayed to be one of the major disasters in most forest. Great quantity of forest is burned in wildfire every year all over the world. Except controlled fires, wildfires in forest are not only a disaster to forest itself but also sometimes mean disaster to the whole forest ecosystems. Ecological security planning should be conducted in forest ecosystem to reduce wildfire danger to ecological security (Yu, 1997). Planning content may contain fire-fighting equipment allocating in forest, new path blazing, residential area allocation, etc. Most issues in the planning will affect local residences; therefore public involvement from local residences and communication between the government and citizens is necessary to reach a consensus on the long-term planning. The ability to forecast the progress of a large wildfire would significantly reduce human suffering, loss of life and destruction of property, on the other way, controlled prescribed burning have been becoming an significantly tactic for forest management activities from timber harvest scheduling to reforestation and thinning operation. One of the most efficient ways to forecast the crisis is to study the behavior of them, descript the crisis event progress with some mathematic language in a spatial way, and then simulate the progress within some scale (time and space), which means that the crisis is predictable at some level.. This study takes Mopanshan mountain (Sichuan Province, China) as a study area. Mopanshan mountain is surrounded by Yalongjiang River, lying in Liangshan Zhou, Sichuan province, China. The whole territory lies between Latitudes N27º40' and N27º46', Longitudes E102º and E102º8', with total area 1.1 km 2 . Wildfire is one of the major disaster risks in this area; therefore all planning decision in this area should take wildfire into account. This research sets up a public participatory Virtual Studio with regard to the case of the effect of wildfire on ecological security planning process. Multi-tiered system architecture is built to demonstrate concept of a Virtual Studio. There are altogether 3 tiers within this system: client side user interface, Web server platform, and a GIS workbench (Web GIS with application model). Basic data sets in this study include weather data (air temperature, air humidity, rainfall), features of ground truth (rivers, roads, residential area, etc), configuration of topography (elevation map), and wildland fuel bed data. Furthermore, history forest fire data are also collected for comparing study. Based one Rothermel’s fire behavior model (Rothermel, 1971), the rate of fire spreading can be calculated from following expressions:. RS = f ( fuel _ particle, fuel _ array _ arrangement , wind , fuelmoisture) or R = A × K f × K mt × K g × K w Where: A is an empirical parameter, a combination invariable that decided only by the fire environment; K f is a value that decided by fuel bed; K mt is a value that decided by the weather (air temperature and air humidity); K g is a value that decided by the configuration of topography; K w is a value that decided by the wind.. The Java fire spread model is enclosed with a Web GIS and run on a two CPU Dell server computer. The Web GIS here we chose is ESRI ArcIMS®3.0. Microsoft™ Internet Information Server4.0 (IIS) run on a Microsoft™ Windows NT Server platform to handle request from client side. A Java class (Wildfire growth model) HTML page 6.
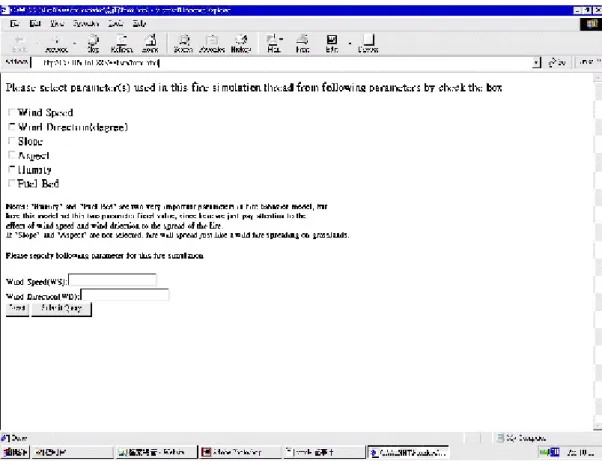
(7) will handle the fire simulation runtime parameters initialization and wildfire behavior simulation presenting. The last part of the client side user interface is a user comments submitting form. Once the users get general knowledge about the study area environment and some issues. of the problem/project, end user may specify the runtime parameters and then carry out a wildfire simulation in the virtual studio with following tools shown in figure 6 and wildfire simulation result will be sent back to the end user and displayed as thematic map as shown in figure 7.. Figure 6. Forest fire simulation runtime environment parameters initializing page.. 7.
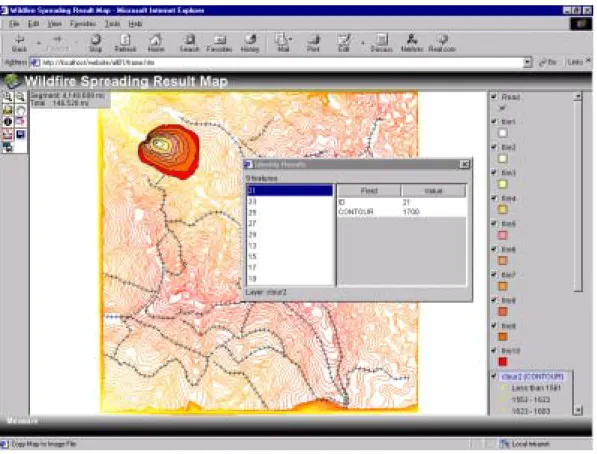
(8) Figure 7. Forest fire simulation result map displaying and feature query interface. The results of public participation may appear in various forms --- letters, comments at meetings, responses to questionnaires --- and the problem arises how these should be compared. For a spatial referenced project/problem, there may be one more kinds of result: draft plan map. Therefore, besides an online guest books to serve for textual comments and suggestion, this virtual studio contain a graphical comments submitting panel A set of tools on this panel enable users to overlay related database stored in their local computer. With the graphical comments submitting panel, three types of graphics may be drawn and submitted by the end user: pint, line and polygon. These graphical comments is then coded with Extensible Markup Language (XML) and transferred to the server side. The planner and server as reference in draft plan revising will collect these comments. 3.3 A Distributed Multi-User Virtual Country Park Environment. The Web are new media for not only geospatial data analysis and model simulation, but communication and collaborative work among distributed multi-users as well. Using the Shing Mun contry park as an example, this case study is to design and develop a multi-user distributed virtual environment. The virtual environment enables the public to use standard Web browsers and VRML viewers to take part in areas such as planning, policy-making, protection of ecological systems and development of the tourism industry. The Shing Mun Country Park is located in Hong Kong New Territories Region, and covers a total of 1400 hectares (Country Parks, 2001; Wang, 1998). This paper employs a client/server structure, Java, Java EAI and VRML97 to design the VirtualPark architecture. The Server-side applications, as shown in Figure 8, include a VRML generating server, a data query and 8.
(9) analysis server, and a multi-user managing server. When a client-side user navigates a large geographical space, the VRML generating server will constantly receive users’ requests and retrieve corresponding data from a data base server. The server will then produce a new VRML world and transfer it to the client-side. The data query and analysis server handles geographical. Sever-Side. Http Server (TCP/IP Protocol). data queries by connecting with the database server, and spatial data analyses such as viewshed acquiring, buffer analysis and network analysis. The multi-user managing server retrieves and forwards messages and information about the user's name, position and orientation from and to online users.. VRML World Generating Server Data Query and Analysis Server Multi-User Managing Server Data Base Server. the Internet. Client-Side. Web Browser. Web Browser. VRML Browser. VRML Browser. Java Applets. Java Applets. Figure 8. Framework of distributed, multi-user, virtual environments For the communication among distributed users, a text-based chatting dialogue is designed. In an addition, avatars, 3-D graphics to represent human bodies and body behavior in 3-D virtual space, are used for social interaction among online users. The locations and orientations of avatars change depending on viewpoint positions and view directions. VRML is often used to model avatars. Users can freely select their avatars, with their choices leading to different perception, cognition, and social behavior in each user. Figure 9 demonstrates the system prototype, VirtualPark. The interface of VirtualPark comprises four major windows. The upper left hand window in Figure 9 is a 3-D world viewing window, the upper right hand window for choosing parameters of spatial and thematic levels and thematic type, and. for data query and object addition/removal, the bottom-left window for talking among online users and the bottom-right window for displaying a 2-D map of the virtual country park, which closely connects with the 3-D world viewing window.When VirtualPark is started, every user needs to choose her/is own avatar. Distributed users interact and communicate through avatars and text-based dialogue. For instance, the bottom-left window in Figure 9 shows the chat content among the three online users. And there are two 3-D avatars in the 3-D world viewing window that represent online user names, current positions of their view points and viewing directions. According to the performance of users’ specific computers and the data transfer speed of the Internet, users can setup appropriate spatial and thematic levels for a 9.
(10) rapid 3-D graphics rendering and interaction in (near) real time. For example, the 3-D virtual world in Figure 9 describes the terrain of the Shing Mun Country Park with the spatial level set at 1. Also, different thematic models can be added in 3-D, virtual space. In Figure 9, a water theme. organized in an entity-based model was selected, and it is viewable in the 3-D world viewing window. In terms of thematic aspect of topographical landscape models, specific thematic levels may also be selected. But thematic level selection is effective only for field-based thematic models.. Figure 9. A distributed, 3-D, multi-user virtual environment, VirtualPark In the VirtualPark, coordinate measurement and data query can be conducted. In the 3-D world, users may use the mouse to measure the co-ordinates of any point. The top-right output window shows the co-ordinates ( x, y, z ) of selected points. The VirtualPark can allow users to add or remove 3-D objects directly in the 3-D scene. The added/removed objects can be shared, i.e., when a user adds/removes an object in the 3-D world, other online users can also see it. As shown in Figure 9, many trees were added to the virtual park. This functionality of the VirtualPark, together with avatarbased and text-based communication among online users, allows remote collaborative work in the virtual country park to be easily and effectively carried out.. 4. CONCLUSION. The Internet and the World Wide Web enable the public convenient access to geographic data, to easily implement spatial data analyses, to conduct model simulation and visualization, and to participate in resource management, environmental protection, regional planning and decision making. In this paper, we introduce the concept of VGE. VGE are virtual space and place based complicated systems in cyberspace. VGE can be a platform allowing the general public to carry out varied activities. Three cases are presented for the public participation. The first case is to study the web-based public participation in visual 10.
(11) impact assessment of urban landscape through the application of spatial data analytical functions, especially the viewshed analysis, of distributed Arc/View GIS. The second case focuses on the public participation in an ecological planning via a wildfire model-driven virtual studio on the Internet. The last case is to discuss the communication and interaction among distributed multiple users in a 3D virtual shared space over the Internet via the experiment of a VRML/Java based virtual environment for the country parks in Hong Kong. Throughout the design, development, and applications of three system prototypes, we explore the key techniques to the integration of online-GIS, model geo-computation, 3D visualization, and distributed virtual environments for the public participation. We identify (and consider) that distributed, multi-user, geographic model-driven 3D virtual geographic environments are powerful platforms for the general public participation in urban and ecological planning and decisions, and in supporting regional sustainable development across the Internet. ACKNOWLEDGEMENT. This research is partially supported by the Research Grants Council of Hong Kong government under RGC earmarked research grant No. CUHK 4132/99H and No. CUHK 4334/98E. REFERENCES. Active Worlds, 2000, http://www.activeworlds.com/. Al-Kodmany, K., 1999. Using visualization techniques for enhancing public participation in planning and design: process, implementation, and evaluation, Landscape and Urban Planning, 45 :37-45.. Arthur, L.M., Daniel, T.C., and Boster, R. S., 1997. Scenic assessment: an overview, Landscape Planning, 4. Carey, R. and Bell, G., 1997. The Annotated VRML 2.0 Reference Manual, AddisonWesley Developers Press, 501pp. Country Parks, 2001, http://parks.afcd.gov.hk/. Gore, A., 1998. The Digital Earth: Understanding our planet in the 21st Century, given at the California Science Center, Los Angeles, California, on January 31, 1998, http://www.digitalearth.gov/VP1998013 1.html. Green, D. R., 1997. Cartography and the Internet, The Cartographical Journal, 34(1): 23-27. Lin, H., and Gong, J.H., 2001. Exploring Virtual Geographic Environments. Geographic Information Sciences. Vol. 7, No.1, 1-7. Lin,H., Gong, J. H., and Wang, F., 1999. Web-Based Three-Dimensional GeoReferenced Visualization, Computers&Geosciences, 25(10): 11731181. Marrin, C., 1997. Proposal for a VRML 2.0 Informative Annex: External Authoring Interface Reference, 21.1.97, http://vrml.sgi.com/movingworlds/spec/ExternalInterface.html. Oh, K.,1994. A perceptual evaluation of computer-based landscape simulations, Landscape and Urban Planning, 28. Plewe, B., 1997. GIS-Online: Information Retrieval, Mapping, and the Internet, Santa Fe, NM, OnWord Press,215-252. Rothermel, R.C., 1971. A Mathematical Model for Predicting Fire Spread in 11.
(12) Wild Land Fuels. USDA Forest Service, Research Paper INT-115, Intermountain Forest and Range Experiment Station, Ogden, Utah. Rohrer, R. M., and Swing, E., 1997. Webbased Information Visualization, IEEE Computer Graphics and Applications, July/August, 53-59. Susskind, L. E., 1994. Director, MITHarvard Public Disputes Program. MIT, Cambridge, MA. from Public Participation in Environmental Decision making. Wang, F. Y., 1998. Functions of country parks in the development of Hong Kong, in Proceedings, China and the World in the 21st Century, an International Workshop on Geography ,the Chinese University of Hong Kong, Hong Kong, China,17. Yu, K., 1996. Security patterns and surface model in landscape ecological planning, Landscape and Urban planning, 36: 1-. 17.. 12.
(13)
數據


+5


相關文件
Provisional Final Draft of the BAFS New Senior Secondary.. Curriculum and
This paper briefs Members on the way forward for harmonisation of kindergartens (KGs) and child care centres (CCCs) in the light of the public and operators’ views on the
In the context of public assessment, SBA refers to assessments administered in schools and marked by the student’s own teachers. The primary rationale for SBA in ICT is to enhance
Microphone and 600 ohm line conduits shall be mechanically and electrically connected to receptacle boxes and electrically grounded to the audio system ground point.. Lines in
NSS Visual Arts Curriculum in Homantin Government Secondary School. Form First Term Secondary
For the items of ―identity recognition‖ and ―education outreach‖, it can he improved by the promotion of public art education and make the life aesthetics take root in
(1996) A Survey of the Assessment Center Process in the Public Sector, Public Personnel Management,
T., “The qualitative habitat evaluation index (QHEI), rationale, methods, and application,” Ohio EPA, Division of Water Quality Planning and Assessment, Ecological Assessment
