Kuo, Y. -F. and Chen, P. -C. (2006),Selection of mobile value-added services for system operators using fuzzy synthetic evaluation, Expert Systems with Applications, 30(4), pp. 612-620.
Selection of mobile value-added services for system operators using
fuzzy synthetic evaluation
Abstract
Following deregulation of the mobile phones market and liberalization of the telecommunications sector, the service sector for mobile phones is becoming increasingly saturated. Telecom operators are confronted with a sluggish user growth rate and a fall in the average revenue per user (ARPU). Mobile value-added services are expected to form mobile operators’ strategy to make up for the dwindling revenues obtained from users. The purpose of this study is to provide an analytical tool to select the best mobile value-added service firm providing the most customer satisfaction. This study adopts a fuzzy synthetic evaluation method, using an analytic hierarchy process (AHP) to evaluate the performance of mobile value-added services system operators. This method can help consumers select the appropriate firm from the other consumers’ opinions, and can help telecom operators to understand the market status of mobile value-added services as well as the prevailing consumer patterns.
Keywords: Mobile commerce; Mobile value-added service; Analytic hierarchy process (AHP); Fuzzy synthetic evaluation
1. Introduction
With the vigorous global development of the wireless telecommunications and cellular phones sector, mobile commerce (m-commerce) is now attracting significant interest. M-commerce refers to e-commerce activities carried out using a mobile
device such as a cellular phone or PDA. With new technology, m-commerce will soon become part of everyday life, promising to provide information anywhere and anytime. Once the technologies have matured, they will be easily available and not considered as a luxury. Following telecommunications liberalization in Taiwan, the development of mobile telecommunications continues to grow rapidly. The mobile telecom sector is going through a difficult period, and operators need to modify their business models to survive and increase market penetration. With over 107% penetration (DGT, 2003), Taiwanese mobile operators are finding expansion difficult. The major challenge concerns providing benefits to the customer. The decline would be steepest in voice communication. Due to the success of Japan’s NTT DoCoMo providing the i-Mode of mobile value-added services, current operators perceived it to be invaluable and started offering a similar service. Hence, to combat revenue losses and increase the average revenue per user (ARPU), mobile operators are turning to value-added services. However, this approach has gradually saturated the mobile telecommunications service sector and intensified competition within it. Enterprises planning to offer m-commerce services must be aware of the primary concerns of customers to raise the adoption of mobile value-added services and thus raise the ARPU. Thus, this study first used the analytical hierarchy process (AHP) to build up the priority weights of mobile value-added services to understand consumers’ preferences. The performance of six GSM (global system for mobile communication) telecom firms (Chunghwa Telecom, Taiwan Cellular Corp., Far Eastone Telecommunications, KG Telecom, Mobitai Communications and TransAsia Telecommunications) in Taiwan was studied using fuzzy synthetic evaluation to discover consumer choices. Taiwan, with its excellent telecommunications infrastructure, can succeed in mobile Internet technology. With a mobile phone penetration rate of 107%, Taiwan is an ideal site for this study, which explores the preference items associated with the selection of telecom operators among college
students. The analytical results will be useful to practitioners in the telecommunication sector in formulating appropriate polices on value-added services.
The remainder of this study is structured as follows. Section 2 reviews related studies, particularly on mobile commerce and mobile value-added services. Section 3 describes the research method. Section 4 lists the analytical results and discusses their implications. Conclusions are finally drawn in Section 5.
2. Mobile commerce and mobile value-added services
The development of wireless telecommunications technology and the Internet, along with its widespread applications in e-commerce, has led to the emergence of a new and developing business venture known as mobile commerce (m-commerce). The role of m-commerce in a wireless bandwidth transmission mode is to exchange merchandise, services, information and knowledge (Gunasekaran & Ngai, 2003). Thus, m-commerce naturally extends e-commerce. The values provided by both e-commerce and m-commerce are complementary (Clarke, 2001). M-commerce not only extends the benefits of the Web, but also allows unique services and additional benefits when compared to traditional e-commerce applications (Tsalgatidou & Pitoura, 2001). The major differences between e-commerce and m-commerce are that m-commerce provides for significant new added value in mobility/ubiquity, personalization, convenience, and tracking/location are explained as follows:
(1) Mobility/ubiquity: Giving users access to a mobile device at any time and place for them to use the m-commerce services and to obtain desired information. This feature is the most obvious benefit of a wireless terminal (Muller-Veerse, 1999; Clarke, 2001; Keen & Mackintosh, 2001; Siau, Lim & Shen, 2001; Tsalgatidou & Pitoura, 2001).
(2) Convenience: Mobile terminal are clearly convenient. Mobile devices store data, are always at hand and are increasing easy to use. The development of wireless
devices allows the mobile user to engage in activities simultaneously and obtain first-hand information (Muller-Veerse, 1999; Clarke, 2001; Keen & Mackintosh, 2001; Siau, Lim & Shen, 2001; Tsalgatidou & Pitoura, 2001).
(3) Personalization: Mobile devices are typically used by individuals, and are therefore ideal for individual-based target marketing. Additionally, m-commerce applications can be personalized to denote information or provide services in ways appropriate to a specific user (Muller-Veerse, 1999; Clarke, 2001; Siau, Lim & Shen, 2001; Tsalgatidou & Pitoura, 2001). This functionality can improve CRM (customer relationship management), thus encouraging transactions while preventing users from switching to different services.
(4) Tracking/location: GPS (global positioning system) enables the exact location of the user to be tracked (Muller-Veerse, 1999; Clarke, 2001; Tsalgatidou & Pitoura, 2001). For instance, LBS (location-based services) can be offered based on the location of the mobile device through indexing and guidance services (Coursaris, Hassanein & Head, 2003).
Wireless networks need to strengthen the 4C (convenience, customization, cost effectiveness, and cast iron security) characteristics of the customers (JP Morgan, 2000), and must also provide timely information, enabled simple transactions, and location-based services (Forrester Research, 1999). Mobile value-added services combine the characteristics of mobile telephones and the Internet (Lee, 2003). Shih (2003) defined mobile value-added service as, “The addition of digital services (excluding voice services) to the basic mobile phone network, such as games, image download, ringing tones download, messages, coupons and electronic transactions.” Mobile value-added services can bring the five values to consumers: “time-critical needs and arrangements”, “spontaneous needs and decisions”, entertainment needs”, “efficiency needs and ambitions” and “mobility-related needs” (Anckar & D’Incau, 2002). Generally, the applications of mobile value-added services are divided into the
following four categories (Miller-Veerse, 1999; Varshney & Vetter, 2002; Coursaris, Hassanein & Head, 2003):
(1) Mobile communication services: Provides telecommunication services such as SMS (short message service), e-mail and MMS (multimedia messaging service). Mobile communication services are presently the most successful applications of value-added services. After raising the telecommunications bandwidth, operators immediately started promoting e-mail and image messaging services to anticipate the coming of the third generation (3G) of telecommunication services that will integrate the images and sound of multimedia messages.
(2) Mobile entertainment services: Provides users with entertainment application services, such as the downloading of ringing tones, images, and games. Mobile entertainment is only the second major achievement of mobile value-added service applications on mobile telecommunications. The combination of mobility and entertainment appears intuitively appealing for many customer segments due to the chance to kill time and have fun when wired entertainment appliances are inaccessible.
(3) Mobile transaction services: Provides users with business and banking services, such as mobile shopping, mobile banking and on-line ticketing. This service does not require complex technology. In a GSM telecommunication environment, the STK (SIM tool kit) card is needed for telecommunications to provide mobile transaction services. A cellular phone, being a personal mobile device product, contains a SIM (subscriber identity module) card that is more difficult to reproduce than a credit card. The future introduction of Java cards will even increase the level of safety. The possible combination of the features of both SIM and Java cards is likely to prove to be very beneficial to enterprises providing mobile transaction services.
such as breaking news, stock quotes, street maps and parking space locations. Significantly, mobile information services can provide users with prompt news delivery. Additionally, the positioning system can locate the user exactly. A fee is attached to this service, thereby making it particularly lucrative.
3. Research method
3.1 Analytic hierarchy process (AHP)
Given a rapidly changing environment, decision makers confer that level changes add to multiple complexities. To solve this problem, Saaty (1980) developed the analytic hierarchy process (AHP). The AHP is an intuitively simple method, which formulates and analyzes decisions by simplifying a complex multi-criteria decision problem. AHP uses the numerical ratings from the pairwise comparisons to establish a priority or importance weight for each criterion. Numerous applications of AHP have been made, as evidenced by its use in many problems such as planning (Poh & Ang, 1999), setting priorities (Stam & Duarte, 2003), choosing the best policy alternatives (Byun, 2001; Tam & Tummala, 2001; Lai, Wong, & Cheung, 2002; Ngai, 2003), allocating resources (Ramanathan & Ganesh, 1995), evaluating performance (Frei & Harker, 1999) and ensuring system stability (Fahmy, 2001). AHP allows decision-makers to make qualitative decisions objectively, and enables systematic decision-making by expressing the interaction and hierarchy of factors, thus reducing the risk of a rough estimation. Hence, this study adopted AHP to analyze consumer preferences in mobile value-added services.
The three steps of AHP are decomposition, comparative judgment and synthesis. In the first step, a hierarchical structure is established to present the problem. The next step compares factors at the same level in pairs and measures their comparative contribution to the main objective. A comparison matrix was set up by comparing pairs of criteria or alternatives. A scale of values ranging from 1 (equally important) to
9 (extreme more important) was used to express evaluators’ preferences. This pairwise comparison enabled the decision-maker to measure the contribution of each factor to the objective independently, thereby simplifying the decision-making process. The final step conducts synthesis of priorities to calculate a composite weight for each alternative, based on preferences derived from the comparison matrix.
3.2. Fuzzy synthetic evaluation
Fuzzy theory (Zadeh, 1965) was developed to provide decision-making capabilities in the presence of imprecise and uncertain information, which is usually expressed in linguistic terms. The theory has been successfully applied to many fields. An important application of the fuzzy transform used in developing the extension principle is synthetic evaluation. Fuzzy synthetic evaluation uses fuzzy mathematics to transform and fathom unclear data, and has various attributes concerning evaluation of objects. Thus, a comprehensive assessment and general appraisal must be performed on related factors to produce the overall assessment.
Suppose that domain
U
={
u1,u2,…,un}
denotes a set of evaluated factors (i.e.,mobile value-added service items in this study);
V
={
v1,v2,…,vm}
denotes a set ofevaluation grades, and v denotes a probable evaluation which can be described as i excellent, good, normal, poor or very poor. Every appraisal object has a fuzzy relation matrix R~ from
U
toV
. = = × × m n n n m m m n ij r r r r r r r r r r R L M O M M L L 2 1 2 22 21 1 12 11 ) ( ~ ,where rij denotes the membership degree (i=1,2,…,n; j=1,2,…,m), where the appraisal
object is measured as vj considering attribute ui.
If N appraisal commissioners make appraisal vj aiming at various factors in U
determine ui as vj, then the sum of each list of numbers in the table equals N.
If ij xNij
r = , then the appraisal matrix of the commissioners to a certain telecom operator is obtained as R~=(rij)i×j. However, the obtained appraisal matrix R~ is not enough to appraise the operator yet; a fuzzy subset W~ in
U
, called weight set, thatis, W~=(w1, w2,…, wn), in which wi>0, and
∑
wi=1, should be obtained from the AHP.The weight W~ denotes the relative importance of the various evaluated factors expressed by the decision-makers (i.e., mobile value-added services users in this study). Moreover, a fuzzy subset D~ in
V
, called the decision-making set, is alsointroduced, and denotes the overall fuzzy appraisal of the commissioner to the telecom operator, D~=W~。 R~=[ d1 d2 … dm], ( ) 1 ij i n i j w r d =
∑
∗ = , j=1,2,…,m.3.3 Questionnaire and data collection
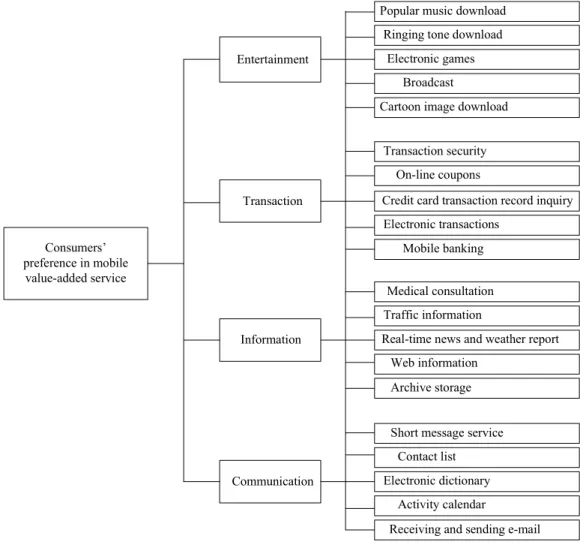
First, experts were interviewed to create the research model and questionnaire. To set up the evaluation criteria for analytic level construction, this study designed the first questionnaire. According to literature (Muller-Veerse, 1999; Varshney & Vetter, 2002; Coursaris, Hassanein & Head, 2003) and mobile value-added services provided by Japan’s NTT DoCoMo i-mode and Taiwan’s current operators, the mobile value-added services are divided into four categories including communication, information, transaction and entertainment. The semi-open questionnaire consisted of 13 service items in the communication category; 12 service items in information; 12 service items in transactions, and 11 service items in entertainment category. Interviewers could add another service item to each category. A nine-point Likert scale ranging from 1 (least important) to 9 (most important) was adopted. Ten experts were interviewed to formulate the hierarchy with the evaluation category and the service items for each category. From many mobile value-added service items, Saaty
(1980) and Miller (1956) pointed out that human beings can simultaneously compare up to seven items. Thus, each level's set of mobile value-added service elements does not exceed seven items. Furthermore, each category of mobile value-added services can be cut down to 5 items using a geometric mean. Figure 1 shows the analytic hierarchy structure. Entertainment Communication Transaction Medical consultation Archive storage Web information
Real-time news and weather report Traffic information
Ringing tone download Popular music download
Electronic games Broadcast
Cartoon image download
Information
Transaction security On-line coupons
Credit card transaction record inquiry Electronic transactions
Mobile banking
Short message service Contact list Electronic dictionary
Activity calendar
Receiving and sending e-mail Consumers’
preference in mobile value-added service
Fig. 1. The AHP model
The second questionnaire (AHP questionnaire) was designed according to the analytic hierarchy structure. The various factors under each level in the questionnaire were compared pairwise, producing values from 1 to 9 scale ratings.
According to the investigation report of E-ICP, Eastern Online (2004), 45% of the mobile value-added service users in Taiwan are from age 20 to 29 years old. In terms of occupation, 34% of such users are students. Accordingly, college student
were taken as the subjects for this study. The 350 questionnaires were issued to the students of three Taiwan major universities face-to-face, and 296 questionnaires were filled out and returned, so the response rate was 84.57%. After deducting 32 invalid questionnaires, the number of valid questionnaires was 264, giving a valid response rate of 75.43%.
4. Research results and numerical example
According to the second questionnaire investigation, the data of every questionnaire were used to set up the pair comparison matrix, then input into AHP software package (Expert Choice) for analysis. The eigenvalue and eigenvector of every pair comparison matrix was determined, and then the CR (consistency ratio) of all levels was calculated. If, for any questionnaire, CR>0.1, then the questionnaire was eliminated. Subsequently, the other valid questionnaires were collected and arranged by determining the geometric mean, and then the integrated CR was checked. If CR<=0.1, then the degree of consistency is satisfactory. If CR of the whole hierarchy structure is too high, then the correlation of hierarchy structure factors is poor and needs to be rebuilt. Tables 1 and 2 show the weights of various factors in each level, which is the weight set W~ of fuzzy synthetic decision computed using AHP. The pair comparison matrix CR of overall evaluation factors was 0.00410, which is less than 0.1, within the acceptable range. The pair comparison matrix CR of entertainment, transaction, information and communication were 0.00389, 0.00484, 0.00306, and 0.00425 respectively, which are all less than 0.1, within the acceptable range.
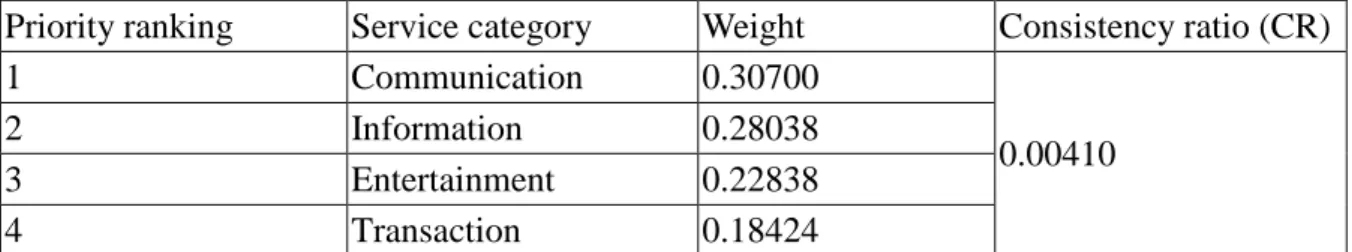
Table 1 Priority ranking and weights of mobile value-added service categories
Table 2 Weights of mobile value-added service items
Service category Service item Weight Consistency ratio (CR)
Entertainment
Popular music download 0.27770
0.00389 Ringing tone download 0.20489
Electronic games 0.16698
Broadcast 0.19562
Cartoon image download 0.15482
Transaction
Transaction security 0.41317
0.00484
On-line coupons 0.12556
Credit card transaction record
inquiry 0.16068 Electronic transactions 0.14992 Mobile banking 0.15066 Information Medical consultation 0.20066 0.00306 Traffic information 0.23874
Real-time news and weather
report 0.15264
Web resources 0.19889
Archive storage 0.20908
Communication
Short message service 0.34417
0.00425
Contact list 0.25201
Electronic dictionary 0.13265 Activity calendar 0.13239 Receiving and sending e-mail 0.13877
According to Table 1, the priority ranking of mobile value-added service categories is as follows: communication > information > entertainment > transaction. Hence, consumers clearly value communication abilities, which were ranked highly in weight over the other three types. Thus, telecom operators must provide multiple and clear communication services. Furthermore, information services were also found to be important. Entertainment ability ranked third, while transaction service ranked last, Priority ranking Service category Weight Consistency ratio (CR)
1 Communication 0.30700
0.00410
2 Information 0.28038
3 Entertainment 0.22838
since if the most fundamental communication function can not satisfy consumers, then information, transaction and entertainment functions cannot possibly convince consumers to use the company’s mobile value-added services.
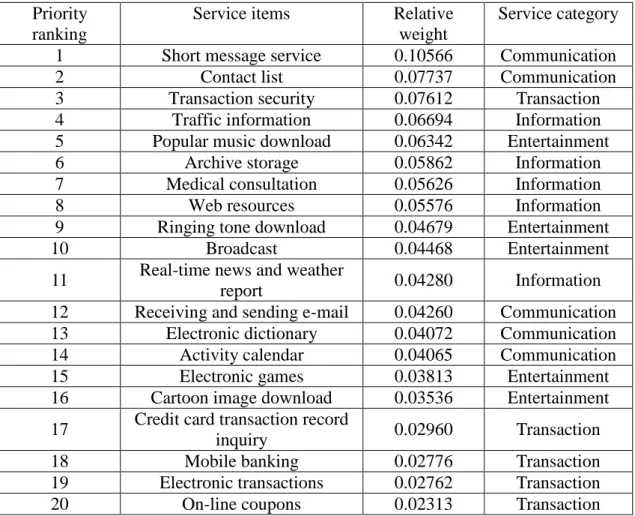
Table 3 summarizes the results of Tables 1 and 2. The weight rankings on Tables 2 and 3 clearly show that sending short messages, contact lists, transaction security, traffic information and popular music downloads are the most important items among mobile value-added services. The three lowest-ranking items are on-line coupons, electronic transactions and mobile banking. This finding shows that in the present busy commercial society, using short messages to contact close friends is already a popular trend. Thus, telecom operators, other than needing to satisfy consumers’ basic communication needs, must also allow the consumers to review personal messages. Such services increase the user rate of mobile phones. Contact lists on cellular phones are popular as they enable users to contact and search for friends. Transaction security is the most important service in transaction category, but it is still a challenge for telecom operators. GPRS system development, combined with location-based services, allows users to get traffic information easier. This feature is very useful for of consumers who need to search for traffic situations, taxis, parking information and electronic maps. Thus, this service is the most important in information category. For the popular music download, from the improvement on cellular phone ringing tones, popular music download is currently one of the most welcomed entertainment service items.
Table 3 Priority ranking and relative weights of mobile value-added service items Priority
ranking
Service items Relative weight
Service category 1 Short message service 0.10566 Communication
2 Contact list 0.07737 Communication
3 Transaction security 0.07612 Transaction
4 Traffic information 0.06694 Information
5 Popular music download 0.06342 Entertainment
6 Archive storage 0.05862 Information
7 Medical consultation 0.05626 Information
8 Web resources 0.05576 Information
9 Ringing tone download 0.04679 Entertainment
10 Broadcast 0.04468 Entertainment
11 Real-time news and weather
report 0.04280 Information
12 Receiving and sending e-mail 0.04260 Communication 13 Electronic dictionary 0.04072 Communication
14 Activity calendar 0.04065 Communication
15 Electronic games 0.03813 Entertainment
16 Cartoon image download 0.03536 Entertainment 17 Credit card transaction record
inquiry 0.02960 Transaction
18 Mobile banking 0.02776 Transaction
19 Electronic transactions 0.02762 Transaction
20 On-line coupons 0.02313 Transaction
According to Table 2, the weight sets 1 ~ W , 2 ~ W , 3 ~ W and 4 ~ W , on entertainment, transaction, information and communication respectively, were as follows:
[
0.27770 0.20489 0.16698 0.19562 0.15482]
~ 1 = W ,[
0.41317 0.12556 0.16068 0.14992 0.15066]
~ 2 = W ,[
0.20066 0.23874 0.15264 0.19889 0.20908]
~ 3 = W and[
0.34417 0.25201 0.13265 0.13239 0.13877]
~ 4 = W .Suppose that a particular user wishes to use mobile value-added services but has no idea which operator provides the best service or which operator can satisfy his/her needs. Thus, the consumer adopts an investigation method that best assesses the mobile value-added service and the service quality of every telecom operator, while also familiarizing himself with the field experts, in order to find the advantages and
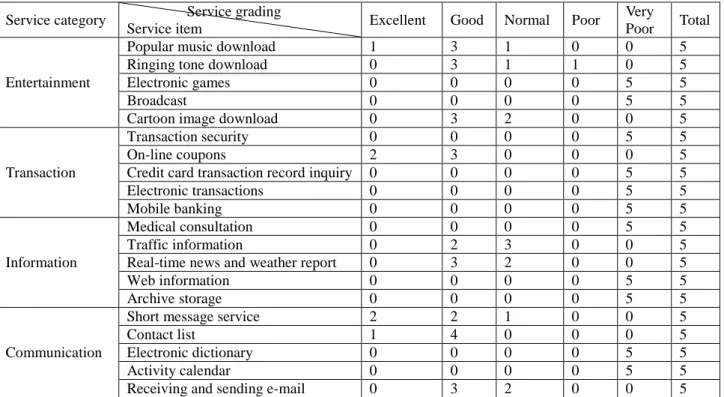
disadvantages even before a field expert makes a recommendation to the consumer. In this study, five experts who are familiar with both mobile value-added services and telecom operators evaluated the performance of telecom operators. If the operator did not provide a particular service, its grading for this service item was “very poor”. Table 4 below uses Chunghwa Telecom as an example to illustrate an evaluation of a field expert’s opinion.
Table 4 Experts’ judgments of mobile value-added services in Chunghwa Telecom
Service category Service grading
Service item Excellent Good Normal Poor
Very
Poor Total
Entertainment
Popular music download 1 3 1 0 0 5
Ringing tone download 0 3 1 1 0 5
Electronic games 0 0 0 0 5 5
Broadcast 0 0 0 0 5 5
Cartoon image download 0 3 2 0 0 5
Transaction
Transaction security 0 0 0 0 5 5
On-line coupons 2 3 0 0 0 5
Credit card transaction record inquiry 0 0 0 0 5 5
Electronic transactions 0 0 0 0 5 5
Mobile banking 0 0 0 0 5 5
Information
Medical consultation 0 0 0 0 5 5
Traffic information 0 2 3 0 0 5
Real-time news and weather report 0 3 2 0 0 5
Web information 0 0 0 0 5 5
Archive storage 0 0 0 0 5 5
Communication
Short message service 2 2 1 0 0 5
Contact list 1 4 0 0 0 5
Electronic dictionary 0 0 0 0 5 5
Activity calendar 0 0 0 0 5 5
Receiving and sending e-mail 0 3 2 0 0 5
Table 4 shows the entertainment, transaction, information and communication categories of the Chunghwa Telecom and their respective evaluation matrices R , ~A1
2 ~ A R , R~A3 and R~A4: = 0 0 4 . 0 6 . 0 0 1 0 0 0 0 1 0 0 0 0 0 2 . 0 2 . 0 6 . 0 0 0 0 2 . 0 6 . 0 2 . 0 ~ 1 A R
= 1 0 0 0 0 1 0 0 0 0 1 0 0 0 0 0 0 0 6 . 0 4 . 0 1 0 0 0 0 ~ 2 A R = 1 0 0 0 0 1 0 0 0 0 0 0 4 . 0 6 . 0 0 0 0 6 . 0 4 . 0 0 0 0 6 . 0 4 . 0 0 ~ 3 A R = 0 0 4 . 0 6 . 0 0 1 0 0 0 0 1 0 0 0 0 0 0 0 8 . 0 2 . 0 0 0 2 . 0 4 . 0 4 . 0 ~ 4 A R
Then, Chunghwa Telecom’s decision-making sets D , ~A1 D~A2, D~A3and D~A4, on entertainment, transaction, information and communication respectively, are as follows: 1 1 1 ~ ~ ~ A A W R D = o =
[
0.05554 0.38245 0.15845 0.04098 0.36260]
= = 2 2 2 ~ ~ ~ A A W R D o[
0.05022 0.07534 0.00000 0.00000 0.87443]
= = 3 3 3 ~ ~ ~ A A W R D o[
0.00000 0.26734 0.32470 0.00000 0.40797]
= = 4 4 4 ~ ~ ~ A A W R D o[
0.18807 0.42254 0.12434 0.00000 0.26504]
Defuzzification means calculate the crisp value of fuzzy number. The crisp value can approximately represent the deterministic characteristics of the fuzzy reasoning process based on the assessment matrix, and help convert the uncertainty into an applicable action when solving real world problems. The defuzzification way is as follows.
S D
K = ~o ~ , where
K is a defuzzification score, D~ is the decision making set, and S~ is the appraisal grade set. For instance, excellent, good, normal, poor and very poor can be defined in
appraisal grading as 100, 80, 60, 40 and 20, respectively. Using this scale, the Chunghwa Telecom score on entertainment, transaction, information, and communication were 54.5476, 28.5379, 49.0287, and 65.3714, respectively.
The performance measurement adopts a two-stage appraisal model, and should not defuzzify the fuzzy appraisal set to score in the first stage. The above computation is intended only discover easily each aspect of the telecom operator’s performance. Instead, the following steps should be followed. First, obtain the appraisal sets about entertainment, transaction, information and communication separately. Then, use the appraisal sets of the four main categories to compose the appraisal matrix. Then, use the weight sets of the main categories to calculate the final comprehensive appraisal set, which can then be defuzzified to the final score. According to the above appraisal set, the appraisal matrix of the Chunghwa Telecom in the second stage can be
obtained as 26504 . 0 00000 . 0 12434 . 0 42254 . 0 18807 . 0 40797 . 0 00000 . 0 32470 . 0 26734 . 0 00000 . 0 87443 . 0 00000 . 0 00000 . 0 07534 . 0 05022 . 0 36260 . 0 04098 . 0 15845 . 0 38245 . 0 05554 . 0 .
Combining the weight set in the second stage, the final comprehensive appraisal set of the Chunghwa Telecom is obtained as
=
A
D~
[
0.07967 0.30590 0.16540 0.00936 0.43967]
After defuzzification, Chunghwa Telecom’s final score is 51.5311.
Using the above-mentioned methods, the final synthesized evaluation of other companies can be obtained as follows:
Taiwan Cellular Corp. D~B =
[
0.09943 0.24705 0.20691 0.02195 0.42467]
Far Eastone Telecommunications
[
0.04220 0.29296 0.19653 0.00000 0.46831]
~ = C D KG Telecom D~D =[
0.07563 0.17841 0.22689 0.00000 0.51906]
Mobitai Communications D~E =[
0.01547 0.14222 0.30777 0.00000 0.51906]
TransAsia Telecommunications[
0.05353 0.17329 0.25412 0.00000 0.51906]
~ = F D
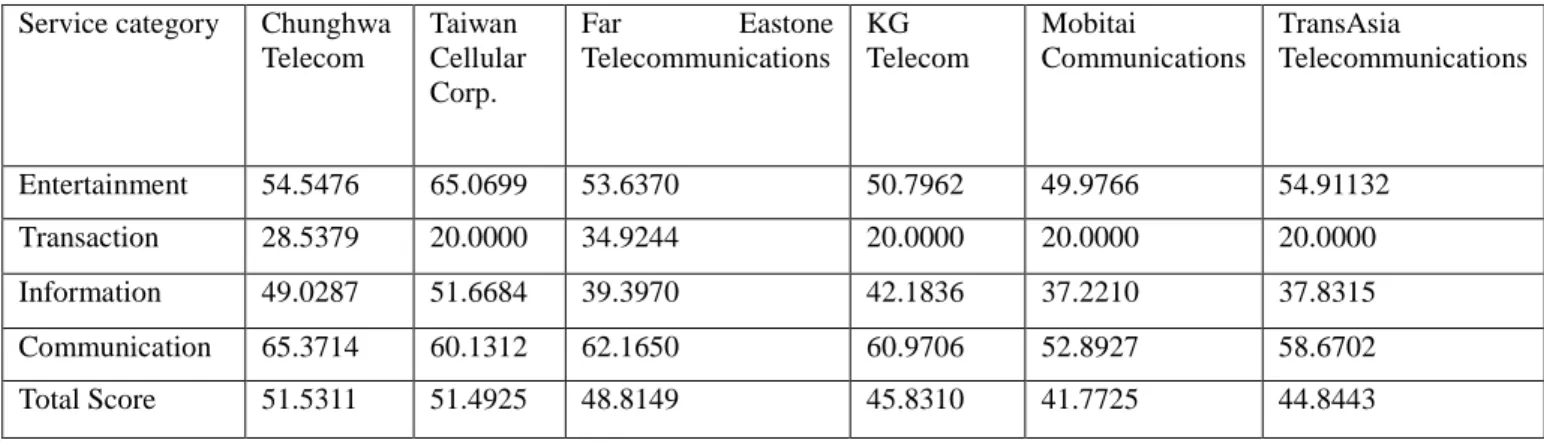
Table 5 shows the mobile value-added service scores in each category of these companies and their general classifications.
Table 5 Scores of service category for each telecom operator
Service category Chunghwa Telecom Taiwan Cellular Corp. Far Eastone Telecommunications KG Telecom Mobitai Communications TransAsia Telecommunications Entertainment 54.5476 65.0699 53.6370 50.7962 49.9766 54.91132 Transaction 28.5379 20.0000 34.9244 20.0000 20.0000 20.0000 Information 49.0287 51.6684 39.3970 42.1836 37.2210 37.8315 Communication 65.3714 60.1312 62.1650 60.9706 52.8927 58.6702 Total Score 51.5311 51.4925 48.8149 45.8310 41.7725 44.8443
Table 5 clearly indicates that the scores of the four entries show the advantages and disadvantages of telecom operator’s mobile value-added services. The analytical results show that the mobile value-added services on the communication and entertainment categories of the current telecommunication operators garnered a high score. The information and transaction categories are ranked 3rd and 4th respectively. Overall, Chunghwa Telecom is most preferred by consumers, followed by Taiwan Cellular, then Far Eastone Telecommunications. However, a big gap exists between the scores of KG Telecom, TransAsia Telecommunications and Mobitai Communications and those of the three leading telecommunication companies. These companies need to pour in more effort innovate if they want to be recognized by consumers and increase their competitiveness.
With regard to the examples featured in this study, it seems that consumers strongly prefer the entertainment mobile value-added services of Taiwan Cellular Corp over those of other providers. However, Chunghwa Telecom scored highest overall.
5. Conclusions
This study employed fuzzy synthetic evaluation to allow a telecommunications company to perform a self-assessment, while also using the consumer patterns to compare themselves with competitors. This self-assessment will not only improve service quality but it will also increase the utility rate of mobile value-added services. This study also gives the consumers an objective selection method for choosing the most appropriate telecommunications company, creating a win-win environment for both consumers and operators. The analytical results show that the consumers’ preferences on the four categories of the mobile value-added services are in the following order: communication, information, entertainment, and transaction. The weight rankings show that sending short messages, contact lists, transaction security, traffic information and popular music downloads are the most important items among mobile value-added services. The three lowest-ranking items are on-line coupons, electronic transactions and mobile banking. For the selection of system operators, Chunghwa Telecom is the first choice in overall mobile value-added services.
A final, yet significant point is that the results of this study are valid only for Chinese society, which is characterized by a very high penetration rate of mobile phones, and a very high adoption rate in terms of Internet usage. Eastern and Western societies have different cultural backgrounds which also affect the diffusion of IT-based communication in general (Straub, 1994) and the preferences for mobile value-added services. Therefore, demand for mobile value-added services differs around the world. Further empirical studies should be carried out in cross-cultural settings to widen knowledge of the near-future market potential for mobile value-added services.
References
Anckar, B., & D’Incau, D. (2002). Value creation in mobile commerce: findings from a consumer survey. Journal of Information Technology Theory and Application, 4(1), 43-64.
Byun, D. H. (2001). The AHP approach for selecting an automobile purchase model. Information and Management, 38(5), 289-297.
Clarke, I. (2001). Emerging value propositions for M-commerce. Journal of Business Strategies, 18(2), 133-147.
Coursaris, C., Hassanein, K., & Head, M. (2003). M-commerce in Canada: an interaction framework for wireless privacy. Canadian Journal of Administrative Sciences, 20(1), 54-73.
DGT (Directorate General of Telecommunications, Ministry of Transportation and Communications), Taiwan (2003). http://www.dgt.gov.tw.
E-ICP, Eastern Online (2004). http://www.isurvey.com.tw.
Fahmy, H. M. A. (2001). Reliability evaluation in distributed computing environments using the AHP. Computer Networks, 36(5-6), 597-615.
Forrester Research (1999). http://www.forrester.com.
Frei, F. X., & Harker, P. T. (1999). Measuring aggregate process performance using AHP. European Journal of Operational Research, 116(2), 436-442.
Gunasekaran, A., & Ngai, E. (2003). Special issue on mobile commerce: strategies, technologies and applications. Decision Support Systems, 35(1), 187-188.
JP Morgan (2000). GPRS research report. http://www.jpmorgan.com.
Keen, P. G. W., & Mackintosh, R. (2001). The Freedom Economy: Gaining the M-Commerce Edge in the Era of the Wireless Internet. Berkeley: Osborne/McGrew-Hill.
Lai, V. S., Wong, B. K., & Cheung, W. (2002). Group decision making in a multiple criteria environment: a case using the AHP in software selection. European
Journal of Operational Research, 137(1), 134-144.
Lee, L. Y. (2003). A Study on Mobile Internet Business Model. Master Thesis, Institute of Business and Management, National ChiaoTung University, Taiwan. Miller, G. A. (1956). The magical number seven plus or minus two: some limits on our
capacity for processing information. Psychological Review, 63, 81-97.
Müller-Veerse, F. (1999). Mobile commerce report. London: Durlacher Research Ltd, http://www.durlacher.com.
Ngai, E. W. T. (2003). Selection of web sites for online advertising using the AHP. Information and Management, 40(4), 233-242.
Poh, K. L., & Ang, B. W. (1999). Transportation fuels and policy for Singapore: an AHP planning approach. Computers & Industrial Engineering, 37(3), 507-525. Ramanathan, R., & Ganesh, L. S. (1995). Using AHP for resource allocation problems.
European Journal of Operational Research, 80(2), 410-417.
Saaty, T. L. (1980). The Analytic Hierarchy Process. New York: McGraw-Hill. Shih, C. W. (2003). A Study of the Consumer Behavior in Mobile Value-Added
Service – A Case of College Student in Central Area. Master Thesis, Department of Information Management, Da-Yeh University, Taiwan.
Siau, K., Lim, E. P., & Shen, Z. (2001). Mobile commerce: promises, challenges, and research agenda. Journal of Database Management, 12(3), 4-13.
Stam, A., & Duarte, S. A. P. (2003). On multiplicative priority rating methods for the AHP. European Journal of Operational Research, 145(1), 92-108.
Straub, D. (1994). The effect of culture on IT diffusion: e-mail and fax in Japan and the U.S. Information Systems Research, 5(1), 23-47.
Tam, M. C. Y., & Tummala, V. M. R. (2001). An application of the AHP in vendor selection of a telecommunications system. Omega, 29(2), 171-182.
Tsalgatidou, A., & Pitoura, E. (2001). Business models and transaction in mobile electronic commerce: requirements and properties. Computer Networks, 37(2),
221-236.
Varshney, U., & Vetter, R. (2002). Mobile commerce: framework, applications and networking support. Mobile Networks and Applications, 7(3), 185-198.