行政院國家科學委員會專題研究計畫 成果報告
企業系統效益長程追蹤分析
計畫類別: 個別型計畫 計畫編號: NSC93-2416-H-004-022- 執行期間: 93 年 08 月 01 日至 94 年 07 月 31 日 執行單位: 國立政治大學資訊管理學系 計畫主持人: 尚孝純 報告類型: 精簡報告 處理方式: 本計畫涉及專利或其他智慧財產權,2 年後可公開查詢中 華 民 國 94 年 10 月 31 日
企業系統效益長程追蹤分析 尚孝純 中、英文摘要 報告內容:請包括前言、研究目的、文獻探討、研究方法、結果與討論 計畫成果自評部份 計畫已發表論文
企業系統效益長程追蹤分析 尚孝純 摘要 本研究試圖去定義、解釋並追蹤導入企業系統的利益來源。企業系統是套裝應用 系統,在組織內外各個階層的活動提供完善的控管並將沒有效率的流程予以簡 化。由於企業系統的效益十分多樣,並發生在不同時間與組織各個層面, 不同時 點的片面分析無法有效全面瞭解系統效益,也難有效管理企業系統生命。所以研 究企業系統需要長程追蹤瞭解各時期的問題與原因,以有效規劃管理這項資產投 資。 本計畫採用一完整之企業系統效益架構,收集並分析企業在安裝企業流程整合 系統後三年中產生的效益與問題,製作長程效益變動圖,並分析各不同面向的 變動因素,提出提升企業流程整合效益的建議主張。主要研究問題包含: 1 企業系統如何產生效益,這些效益又在何時產生? 2 不同型態的效益間有無相關性? 3 為什麼會產生這些效益? 本專案依據既有文獻與現有研究成果分別對上述研究問題提出可能假設。在六 家製造公司的長期案例研究中,本研究發現 (1) 即使在同一間公司,企業系統 的利益可能會以不等的速度在相異面向中的不同流程中實現 ; (2) 企業系統 不同面向的利益彼此相依,一個面向的利益會帶動另一個面向的利益 ; (3)最 初的企業系統利益從改善企業和軟體間的整合開始,而接續下來的利益需要軟 體和流程的持續改善與提升。 本專案期望透過這樣的長程全面分析研究,可以有助未來對整合性應用軟體的 研究,並增進企業系統管理成效。其中,對企業系統在各不同時點與不同角度 的效益分析有助於澄清有關企業系統成敗的不同研究觀點。而本專案對企業整 合流程過程中的效益曲線與相關原因及管理要素的深入瞭解,則有助企業制訂 長程企業系統管理策略。 關鍵詞: 企業流程整合, 企業系統, 電子企業系統,企業資源規劃,客戶關係 管理,供應練管理,資訊系統效益
Tracking and Understanding Benefits from Enterprise
Systems
Shari S. C. Shang
Abstract
This project seeks to identify, explain and trace sources of benefits from the implementation of enterprise systems (ES). Enterprise systems are packaged
application software which provide seamless control of inter and intra organizational operations at all levels and streamlines inefficient processes.
By applying a comprehensive enterprise systems benefit framework and using a technique of perceived net benefit flow graphs in longitudinal case studies of
multiple organizations this study plans to analyze the benefit development paths and sources of benefits of different dimensions in the three years after an integrated process system is implemented. The questions that this project searches for answers are:
1. How do organizations realize net benefits from integrated processes and when are such benefits realized?
2. Are different categories of benefits independent of each other? 3. What are the probable causes of those perceived net benefits?
Through use of perceived benefit flow (PBF) graphs in longitudinal case studies of six manufacturing companies, this study concludes that (a) benefits from ES are likely to be realized at different rates for different core processes in different dimensions, even in the one company; (b) ES benefits of different dimensions are dependent on one another, with benefits in one dimension subsequently enabling benefits in other dimensions; and (c) initial ES benefits come from improving fit between the software and business, whereas later benefits are likely to require continuous modification and enhancement of both software and processes.
Keywords: enterprise systems, ERP, packaged enterprise application software, IS
Tracking and Understanding Benefits from Enterprise
Systems
Introduction
Business process integration has been the key enabler for increasing business competitiveness in the global business world. Enterprise systems (ES), also classified as electronic business systems (HBR 2003), include enterprise resource planning (ERP), customer relationship management (CRM), supply chain
management (SCM), product life cycle management (PLM), eProcurement software and other packaged enterprise application software provide seamless control of operations at all levels, and streamlines inefficient processes. The advantages of such integrated software have persuaded many organizations to invest in the
software in the expectation of beneficial process integration. Annual revenue for the enterprise systems vendors such as SAP, Oracle, PeopleSoft, Siebel, i2 and Ariba grew rapidly through the 1990s.
Today, annual revenue of the enterprise integration software vendors is estimated to be of the order of US$40B p.a.1. Further, with implementation costs of the order of five times that of software licence fees, worldwide investment in integrations software infrastructure is sufficiently important to warrant careful study.
The use of ES has a long life due to the evolving functionality and its infrastructure capability for business changes. During this long system life, benefits are found in many different areas such as: cost reduction, decision-making improvement or competition enabling. With constant changes in both the software and the business use, ES benefit realization is a continuous process with dynamics in multiple levels of organizational context. Snapshots of certain point cannot give the whole
understanding and therefore hard for management of detailed processes along the life. The benefit realization process of business integration needs to be tracked along the life, so that possible benefits and problems of different stages can be analysed, future benefits can be planned and implicit and explicit influences can be
recognized.
1
With the above concerns in mind, the focus of this project is on identifying and explaining the net benefits that organizations derive from their investments in enterprise systems in the years after “go live”. The questions the author seeks to answer are:
1. How do organizations realize net benefits from enterprise systems and when are such benefits realized?
2. Are different categories of benefits independent of each other? 3. What are the probable causes of those perceived net benefits?
Although the existing literature on ES success and benefits from ES (reviewed below) provides useful background thinking for this study, no study to date has presented in-depth answers to the above three research questions in a form that a management team might use for evaluating and improving outcomes from their own organization’s investments in ES. The goal of this project is therefore to dig deeper than prior research to answer the above questions.
Prior research
In this study, the focus is on benefits as perceived by senior management. Although poorly managed implementation projects can have a huge effect on benefits after go live (Seddon and Shanks 2003), the considerable body of prior research on ES implementation projects, e.g., Parr et al. (1999), Holland and Light (1999), Sumner (1999), Somers and Nelson (2001), 王怡心 (2001), 洪廣禮 (2001), Scott and Vessey (2002), 楊金福等 (2002), Umble et al. (2003), and Brown and Vessey (2003), 何應欽 許秉瑜(2003), 蔡文賢等(2003) does not have a lot to say about benefits from ES in the years after go live.
How do organizations realize net benefits from enterprise systems and when are such benefits realized? In one of the earliest studies of actual benefits from ES,
Deloitte Consulting’s (1998) study of 85 global companies, 90% with revenues over US$1 billion, reported both tangible benefits including cost savings (34% of firms) and faster processing (19%), and intangible benefits including improved information
responsiveness (20%). Other benefits such as labour, process and inventory cost savings, improved decision-making, and savings from dismantling legacy systems are also reported (Davenport 2000; Ross 1999). To build a comprehensive view of the ES benefits that an organization might expect to realize from ES, Shang and Seddon (2002) classified the benefits reported in 233 ERP-system success stories into the five main dimensions: operational, managerial, strategic, infrastructure, and organizational. The benefits categories from their study are discussed in more depth below.
In a recent study, Davenport et al. (2002) examined benefits from 191 large organizations that had invested in ES. What is interesting about the study is not so much its ten benefit categories—which are a subset of those identified by Shang and Seddon (2002)—but the details of percentages of firms claiming to have achieved at least some benefits in those dimensions. The seven types of benefit claimed by over 50% of firms are as follows: improved financial management (70%); faster, more accurate transactions (69%); better managerial decision making (63%); improved inventory and asset management (60%); ease of expansion /growth and increased flexibility (55%); fewer physical resources and improved logistics (54%); and cycle time reduction (53%).
In terms of timing of benefit realization, one of the most consistent findings reported in the literature (IFS 1998; Gartner Group 1998; Deloitte Consulting 1998; Meta Group 1999; Ross 1999; Markus and Tanis 2000; KPMG 2000; Cooke et al. 2001) is that there is a dip in organizational performance in the six to twelve months after go live. The Conference Board (Cooke et al. 2001) surveyed 117 organizations concerning outcomes of their ES investments. Seventy-five percent of those organizations experienced a moderate to severe "productivity dip" in the first six to twelve months after go live. Benefits seem to start after the first year or so, when problems like corrupt master file data and lack of adequate user training have been sorted out (Ross 1999; Shang and Seddon 2000, Markus and Tanis 2000; Holland and Light 2001). While KPMG’s (2000) survey of 42 SAP user organizations in Australia (approximately 16% of the SAP population in Australia) revealed that it takes more than two years for companies to achieve expected benefits. Finally, the Accenture study (Davenport 2002) also reports that benefits did not all appear
immediately (Fig. 15, p.26). Benefits in all eight of their dimensions grew significantly in the four or more years after implementation. For example, while only 20% of firms attributed increased revenue to their investment in ES in their first year, 70% of firms attributed increased revenue to their investment in ES by their fifth or greater year.
Are different categories of benefits independent of each other? Benefits from
different classes of IT investment in transactional, informational, strategic, and infrastructure systems are reported to take different lengths of time to develop (Weill and Broadbent 1998, Shang and Seddon 2003a). Furthermore, these different types of IT benefits are often dependent on one another, in the sense that benefits in one dimension may need to be realized before benefits in some other dimensions (Weill and Broadbent 1998). Since ES investments are combinations of the above four types of investment—they integrate processes across organizations, provide greater visibility of information, can be applied to strategic ends, and create a new IT infrastructure that can act as a foundation for additional systems - benefits may be expected in all these four dimensions, and those benefits may be expected to interact. Since Shang and Seddon (2002) consider the broadest range of benefits, this project chooses to use their framework as the starting point for examining benefits for this study.
Moving on to the third research question “What are the probable causes of those
perceived net benefits?” In addition to the general issues in IT implementation that
project management (Lucas et al. 1988; Holland et al. 1999; Parr and Shanks 2000), organizational learning (Lee and Lee 2000; Robey et al. 2002) and change
management (Sumner 1999; Ross 1998; 劉志明,葉裕民 2002; Davenport 2002) are the critical factors for project success. The literature as mentioned by Markus and Tanis (2000), Brehm et al. 2001, Kirchmer (1998), O’Leary (2000) and Shang
(2003b) are particularly relevant to enterprise systems. As O’Leary (2000) points out, the key to success seems to be to achieve a fit between business needs and software capabilities without resorting to changing packaged software code. Achieving fit requires a combination of business, software, and IT knowledge, and careful
and others, fit is more likely to emerge incrementally rather than immediately after implementation. Meanwhile, Deloitte Consulting’s (1998) Second Wave report argues that benefits from ES can be increased if various on-going improvement practices are adopted. Reinforcing this view, the MetaGroup (2002) argues that in order to “avoid disappointment” with enterprise systems, and “gain continuous business improvement” over the 15+ year life of an ES implementation, “clients are advised to create a Center of Excellence”.
Summarizing, based on the above review of the literature, one would expect (a) a wide range of benefits from ES, that benefits (compared to those from the prior system)will probably dip in the first year after implementation but rise in the years after that, (b) interactions among different types of ES benefits, and (c) initial integration benefits come from improving fit between the software and business, whereas later benefits are likely to require continuous modification and
enhancement of both software and processes. These preliminary propositions are to be tested in the in-depth case studies.
RESEARCH METHODOLOGY
Since there has been little in-depth research on benefit realization from investments in ES, multiple case studies in a single industry for this research is applied. Use of multiple case studies is the recommended method for studying poorly understood phenomena in a real-world setting (Yin 1994).
First, this project conducted initial discussions with a number of different ES-using organizations in Taiwan. Then six ES user organizations from the manufacturing industry (Table 1) that have applied ES for more than three years are selected. Choosing companies with similar backgrounds meant that experiences of these companies would be much more directly comparable than if, say, they had all been in different industries. Future research could test our propositions in other industries and in organizations of different sizes, e.g., small to medium enterprises (SMEs) and multinationals. The criteria for case selection are:
1. Cases have applied enterprise systems to integrate and manage inter- or intra- organizational processes and resources.
2. Cases have applied enterprise systems as an integration process infrastructure to link with other processes and extend into new applications. Cases with a single ES module used by an organization to manage certain core processes but not linked with other core resource management processes are not selected. 3. Cases have applied enterprise systems for more than three years since the
systems went live.
In order to study cases that have sufficient experience on the ES, this project select cases according to the population rate and adoption pace of different types of ES.
Second, interviews are planned with five to seven people in a range of roles in each organization. Interviews are typically one to two hours. A total of four different types of interviews (see details in Table 2) are conducted with multiple interviews with some key informants. To reduce the possibility of recency-effect bias several data triangulation tactics are planned. During each interview, subjects are asked to think retrospectively regarding the details of business conditions, the
implementation project, benefits and problems in the first year of use, benefits and problems since then, likely future developments, and to supply supporting evidence. Shang and Seddon’s (2002) 84-point checklist is used to remind interviewees of possible types of ES benefit and to trigger recollections of the benefit realization process. The results will be cross-validated with internal and external documents and various interviewees in the same organization.
Table 1: case description
Company ERP use Years of ERP use Revenue (million US$)
ManuA SAP 4 800 ManuB SAP 3 890 ManuC Oracle 4 900 ManuD DS 3.5 720 ManuE DS 3 750 ManuF SAP 3.5 820
Table 2: Planned interviewees in each organization
Interviewees Collected data Time
Top manager To collect data on strategic benefits 1 hour ES manager To collect data on overall benefits/problems and
project information
2 hours
Process managers * 2-4
To collect data on operational, managerial and organizational benefits
2 hours
IT manager To collect data on organizational benefits 2 hours
Using a three-step process approach similar to that described by Eisenhardt(1989) for within- and cross-case analysis, all interviews will be transcribed, compared with other interviews and documents from the same organization, and tables of benefits and problems in the first and later years. Besides, interviewees’ explanations for those benefits and problems are prepared. In the first step, a timetable is constructed for each of the six cases, identifying business changes, ES implementation and use, and benefits and problems in each dimension for the three years after
implementation. In the second step, a table documenting patterns of perceived net benefit flow, and explanations of initial and further benefits and problems is created for each case. The PNBF graphs are to be reviewed by a key informant from each organization. In the third step, cross-case analysis is used to compare and contrast experiences in the studied organizations.
Perceived net benefit flow (PNBF) graphs
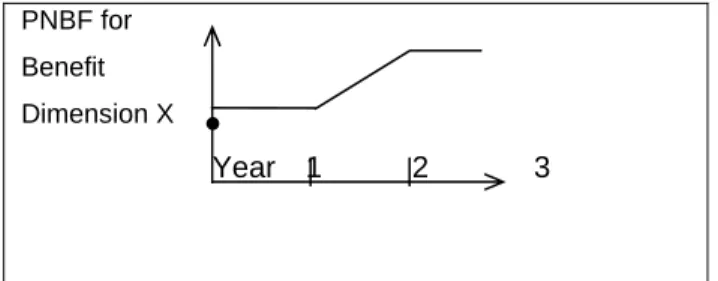
The technique used for summarizing answers to this question is to draw “perceived net benefit flow” (PNBF) graphs for various net benefits dimensions. An example PNBF graph is shown in Figure 1. Perceived, rather than monetary measures are used for the vertical axis because they are relatively convenient to collect and it is often very difficult to quantify benefits from IT investments any more accurately.
PNBF for Benefit Dimension X
Year 1 2 3
Figure 1: PNBF graph with annual benefits rising in the second year (the dot on the vertical axis represents the level of benefits from the prior system)
The following paragraphs explain how the PNBF graphs is prepared in this study. First, the evaluation team must decide on some appropriate benefit dimensions. In this study all the possible benefits from enterprise systems are concerned, so the benefit dimensions chosen are the five from Shang and Seddon (2002), as
summarized in Table 3. In addition, details of sunk costs such as initial licence fees and implementation costs are not collected, nor even ongoing maintenance fees that are essentially locked in once an organization has decided to implement ES. Although this study do not capture these sunk costs in the net benefits measure, the term “net benefits” (rather than just “benefits”) is used because PNBF reflects a netting off of benefits and problems, as they reported by users and managers in the case study organizations. As far as most of them are concerned, the benefits and problems they experience are what defines for them perceived net benefits.
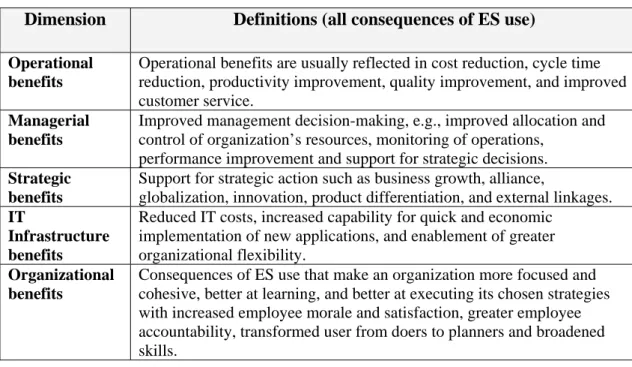
Table 3: ES Benefit dimensions (based on Shang and Seddon 2002) Dimension Definitions (all consequences of ES use)
Operational benefits
Operational benefits are usually reflected in cost reduction, cycle time reduction, productivity improvement, quality improvement, and improved customer service.
Managerial benefits
Improved management decision-making, e.g., improved allocation and control of organization’s resources, monitoring of operations,
performance improvement and support for strategic decisions.
Strategic benefits
Support for strategic action such as business growth, alliance,
globalization, innovation, product differentiation, and external linkages.
IT
Infrastructure benefits
Reduced IT costs, increased capability for quick and economic implementation of new applications, and enablement of greater organizational flexibility.
Organizational benefits
Consequences of ES use that make an organization more focused and cohesive, better at learning, and better at executing its chosen strategies with increased employee morale and satisfaction, greater employee accountability, transformed user from doers to planners and broadened skills.
Second, the unit of analysis must be agreed upon. Shang and seddon (2002) suggested that the best unit of analysis for assessing operational, managerial and organizational benefits from ES is an organization’s core process whereas strategic benefits are better assessed by the overall organization performance and IT
Third, PNBF graphs show benefits relative to perceived benefits from the system in use immediately prior to “go-live”. Go live may be at different dates for different core processes, or (as the result of a phased implementation) in different parts of the organization. Benefits from the previous system at the time of “go-live” are indicted by the dot on the vertical axis in each graph.
For each of the three years after “go-live” process owners are asked to indicate benefits relative to the prior system on a five point scale with the midpoint
representing no change. Their answers are to be used as anchors for the patterns of benefits depicted in the graphs. At the risk of presenting information that may appear misleadingly precise, line graphs are used in preference to bar graphs because they suggest the pattern of benefits revealed in discussions with various interviewees more clearly than simple bar graphs. For instance, if a respondent says “we took over company x in August”, it is possible to pinpoint when new strategic benefits started to flow. All graphs drafted will be checked with key informants in each organization.
RESEARCH RESULTS
Benefit Dimension 1: Operational benefits
Operational Benefits Manu A, E Operational Benefits Manu B Operational Benefits ManuC, F Operational Benefits ManuD
Year 1 2 3 Year 1 2 3 Year 1 2 3 Year 1 2 3 F&A process Other processes Both
According to Shang and Seddon’s (2002) classification, operational benefits from ES include:
• cost reduction, e.g., labour costs, inventory holding costs, administrative expenses,
• cycle-time reduction, e.g., in customer service activities, payroll and other processing, and supplier support activities such as order processing and payment
• productivity improvements, e.g., increased work volume with same workforce
• quality improvement, e.g., error rate, data reliability, data accuracy • customer service improvements, e.g., ease of data access and inquiries. By the end of the first year, all six case study organizations had gained operational
benefits in their Finance Management processes. These benefits included: reduction
of 40% in accounting staff; a Full-Time Equivalent (FTE) reduction in human
resources and a drop in inventory. Moreover, the month-end closings in ManuD and
E were reduced, and the customer service was highly rated in ManuB.
Despite success in Finance Management, serious problems were found in other
processes. mplicated data entry confused users in ManuA, B, and D. Simple jobs
now required multiple screens to enter data. Substantial operational benefits were
noted as their systems were used to support business expansion.
Benefit Dimension 2: Managerial benefits
Managerial Benefits ManuA Managerial Benefits ManuB, E Managerial Benefits ManuC, F Managerial Benefits ManuD
Year 1 2 3 Year 1 2 3 Year 1 2 3 Year 1 2 3
Figure 3: PBF Graphs of Managerial Benefits in the Six Manu Companies
• Improved decision-making and planning, e.g., improved strategic decisions, tighter cost control, more flexible resource management, improved customer responsiveness.
• Better resource management, e.g., better asset management and workforce management.
• Performance improvement in a variety of ways, e.g., financial performance by line of business, by product, by customers, by geographies or by different combinations; and manufacturing performance monitoring and prediction.
As shown in Figure 3, there was a consistent pattern of managerial PBF in the two core processes across all six cases. For the first year to eighteen months, low use of the reports resulted in low managerial benefits. After that, benefits started to rise. Problems with multi-level data retrieval were a source of complaint from managers in ManuA, B and D. Managers in ManuB preferred their old customized reporting service. A manager in ManuD with intimate knowledge of the old reports
complained about the new ones. Lack of directories for identifying appropriate new reports made it difficult for managers to accept new reporting processes.
Benefit Dimension 3: Strategic benefits
Strategic Benefits ManuA Strategic Benefits ManuB, E, F Strategic Benefits ManuC Strategic Benefits ManuD
Year 1 2 3 Year 1 2 3 Year 1 2 3 Year 1 2 3
Figure 4: PBF Graphs of Strategic Benefits in the Six Manu Companies
Shang and Seddon’s (2002) strategic benefits include:
• Support business growth, e.g., transaction volume, processing capacity, new business units, new products, services, markets, new divisions, new alliances, and a consistent IT architecture across different business units;
• Supporting business innovation, e.g., enabling new market strategies
• Supporting global operations, e.g., multi-currency transactions and reporting • Enabling E-commerce, e.g., through web enablement
• Generating or sustaining competitiveness, e.g., enabling faster
decision-making, or offering world-class connectability to suppliers and customers.
As shown in Figure 4, Strategic PBF varied from organization to organization. This was mainly due to different business strategies employed by each firm. As acquired companies switched over to their shared ES, additional benefits were achieved through economies of scale. All six utilities expected increased strategic benefits from their enterprise systems in future as deregulation made all customer accounts contestable, and various e-commerce initiatives were implemented.
Benefit Dimension 4: IT Infrastructure benefits
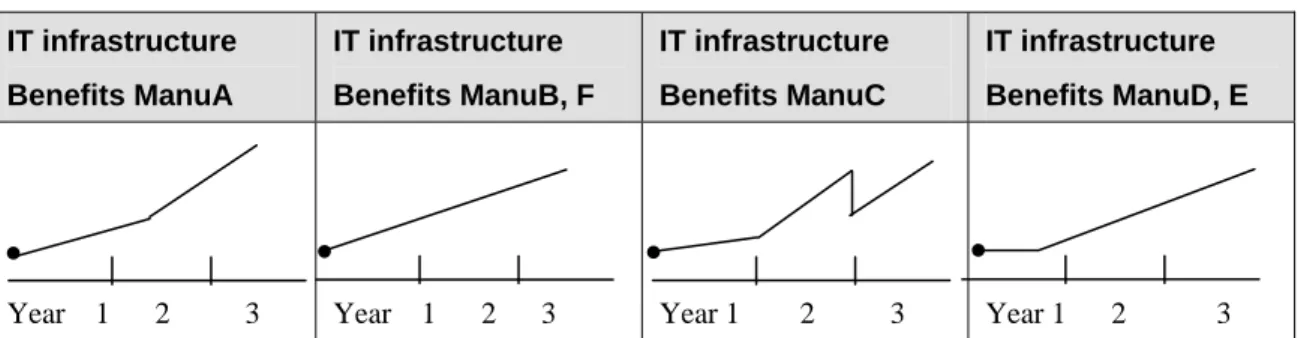
IT infrastructure Benefits ManuA IT infrastructure Benefits ManuB, F IT infrastructure Benefits ManuC IT infrastructure Benefits ManuD, E
Year 1 2 3 Year 1 2 3 Year 1 2 3 Year 1 2 3
Figure 5: PBF Graphs of IT Infrastructure Benefits in the Six Manu Companies
Shang and Seddon’s (2002) IT Infrastructure benefits include:
• IT cost reduction, e.g., reduced total cost of maintaining and integrating legacy systems by eliminating separate data centres and application
maintenance, IT staff reductions, mainframe or hardware replacement, Year 2000 compliance, technology research and development.
• Increased IT infrastructure capability, e.g. technology to provide stable and flexible support for the current and future business strategy, stable platforms that form the basis for new applications, customizable, flexible modern technologies.
Enabling increased business flexibility IT infrastructure PBF are generally upward in Figure 5. Immediate infrastructure benefits began as soon as legacy systems were replaced. Regular IT maintenance costs were reduced. By the third year after go live, increased user knowledge led to reduced need for helpdesk support.
Benefit Dimension 5: Organizational benefits Organizational Benefits ManuA Organizational Benefits ManuB,E,F Organizational Benefits ManuC Organizational Benefits ManuD
Year 1 2 3 Year 1 2 3 Year 1 2 3 Year 1 2 3 Finance Management Work Management Both
Figure 6: PBF Graphs of Organizational Benefits in the Six Manu Companies
Shang and Seddon’s (2002) organizational benefits include:
• Increased employee morale and satisfaction, e.g., satisfaction with better decision-making tools, work efficiency, increased system skills and business knowledge, and better employee service.
• Greater employee empowerment and involvement in business management. • Greater accountability, more value-added responsibility, users transformed
from doers to planners.
• Broadening of employee skills.
• Building a common vision, acting and working as common unit, greater harmonization of interdepartmental processes.
• Shifting employee work focus, e.g., greater concentration on core work processes, customers and markets, and on overall performance.
As shown in Figure 6, across the six cases there was either no change or a decline in the organizational benefits in the first and second years. Organizational benefits started to grow in the third year after problems were fixed and benefits in other business dimensions became apparent. In the first year, organizational benefits were mostly negative. These declines were mainly due to operational deficiencies
exacerbated by complicated-to-learn system processes, business change pressures, high ES-professional turnover (the labor market for ES-skilled professionals at the time of all six implementations was highly volatile), and indifferent implementation strategies.
Problems with other processes frustrated users for two years, with the pain seeming to outlast the cure. Operational problems gave users excuses for not using the system. However, tensions seemed to ease after a series of training programs were offered in all companies. With increased ES knowledge and operational and managerial
benefits becoming visible, users’ behavior started to change.
Benefits from ES are likely to be realized at different rates for different core processes in each of the five dimensions, even in the one organization.
Immediately after go live Operational benefits and problems were quickly apparent in most processes. In many cases, it took more than a year for problems to be solved and for users to learn to run their operational systems effectively. Second, it took about eighteen months for data-retrieval process to be ironed out, and for managers to learn and trust the new reporting capabilities. Third, Strategic benefits appeared only after senior managers learned to apply the power of their systems to strategic ends, which in some cases took years. Sixth, some IT Infrastructure benefits were realized immediately after replacement of legacy systems, but IT Infrastructure benefits continued to grow as the organizations learned to build on their new infrastructures. Finally, in a number of cases, it took more than two years for organizational resistance to the new systems to ease and for positive Organizational benefits to start to emerge. Viewed across case and across benefit dimensions, the results in the five sets of PBF graphs provide insights into the nature of the early performance dip reported by prior researchers.
The PBF graphs in the previous section provide a convenient short-hand answer to the first research question addressed in this paper: “What benefits do organizations realize from enterprise systems, and when are such benefits realized?”. In this section we begin to answer the second and third research questions posed in the introduction, namely, “Are different categories of benefits reported in the previous section independent of each other?” and “What are the probable causes of those perceived benefits?”
ES benefits in different dimensions are dependent on one another.
As illustrated in Figure 7, benefits and problems in any one dimension may lead to benefits and problems in the other dimensions, and vice versa. Focusing first on the Operational Benefits in the center of Figure 7, in the case study organizations, the most visible early effects of ES use were Operational benefits and problems. Improvements in this benefit dimension underpinned benefit realization in the other six dimensions: managerial benefits started only after operations were stable and reliable information was being captured in the database; strategic benefits were realized only after operations were stable and senior managers recognized the power of their systems as tools for wringing benefits from newly-taken-over organizations; IT infrastructure benefits were achieved early but increased once mature operations were in place; and organizational benefits were generally negative initially, then started to increase after benefits became apparent in other dimensions.
As managers realized Strategic benefits, they tend to expand and extend the use of their ES infrastructure, which also affected business operations, management and organizational learning. With improvement in the above business areas, the capacity and capability of the IT Infrastructure provided by the ES became practical and visible. New strategies of business expansion, web-based services, and linkage with other Manu application systems all built on the new application infrastructure. In the third year of ES use, the systems studied were able to support many business
changes, and managerial requests from head offices, as well as strategic initiatives involving takeovers of other Manu companies.
As Organizational knowledge grew, operational, managerial, and strategic benefits all increased. ManuC, for instance, gained confidence in their ES and established shared services for internal and external customers. More reports were used for decision-making and individual efficiency improved. These improvements all came from the users’ greater capacity to use the system and their increasingly positive attitudes towards the ES.
Initial ES benefits come from improving fit between the software and business. Subsequent benefits are likely to require continuous modification and
enhancement of both software and organizational processes.
The most valuable way to interpret and integrate explanations of the initial benefits and problems (in the first year or so after go live), is to see them as attempts by managers to achieve a greater fit between the software and business needs. Fit was improved through two mechanisms. First, fit was enhanced by spending time on in-depth analysis, re-configuring, and re-customizing the software. Second, fit was also enhanced by training, job restructuring, and motivating staff to work with the new systems. Such efforts reduced user resistance, encouraged adaptation to changing needs, facilitated effective organizational learning, and lead to greater retention of skilled staff. These broad-scope change management programs were needed for all stakeholders, including quite senior managers.
However, after the first year or so, the nature of the problems and of the
management interventions changed. Later-year benefits and problems were the result of software upgrades, changing organizational needs and priorities, further process modification and enhancement, extending functionality, exploitation of the gradually-growing database, and increased user knowledge and confidence with their systems.
LIMITATIONS
The most obvious limitation of this study is that although some informants are to be interviewed more than once, the data will be based on recollections of informants. Techniques to overcome this limitation are interviews with multiple informants, triangulating with supporting data, e.g., written reports, and verification of results with key stakeholders. Secondly, different informants may have different views. Although influenced by user reports, the PBF graphs will be drawn from the
perspective of management. Thirdly, although the PBF graphs attempt to provide an overall impression of benefits in each dimension, detailed in-depth analysis of each benefit dimension are not attempted. Managers and users in different core processes
and steps taken to solve them, using the different benefit dimensions from Shang and Seddon (2002) to jog their memories.
CONCLUSION
The objective of this study was to understand benefit realization, and ways of improving benefits, in the years after implementation of packaged enterprise application software. The research questions posed were:
1. What benefits do organizations realize from enterprise systems, and when are
such benefits realized?
2. Are different categories of benefits independent of each other?
3. What are the probable causes of those perceived benefits?
Answers to these three questions—based on in-depth longitudinal case studies conducted in six Australian Manu companies, three using SAP and one PeopleSoft ERP system—are as follows:
1. As shown in the five sets of PBF graphs above, benefits from ES are likely to be realized at different rates for different core processes in each of the five dimensions, even in the one organization.
2. ES benefits in different dimensions are dependent on one another. Over time, the interplay between these benefits can lead to enhanced organizational capability. 3. Initial ES benefits come from improving fit between the software and business. Subsequent benefits are likely to require continuous modification and enhancement of both software and organizational processes.
References
AMR Research (2003). AMR Research Spring Press Briefing, Scottsdale, Arizona, June 5, http://www.amrresearch.com/AboutUs/2003PressBriefing.ppt., June 2003.
Brehm, L. Heinzl, A. and Markus, M.L., Tailoring ERP Systems: a spectrum of choices and their implications Proceedings of the 34th Annual Hawaii
International Conference on Information Systems, Hawaii, Jan 2001
Brown, C.V. and Vessey, I. (2003). Managing the next wave of Enterprise systems: leveraging lessons from ERP, MISQ Executive, 2(1): 65-77 (www.misqe.org). Cooke, D., Gelman, L., and Peterson, W.J. (2001).ERP Trends, The Conference
Board, Research Report R-1292-01-RR, June . Press Release: http://www.conference-board.org/search/dpress.cfm?pressid=4643
Davenport, T. H. (2000). Mission Critical: Realizing the Promise of Enterprise
Systems, Boston, Massachusetts: Harvard Business School Press
Davenport, T., Harris, J. and Cantrell, S. (2002). The Return of Enterprise Solutions: The Director's Cut, Accenture, October 14
http://www.accenture.com/xd/xd.asp?it=enweb&xd=_isc\iscresearchreportabstra ct_174.xml
Deloitte Consulting (1998). "ERP's Second Wave -- maximizing the value of
ERP-Enabled Processes," New York: Deloitte Consulting ISBN 1-892383-42-X http://www.dc.com/obx/pages.php?Name=dr_strategy_crossind#
Eisenhardt, K.M. (1989). “Building Theories from Case Study Research”, Academy
of Management Review, 14: 4: 532-550.
Diana Farrell (2003). "The real new economy", Harvard Business Review, 81(10) : 104 - 109.
HBR (2003). "Chapter 4 Electronic Business Systems" in
http://harvardbusinessonline.hbsp.harvard.edu/b01/en/files/academic/OBrien_MI S_map.pdf
Holland, C.P. and Light, B. (1999). A Critical Success Factors Model for ERP Implementation, IEEE Software, 16(3): 30-36.
Holland, C.P. and Light, B. (2001). A stage maturity model for enterprise resource planning system use, Database for Advances in Information Systems, Spring 32(2): 34-45.
IFS "The ERP Market-1998 and Beyond," Sweden: Industrial & Financial Systems, 1998.
Kirchmer, M. Business Process Oriented Implementation of Standard Software:
KPMG Consulting and Nolan Norton Institute (2000). "SAP Benchmarking Report 2000"
Lee, Z. and Lee J. An ERP implementation case stydy from a knowledge transfer perspective, Journal of Information Technology, Vol 15, No. 4, Dec 2000: 281-288.
Lucas, H.C. Jr., Walton, E.J., Ginzberg, M.J., "Implementing Packaged Software",
MIS Quarterly, Dec, 1988, Vol 12, No 4, pp 537-549.
Markus, L. M., Axline, S., Petrie, D., and Tanis, C. Learning from adopters' experience with ERP: problems encountred and success achieved, Journal of Information Technology, Vol 15, No. 4, December 2000: 245-266.
Nancy Talbert (2002) Getting the Most From an Enterprise System, Sloan
Management Review, Fall Volume 44, Number 1, p. 11
Nucleus Research (2003). The Real ROI From SAP,
http://www.nucleusresearch.com/research.html (viewed June 2003). O'Leary, D. E., Enterprise Resource Planning Systems: Systems Life Cycle,
Electronic Commerce, and Risk, Cambridge, United Kingdom: Cambridge
University Press, 2000
Parr, A. N., Shanks, G. and Darke, P. (1999). "Identification of necessary factors for successful implementation of ERP systems," in New Information
Technologies in Organizational Processes: Field Studies and Theoretical
Reflections on the Future of Work, Ngwenyama, O.,Introna, L.,Myers, M. D. and
DeGross, J. I. (eds.), Boston/Dordrecht/London: Kluwer Academic Publishers Robey, D., Ross, J.W., and Boudreau, M-C. "Learning to Implement Enterprise
Systems: An Exploratory Study of the Dialectics of Change", Journal of
Management Information Systems, Vol. 19, No. 1, Summer 2002
Ross, J. W. (1999). The ERP Revolution: Surviving Versus Thriving, Center of Information Systems Research, Sloan School of Management, Cambridge, MA Scott, J.E. and Vessey, I. (2002). Managing risks in enterprise systems
implementations, Communications of the ACM, 45(4): 74-81
Seddon, P.B. and Shanks, G. (2003). Lessons from the Packaged Enterprise
Application Software “Go Live” Failures at Cambridge and RMIT Universities, Working paper, The University of Melbourne
Shang, S. and Seddon, P. (2000) "A Comprehensive Framework for Classifying the Benefits of ERP Systems," Proceedings of the 2000 Americas Conference on
Information Systems (AMCIS), Long Beach, California, August 10-13.
Shang, S. and Seddon, P.B. (2002). Assessing and Managing the Benefits of Enterprise Systems: the Business Manager’s Perspective, Information Systems
Shang S. and Seddon, P.B. (2003a). A Framework for Assessing and Managing the Benefits of Enterprise Systems: the Business Manager’s Perspective. In ERP:
The Quiet Revolution? Shanks, G., Seddon, P. and Willcocks, L. (eds.),
Cambridge University Press.
Shang S. and Seddon, P.B. (2003b). “The Risks of Changed Processes with Enterprise Systems” Proceedings of the 14th Australasian Conference on
Information Systems (ACIS), Perth, Australia, November 28.
Somers, T.M. and Nelson, K. (2001). The Impact of Critical Success Factors across the Stages of Enterprise Resource Planning Implementations, Proceedings of the
34th Hawaii International Conference on System Sciences.
Sia, S.K. and Soh, C. "An Exploratory Analysis of the Sources and Nature of Misfits in ERP Implementations", in Shanks, G. Seddon, P.B and Willcocks, L.P. (eds.),
Second Wave Enterprise Resource Planning Systems: Implementing For Effectiveness, Cambridge University Press
Sumner, M. (1999). Critical Success Factors in Enterprise Wide Information
Management Systems, Proceedings of the Americas Conference on Information Systems, Milwaukee, WI, 1999, pp. 232-234.
Umble, E.J., Haft, R.R., and Umble, M.M. (2003). Enterprise resource planning: Implementation procedures and critical success factors, European Journal of
Operational Research 146: 241-257.
Weill, P. and Broadbent, M. (1998). Leveraging the new Infrastructure, Boston: Harvard Business School Press.
Yin, R. (1994). Case Study Research: Design and methods, SAGE Publications, 1994. 王怡心 為傳統產業轉型 將製造優勢e化--企業資源規劃的導入與效益, 會計 研究月刊 90.09 洪廣禮 金融業如何成功導入 CRM 顧客關係管理--善用資訊科技,提升產品與服 務績效 財金資訊 18 民 90.10 頁 26-28 楊金福, 白忠哲, 企業資源規劃系統(ERP)導入前後的評估比較研究, 品質月刊, 38:5 民 91.05, 頁 66-69 何應欽 許秉瑜 企業特質與企業導入ERP系統之目的、過程與成效滿意度的探 討, 電子商務學報 92.03 蔡文賢等 建構ERP系統之績效評估指標, 電子商務學報 92.03 劉志明, 葉裕民 整合性企業流程改造方法的發展與應用--以 ERP 之導入為例, 工業工程學刊, 19:2 民 91.03, 頁 96-106 蔡淑芬 知識管理應用於企業資源規劃之研究, 資訊管理與工程學報 90.05
計畫成果自評
This research was accomplished with the support of the NSC. The research process is compliant with the original plan in the proposal with three major research
questions explored fully. The research results and findings are described in the above report. One related paper was developed and published in the PACIS 2005 in July, 2005. This paper has further applied a resource-based view in answering the third research question of “causes for ERP benefits”.
Regarding the contribution of this research, the longitudinal and broad-scope, five-dimensional benefit analysis provides a useful approach for ES practice and future research. Although it is clearly not possible to summarize the outcomes of an enterprise system with five subjectively-based graphs, the PNBF graphs can provide preliminary understanding of the ES benefit realization pattern.
It is hoped that the ES benefit flows and management propositions can assist effective ES management by explaining the possible ups and downs in the ES journey; revealing interrelationships among dimensional benefits, and highlighting pivotal points in developing initial and further benefits.
It is also planned that the assistant students in this project would gain deep understanding of the use of enterprise systems, be familiar with management of business processes, learn data mining with qualitative data analysis software and increase capabilities in collecting, analyzing and interpreting qualitative research data.
計畫已發表相關論文
Sharg, S. C. and Wu, T. L. (2005) “A Model for Analyzing Organizational
Performance of ERP Systems from a Resource-Based View” Pacific Asia
Conference of Information Systems PACIS 2005, July 7-10, Bangkok, Thailand.
A Model for Analyzing Organizational Performance of ERP
Systems from a Resource-Based View
Abstract
One of the controversial discussions on IT value has been the commoditization of information technology due to its ubiquity (non- proprietary) in the business world. Packaged ERP software with its standard processes has inevitably become the representative one. The risk of losing competitive advantages with the embedded ERP processes was noted. Due to the large amount of resources invested, ERP user organizations require payoff in not only the internal operation but also the
competitive market. The capability of managing organizational processes and human capital to take advantage of the knowledge-embedded software seems to be the key differentiator.
This study applies a resource-based view in synthesizing research findings about ERP value and building a model for analyzing the process of ERP value generation. Three sets of propositions are formed (1) IT and non-IT resources that are
complementary to ERP resources can create economic value and temporary competitive advantages for the user organization; (2) the rare and inimitable organizational resources that are complementary to ERP resources can create a sustained competitive advantage to the user organization; (3) the organizational resources of the trading partners can shape the focal firm’s ability to generate value from the ERP system. The resource-based view helps the explanation of business concerns about homogeneity and resource allocation. It is hopeful that the proposed model could provide a structured analysis of the impacts of various ERP
management initiatives and contribute to the study of the competitive value of packaged applications.
Keyword: ERP system value, resource-based view, ERP competitive advantage
Introduction
ERP systems have been applied by many firms around the world as a key part of the organizational infrastructure. These systems tend to have a long life cycle in
organizational use, and their processes have been extended into external
organizations across the industry value chain. Various impacts were reported in different levels of organizational practice such as operational gains, effective decision-making, and increased competitiveness. Different resources were also applied for achieving success in the different stages of ERP implementation and utilization such as top management support, IT infrastructure management, change management and continuous learning. But limited research has linked these
management factors to the long –term business performance. The lack of precise understanding of the impact of these ERP success-affecting factors has lead to difficulty in exploiting the valuable organizational resources in the lasting ERP life.
This study applies a resource-based view in synthesizing research findings about ERP value. Extended from an integrative model of IT business value by Melville et al. (2004) a model of ERP value is built and three sets of propositions are formed. The aim is to build a clear understanding of the interrelationship between the effective management of organizational resources and performance of different levels.
The resource-based view of IT business value
The resource-based view combines the rationale of economics with a management perspective. This theory considers the firm as a collection of resources. The capability to deploy groups of resources (Teece et al. 1997) is the key for management success. Sustained competitive advantage comes from (1)
complementarily of resources in creating heterogeneity of efficiency in industry and (2) value, rareness, inimitability and non-substitutability of the complementary resources (Barney 1991). The organizational resources include routines (Nelson and Winter 1982), culture, invisible assets (Itami 1987), human resources, and
information technology (Bharadwaj 2000). The speed of accumulation and
assimilation of resources is the key to firm growth, as are opportunities arising from underutilization of its resources. Firms continually search for new ways to increase productivity and efficiency. New knowledge yields new ways of using existing resources or new ways of combining sets of resources.
The resource-based view theory informs understanding of the linkage between the type of IT and the nature of business process and organizational performance impacts. Due to its focus on resource attributes and its usefulness in examining the IT resource, we choose resource-based view of the firm as the primary theoretical foundation (Melville et al. 2004).
Grounded in the resource-based view, Melville et al. (2004) built an integrative model of IT business value. The model defines IT business value as the
organizational performance impacts of information technology at both the intermediate process level and the organization-wide level, comprising both efficiency impacts and competitive impacts. It is built upon accumulated IT value knowledge spanning a wide range of theoretical paradigms and research methods. 202 articles about IT value in leading journals and conference proceedings between 1992 and 2002 were reviewed and the locus of IT value was divided into three domains: focal firm, competitive environment and macro environment.
ERP value model
Extended from Melville’s et al. (2004) integrative model of IT value a model of ERP value is built by synthesizing major findings of ERP value. The ERP literature reviewed are from major journals and conference proceedings of the past eight years. As depicted in the following figure, the focus of this study is on the ERP business value generated in the focal firm. The macro and competitive environment are not examined in this study due to the risk of losing focus in the complicated research process.
Technological IT resources (TIR)
The technological IT resources include two sets:
1. IT infrastructure: an IT infrastructure provides the shared foundation of IT capability for building business applications and is usually managed by the
information systems (IS) group (Broadbent and Weill 1997).The physical IT assets which form the core of a firm’s overall IT infrastructure comprise the computer and communication technologies and the shareable technical platforms and databases. 2. Business applications that utilize the infrastructure: the business applications, such as order entry, purchasing, sales analysis, production, and finance accounting systems, which actually perform the business processes and utilize the shared infrastructure services.
ERP user organization
ERP Value Generation Process
TIR & HIR with ERP Implementation ERP Organizational Performance Implemnt.
Human IT resources (HIR)
The human IT resources generally comprise the training, experience, relationships, and insights of its employees. The critical dimensions of human IT resources include:
1. Technical IT skills, such as programming, systems analysis and design, and competencies in emerging technologies. Legacy system management is an additional skill for ERP project (Holland and Light 2002).
2. Managerial IT skills, which include abilities such as the effective management of IS functions, coordination and interaction with user community, and project management and leadership skills (Bharadwaj 2000).
Project management
Project management should be disciplined with timeliness of project and the forcing of timely decisions managed (Holland and Light 2002; Sumner 2000); schedule and budget maintained; training coordinated and proper resources allocated. A strong project leader to gather strong core teams consisted of knowledgeable and skilled IT specialists to overcome knowledge barriers of configuration and assimilation is necessary so that changes during the project are addressed appropriately to respond to environmental and strategic changes at more tactical levels (Umble et al. 2003; Scott and Vessey 2000).
Vendor support
Vendor support represents an important factor with any packaged software including extended technical assistance, emergency maintenance, updates, and special user training.
& Use Complementary
Organizational Resources
Business plan and vision
ERP implementations require that key people throughout the organization create a clear, compelling vision of how the company should operate in order to satisfy customers, empower employees, and facilitate suppliers (Umble et al. 2003; Scott and Vessey 2000).
Inter-process cooperation and communication
ERP potential cannot be leveraged without strong coordination of effort and goals across business and IT personnel. A key factor for the successful implementation of ERP systems requires a corporate culture that emphasizes the value of sharing common goals over individual pursuits and the value of trust between process owners, managers, partners, employees, and corporations. Management of
communication, education and expectations are critical throughout the organization (Sumner 2000).
Business process reengineering
One of the problems associated with implementing packaged software is the incompatibility of features with the organization’s information needs and business processes. It’s almost inevitable that business processes are molded to fit the new system (Ross et al. 2002).
Change management
Managing change is a primary concern of many involved in ERP implementations (Robey et al. 2002; Markus et al. 2000). ERP systems introduce large-scale change that can cause resistance, confusion, redundancies, and errors.
Complementary organizational resources
Successful implementation of IT is usually accompanied by organizational change, including policies and rules, organizational structure, workplace practices, and organizational culture, etc. When IT resources and other resources exist in the firm, the latter resources are called complementary organizational resources (Melville et al. 2004; Barney 1991). Complementary resources are resources that either supply mutual needs or offset mutual lacks of the implementation of the ERP systems. They include: top management support, external expertise, management, structure, and organizational culture.
Successful ERP implementations require strong leadership, commitment, and participation by top management (Holland and Light 2002; Parr and Shanks 2002). The roles of top management in ERP implementations include developing an understanding of the capabilities and limitations of ERP, establishing reasonable goals for ERP systems, exhibiting strong commitment to the successful introduction of ERP, and communicating the corporate ERP strategy to all employees.
External expertise
Different consultants may have experience in specific industries, comprehensive knowledge about certain modules, and may be better able to determine which suite will work best for a given firm (Holland and Light 2002; Sumner 2000). A close working relationship between the project team and consultant is needed throughout the implementation phases.
Management structure
The management structure relates to: the resource control structure, the reporting structure, the distribution of authority, the job responsibilities and measurements of the organizational and individual performance. They all need to be aligned with the new ERP processes so that information can flow smoothly, decisions can be made properly, problems can be solved efficiently, active improvements can be motivated, and cooperative behaviors can be guided (Somers and Nelson 2001; Sumner 2000).
Organizational culture
In the ERP system life, enterprise-wide culture should be managed for an effective use of the system. A culture with shared values and common aims is conductive to success. An emphasis on open to change, continuous improvement mind-set in the firms (Ross et al. 2002) and a strong commitment to use the system for achieving business aims (McCredie and Updegrove 1999) would aid in implementation efforts.
ERP implementation and use
ERP implementation refers to the stage of system planning, configuration, testing and final implementation. ERP use means ERP adoption or utilization. It refers to the experience of managing the operation of the system software in throughout the system life in the post-implementation stages (Nah et al. 2004).
Organizational performance
Organizational performance is the aggregation of ERP-enabled process
After reviewing studies on the impact of ERP systems on business performance (Shang and Seddon 2002; Markus et al. 2000), one would expect a wide range of influences from ERP ranging from operational to strategic. Operational efficiency is usually reflected in cost reduction and productivity enhancement whereas strategic success is usually reflected in revenue growth and gains in market share. It is important to note that changes in organizational resources may not result in immediate success due to adjustment costs, learning and other factors. Benefits of ERP systems require longitudinal review of the organizational performance.
Propositions about ERP value generation
Based on the concept of resource-based view that the complememtarity and inimitability of organizational resources can lead to operational and strategic benefits we form the following propositions about the development of ERP operational and strategic benefits.
Proposition 1A. The greater the capability of the IT infrastructure for ERP software implementation the greater the degree to which the ERP user organization can obtain operational benefits
Many ERP systems replace old, obscurely coded, disparate applications running on proprietary operating systems with modern, integrated systems built upon relational databases. New applications usually require a great deal of tuning to meet
performance expectations. A properly supported IT infrastructure can provide the level of performance users expect from a modern enterprise application (McCredie and Updegrove 1999).
Proposition 1B. The greater the functionality fit of the ERP software to the organizational objectives the greater the degree to which the ERP user organization can obtain operational benefits
To achieve the greatest benefits provided by an ERP system, it is imperative that the business processes are aligned with the ERP system (Holland and Light 2002). One way of ERP implementation is to impose ERP logic on a company’s strategy, culture, and organization without any customization (Davenport 1998). The
secondary way is using ERP software configuration or ERP tailoring options, and it is easier to mold the organization to the ERP software than reverse situation. The last way is using customization. Management has the ultimate choice of changing the process to fit the system or the system to fit the process.
Proposition 1C. The greater the degree of complementarity between the human IT expertise and technological IT resources in an ERP implementation the greater the degree to which the ERP user organization can obtain temporary competitive advantages.
ERP implementation success or failure is related to the knowledge, skills, abilities, and experience of the project manager as well as selection of the right team
members, which should not only be technologically competent but also understand the company and its business requirements. The skills and knowledge of the project team is important as is the management of vendors to provide expertise in areas where team members lack knowledge (Ross et al. 2002). Organizations need to establish clear IT government structure and capability so that internal and external resources are well utilized for creating temporary competitive advantages with the ERP systems.
Proposition 2A. The greater the degree of complementarity between the
organizational resources and ERP software implementation and use the greater the degree to which the ERP user organization can obtain benefits of all
dimensions.
Complementary organizational resources interact with IT in the process of value generation (Melville et al. 2004). Prior researches (Bresnahan et al. 2002; Brynjolfsson and Hitt 2000) indicated that a change in either the organizational thinking or the management structures accompanied by appropriate IT investment lead to improved and transformed business processes and competitive advantage. The organizational resources including top management insights, reporting structure, job responsibilities, and shared visions are important factors for achieving benefits of all areas in the phase of ERP use.
Proposition 2B. The greater the inimitability of rare organizational resources that are complementary to the use of ERP software and lacking substitutes, the greater the degree to which the ERP user organization can obtain a sustained competitive advantage.
Complementary organizational assets are valuable and may be rare. When there are no strategic equivalents, sustained competitive advantage rests on the extent to which such resources are imitable (Melville et al. 2004). What makes a business resource truly strategic is not ubiquity but scarcity (Carr 2003). Edges are gained over rivals only by having or doing something that others cannot have or do. The functions of ERP systems have become available and affordable what is crucial is to
be able to distinguish the commodity resources from resources that do have the potential to create advantage.
Conclusion
Although the propositions are yet to be tested several preliminary findings are worthy. First, ERP user organizations not only need to assess the capability of the IT infrastructure and human skills but also need to assure the complementarity among these resources. Second, ERP user organizations would need to invest appropriate organizational resources in supporting effective system use. Third, competitive advantage can be temporary if the coordinated resources are not institutionalized, only an embedded and combined organizational capability for managing continual changes with ERP systems can achieve lasting competitive advantages. Finally, ERP success, nowadays, also relies on the connected partners’ capability in managing their processes and resources; the focal firm would need to be able to assess risks in trading partner’s corporation model.
Based on the resource-based view this study synthesizes previous knowledge of ERP value and proposes a model of ERP value in the competitive environment. This model provides a framework for examining business efforts in the IT hardware, software, human capability and related organizational resources. The resource-based view helps the explanation of business concerns about homogeneity and resource allocation. It is hopeful that the proposed model could enhance the understanding of the impacts of various ERP management initiatives and contribute to the study of the competitive value of packaged applications.
References
Barney, J. (1991). "Firm Resources and Sustained Competitive Advantage." Journal of Management 17(1).
Bharadwaj, A. S. (2000). "A resource-based perspective on information technology capability and firm performance: An empirical investigation." MIS Quarterly 24(1): 169-196.
Bresnahan, T. F., E. Brynjolfsson, et al. (2002). "Information technology, workplace organization, and the demand for skilled labor: Firm-level evidence." The Quarterly Journal of Economics 117(1): 339-376.
Broadbent, M. and P. Weill (1997). "Management by Maxim: How Business and IT Managers Can Create IT Infrastructures." Sloan Management Review 38(3).
Brynjolfsson, E. and L. M. Hitt (2000). "Beyond computation: Information
technology, organizational transformation and business performance." The Journal of Economic Perspectives 14(4): 23-48.
Carr, N. G. (2003). "IT doesn't matter." Harvard Business Review 81(5): 41-49. Davenport, T. H. (1998). "Putting the enterprise into the enterprise system." Harvard Business Review 76(4): 121-131.
Holland, C. P. and B. Light (2002). A Framework for Understanding Success and Failure in Enterprise Resource Planning System Implementation. Second-Wave Enterprise Resource Planning Systems Implementing for Effectiveness: 181-195.
Itami, H. (1987). Mobilizing Invisible Assets. Cambride, MA, Harvard University Press.
Markus, M. L., A. Sheryl, et al. (2000). "Learning from adopters' experiences with ERP: problems encountered and success achieved." Journal of Information
Technology 15(4).
McCredie, J. and D. Updegrove (1999). "Enterprise System Implementations: Lessons from the Trenches." CAUSE/EFFECT 22(4): 1-10.
Melville, N., K. Kraemer, et al. (2004). "Review: Information Technology And Organizational Performance: An Integrative Model Of It Business Value." MIS Quarterly 28(2): 283-321.
Nah, F. F-H., Tan, X. and Teh, S.H. (2004). "An Investigation on End-Users’ Acceptance of Enterprise Systems." Information Resources Management Journal 17(3): 32-53.
Nelson, R. R. and S. G. Winter (1982). An Evolutionary Theory of Economic Change. Cambride, MA, Harvard University Press.
Parr, A. and G. Shanks (2002). Critical success factors revisited: a model for ERP project implementation. Second-Wave Enterprise Resource Planning Systems Implementing for Effectiveness: 198-219.
Peteraf, M. A. (1993). "The cornerstones of competitive advantage: A resource-based." Strategic Management Journal 14(3): 179-191.
Robey, D., J. W. Ross, et al. (2002). "Learning to implement enterprise systems: An exploratory study of the dialectics of change." Journal of Management Information Systems 19(1): 17-46.
Ross, J. W., M. R. Vitale, et al. (2002). The Continuing ERP Revolution:
Sustainable lessons, New Modes of Delivery. Second-Wave Enterprise Resource Planning Systems Implementing for Effectiveness: 102-132.
Scott, J. E. and I. Vessey (2000). "Implementing Enterprise Resource Planning Systems: The Role of Learning from Failure." Information Systems Frontiers 2(2): 213-232.
Shang, S. and P. B. Seddon (2002). "Assessing and managing the benefits of enterprise systems: the business manager's perspective." Information Systems Journal 12(4): 271-299.
Sumner, M. (2000). Risk factors in enterprise-wide/ERP projects. Second-Wave Enterprise Resource Planning Systems: Implementing for Effectiveness: 157-179. Teece, D. J., G. Pisano, et al. (1997). "Dynamic capabilities and strategic
management." Strategic Management Journal 18(7): 509-533. Umble, E. J., R. R. Haft, et al. (2003). "Enterprise resource planning:
Implementation procedures and critical success factors." European Journal of Operational Research 146: 241-257.