行政院國家科學委員會補助專題研究計畫成果報告
子計劃三:網路合作設計環境及社群設計科學活動的知
識建構之評估(3/3)
NSC89-2520-S-009-016-計畫類別:□個別型計畫
整合型計畫
計畫編號:NSC89-2520-S-009-016-執行期間:
89 年
8 月
1 日至
90 年
7 月
31 日
計畫主持人:林珊如
共同主持人:周倩
本成果報告包括以下應繳交之附件:
□赴國外出差或研習心得報告一份
□赴大陸地區出差或研習心得報告一份
□出席國際學術會議心得報告及發表之論文各一份
□國際合作研究計畫國外研究報告書一份
執行單位:國立交通大學教育研究所
中
華
民
國
90
年
10
月
26
日
行政院國家科學委員會專題研究計畫成果報告
子計劃三:網路合作設計環境及社群設計科學活動的知識建構之評估
(3/3)
計畫編號:NSC89-2520-S-009-016-執行期限:89 年 8 月 1 日至 90 年 7 月 31 日
主持人:林珊如 國立交通大學教育研究所
共同主持人:周倩 國立交通大學教育研究所
計畫參與人員:劉旨峰、林淑卿、江蕙茹、黃宏宇
Evaluating the Reliability and
Validity of Web-based Peer
Assessment thr ough Networ ked
Wor kshop Instr uction:
A Case Study
Abstr act
The study examined the reliability and validity of web-based peer assessment through a case study on networked workshop instruction, an instructional method that emphasizes presentation, discussion, peer feedback, and knowledge construction. In workshop instruction, peer assessment was used to evaluate students’ performance. Twenty four computer science graduate students enrolled in a course “Web and Database Integration” and were assigned to nine teams. Each team was instructed to design a web-based system capable of performing certain functions. Functioning similar to how researchers and scientists would in a workshop, participants orally presented design concepts and web-based peer assessment was conducted to increase critical feedback during design. Three design products and qualitative comments from teachers were presented to demonstrate the students’ high quality performances. Statistical analyses confirmed the reliability and validity of web-based peer assessment in networked workshop instruction.
Keywor ds:
Networked workshop instruction, collaborative design, web-based peer assessment, reliability, validityIntr oduction
Industry and academia often hold workshops to promote products or disseminate technical information. Therefore, this study presents an innovative instructional method, Networked Workshop Instruction (hereinafter referred to as NWI), that coordinates student learning in a manner similar to researchers and scientists attending a workshop. NWI aims to enhance collaborative design through presentation, discussion, peer feedback, and knowledge construction. NWI for
graduate level education largely concentrates mainly on presentation in the form of report writing and oral presentation. In the design process, students interact with teachers and among themselves to create novel design concepts. A web-based learning system that supports NWI allows interaction to occur at different times and places. Web-based Peer assessment can also play a role in NWI to increase critical feedback [21, 24] and evaluate design products and oral presentations. Therefore, NWI is structured in parallel to the underlying principles of constructivism and social constructivism [16, 17, 18]. Despite the innovativeness of this instructional method, NWI has received relatively little attention [1, 13, 15, 22], thereby making the effectiveness of this approach a contentious issue. Therefore, this study initially raises the following question: Is Networked Workshop Instruction in a graduate level course an effective medium to promote learning through collaborative design?
Many educators and students may question students’ ability to perform peer assessment [21]. This study thus analyzes this concern, as well as posing questions such as "Can students evaluate peer work properly?" "Do students grade peer work similar to teachers?" and "In terms of reliability is there consistency in grading when several students evaluate a work simultaneously?"
Per tinent liter atur e
NWI
The NWI instructional method is embedded in the precepts of constructivism and social constructivism [16, 17, 18] that advocate the active participation of students during instruction. Notable examples of successfully using workshop instruction can be found undergraduate courses of computer science [23], chemistry [13], mathematics [12], biology [15], and counseling [10]. These studies required students to hand in written reports, such as self-reflection essays as well as records of student-teacher meetings and small group discussions and, then, orally present those findings [1, 10]. Although face-to-face workshop instruction is well documented [10, 12, 13, 15, 23], the feasibility of using the Internet to support social interaction or social construction of knowledge has not been explored. To our knowledge, only two studies conducted for computer related courses [9] and for teacher training [22] have applied a teaching method similar to the one used herein.
NWI initially requires that students freely form collaborative design teams and, then, each team discusses the preliminary design concepts with the teacher. Each team must report on their design progress in written format in three stages: design concept compilation, system design plan, and system implementation. In addition to design
products, the design progress should include the contributions of each member. Thus, a team report must include members’ personal observations. During the design process, a team must interact through face to face meetings, on-line chat rooms and e-mail. Finally, the team conducts peer assessment to evaluate the design products in three stages and prepare for the oral presentation.
In addition to a network environment that supports reports, discussions, and mutual peer evaluation, face to face interactions between teachers and fellow students during oral presentations and discussions are encouraged. A balance of the two is necessary because some messages (e.g., emotions of persuasiveness) can be conveyed through non-oral information (e.g., posture, tone of voice, and attire) during face-to-face meetings. Asynchronous interaction can not replace this important social interaction that has an underlying learning process.
NWI revolves around four instructional elements to enhance collaborative design: Presentation, Discussion, Evaluation and knowledge Construction, simplified as PDEC. Those elements are individually described as follows.
1. Presentation: Each team is instructed to present their design product in written and oral forms. Students must read design-related information, such as papers and technical reports, as a basis for selecting a design theme, compiling previous works and new concepts, and generating three reports of design progress. Each report must include a record of the group's division of labor, personal observations of each member, and a complete report of group results. This process can hopefully train the student's writing presentation ability. Most, each team must orally present their finals at the final design stage.
2. Discussion: Discussion in NWI consists of asynchronous communication through a web-based learning support system developed for NWI, the exchange of E-mail, and face to face discussions. Such venues of discussion can hopefully facilitate brain storming, reflection, questioning, or even confrontation so that a team can draw up a comprehensive design plan.
3. Evaluation: In NWI, although the teacher and students are involved in evaluation, peer assessment is the primary focus. Peer assessment requires that, in addition to grading peer assignments, students must offer suggestions for revision. Students who offer effective suggestions or modifications are awarded additional points towards their overall course grade. Related investigations [2, 14, 24] conferred that the greatest strength of peer assessment lies in its ability to provide students with a greater amount of feedback, i.e., more detailed and more timely, than in a traditional classroom. Peer feedback can then be used to modify the original assignment. Teacher evaluation involves more than merely grading assignment; they must also monitor
student collaboration and determine whether all students are fulfilling course requirements. In addition, teachers should be aware of the possibility of mutual grading to boost scores, mutual boycotting to reduce scores, or inappropriate suggestions when revising the assignment.
In our previous instructional experiences, some administrators or departments remain suspicious of mutual student assessment in completely determining grades. Some individuals suspect that peer assessment helps teachers avoid their responsibilities and doubt whether students have adequate specialized knowledge to grade peer assignments. To quell such suspicions, teachers should actively participate in peer assessment if they choose to adopt this approach.
4. Knowledge Construction: Constructivism espouses that students can develop their own knowledge only if they actively participate in learning. Therefore, NWI encourages students to interact with each other before designing and evaluate others’ assignments after they hand in their own design products. Moreover, NWI facilitates knowledge construction through activities such as brainstorming among teachers and fellow students, asking questions, criticizing, comparing, or exchanging ideas.
Peer Assessment
While surveying 109 peer assessment related studies, Topping [21] defined “peer” as a student with similar educational qualifications or knowledge, who grades or offers suggestions about another student’s work. This evaluation method has already been adopted in several higher education subjects, such as composition writing, civil engineering, sciences, electrical engineering, information, arts, and social sciences. Sluijsmans et al. [19] indicated that peer assessment, as a formative
assessment method and part of the learning process, is valuable because students become more involved in learning and assessment. Although some educators and students remain suspicious over the students’ ability to grade peer assignments, others [6] have demonstrated a high correlation between the marks given by peers and those given by the teacher.
Topping [21] analyzed the merits and limitations of peer assessment, suggesting that students subsequently develop two aspects of understanding: work and theirselves. Evaluating peers’ assignments involves examining the contents, comparing different concepts, analyzing strengths and weaknesses, criticizing ideas, questioning the authenticity of ideas, and offering suggestions on what revisions should be made. Meanwhile, observing others' assignments also provides ample opportunities for one critically reflect on oneself, compare with others, and determine
a direction for self-improvement. The aforementioned abilities are all part of high order thinking ability advocated by cognitive psychology experts [7]. Liu [14] conducted peer assessment among computer science undergraduates, indicating that students substantially improved through cycles of formative peer assessment.
Another study confirmed that most students having engaged in peer assessment favor this innovative approach [8]. Sluijsmans et al. and Topping [19, 21] concluded
that in peer assessment students perfunctorily graded all works highly on some occasions, while they undermined each other by giving excessively low marks on other occasions. Students receiving low marks felt that peer assessment is an inaccurate means of determining one's ability and, therefore, expressed negative feelings towards the process. In addition, workload during peer assessment is more than in a normal course since, in addition to handing in assignments, students must also observe and evaluate those of other students. Some students expressed that peer assessment is a high-pressure process.
While conducting peer assessment, Zhao [24] divided feedback into different quality levels, among which, “critical feedback” is the best, i.e., offering constructive suggestions on weak points in a an assignment as well as explaining in detail the strong points. Zhao [24] also found that critical feedback was reduced when anonymity was difficult to maintain.
Reliability and validity of web-based peer
assessment
Topping [21] surveyed the application of peer assessment in various subjects of higher education from 1980-1996. Of those, 31 research papers mentioned reliability of peer assessment, advocating that the correlation coefficient between peer assessment and teacher grading should be taken as the inter-rater reliability between those grading the work. Twenty five of the 31 papers conferred on a high correlation between peer assessment and teacher grading.
However, reliability and validity, as defined by Topping [21], appear to be somewhat confusing, thus making it impossible to affirm the quality of peer assessment. In Topping's [21] calculation of inter-rater reliability, the graders are teachers and students, not just students, which is inappropriate. In this study, we adopt the classical measurement theory by taking peer assessment inter-rater reliability. According to the true score in classical measurement theory, Gullicksen [11] suggested that reliability can be measured as the value of true score as a proportion of the observed score. In this context, true score refers to the true and unchanging (non
error) part of the measured score. However, in a real environment, this part cannot be measured. Therefore, other methods of deduction must be adopted. For example, the average score of a student that is subject to multiple measurements is the hoped for reliability. Under the basic hypotheses of classical measurement theory, reliability is expressed by the following equation:
S2x: measured score variation S2t: true score variation S2e: error variation
In peer assessment, a reliability indicator should also be used to verify that there is only a slight difference in grades obtained from the same measuring methodology (i.e., the grading of many student evaluators). Namely, there should be strong inter-rater reliability, the correlation coefficient between scores given by all students for a certain assignment. Croker and Algina [4] recommended that when there are only two evaluators, the Spearman ρ rank correlation coefficient can be used and when there are more than three, Kendall’s tau coefficient of concordance can be used.
Validity refers to the level of latent special features that must be measured in the measured score. Some degree of correlation must exist between the measured score and the latent special features (or an external indicator capable of representing said features). This is a part of the common variable. In addition, teacher grading should be taken as an indicator either of the sound logic and appropriateness of peer assessment or of the extent to which the professional standard conforms. Therefore, this should be referred to as the criterion for external validity [4]. According to this concept, the correlation between teacher and peer assessment comes under validity analysis (not reliability analysis) as indicated by [21].
S2x: measures score variation S2co: variations that change with external indicators S2e: error variation
−
=
=
221
22Re
x e x tS
S
S
S
liability
+
−
=
=
2 2 2 2 21
Validity
x e sp x coS
S
S
S
S
Resear ch Methodology
Par ticipants
Participants in the study were 24 graduate students from the Graduate School of Computer and Information Science of National Chiao Tung University, who were enrolled in a course "Web and Database Integration". A networked workshop learning system was also used. Of the subjects, 20 were male and 4 female, ranging between 22-29 years old. These graduate students had passed the university joint entrance and graduate school entrance examinations. In addition to that this course was a core courses in the graduate school, it can be reasonably surmised that the students in this study are very capable students with a high level of willingness to learn.
Resear ch Pr ocess
Research was conducted for the three months, October-December 1999. Details regarding related projects, NWI, peer assessment and teacher grading processes are provided as follows.
Design pr oducts
Students first collaborated with teacher in identifying Web and Database Integration related design themes of their projects. Some topics were generated from teacher-student discussion, e.g., web-based public bus route guidance system, web-based personalized digital library system, web-site recommendation system, web-based book store, and financial simulation system. Work was divided into three parts: survey work compilation, system design and system implementation reports. Survey work compilation required that students collect related papers, web-sites and practical work. After reading and comparison, these reports we arranged into a web-page report. System design required that the student group plan a system design direction that is innovative or has value based on results from the survey work compilation stage and before the system is finished. They had to explain design requirements, functions, meanings and problems to be overcome. System implementation involved implementing the system design plans to a point at which the system should be operational.
Networ ked peer assessment model
1. Two-way (double blind) peer assessment through written reports: the processes of the networked peer assessment model are as follows [14]:
2) The system automatically allocates a peer assessor
3) Each student marks the assignment of a fellow student, offering comments and suggestions.
4) The system passes on grades and comments to the submitting student.
5) The submitting student revises his/her assignment according to the reviewer's comments
6) The teacher grades each assignment, but these marks are not made public.
7) The teacher observes and supervises assessor rating and comments. If unreasonable phenomena are identified, then the student involved may be called to a meeting or an e-mail sent, requesting that grading improvements be made.
The entire peer assessment process is two-way and anonymous. In other words, the assessors and the assessed parties are unaware of each other’s identities. Given that the author is revealed once the oral presentation is made, oral presentations did not begin until after three rounds of web-page reports. Previous research [24] has demonstrated that anonymity makes students more willing to make detailed criticisms and comments, thereby making more emotion-free and objective assessments possible. In addition, each assessor must assess all assignments.
Peer assessment for these three tasks requires only one round, similar to a summary evaluation, and different from the formed peer assessment (whereas upon completion of the evaluation, the submitting student must improve his or her assignment before the second round) used in some investigations [14]. The peer assessment criteria have no detailed division; the sole requirement is that global grading and comments are made for the overall assignment. Before peer assessment, students hold discussions to agree on what constitutes good, medium and poor results. Peer assessment scores range from 30-95.
2. Oral presentation one-way peer assessment
During the oral presentation, students must directly display the system program on a PC screen, explain the direction of survey work compilation and system design concepts. Students conduct one-way anonymous assessment. Each assessor must assess all oral presentations, and all members of each group must orally present their findings.
Assessment orientation is divided into presentation ability (i.e., the clarity with which a student explains the system design), the completeness of slides and transparencies, and the persuasiveness of the conclusion. Assessor scores range from 0-3; very poor, poor, good and very good. After peer assessment, the teacher makes
summary comments and raises problems to stimulate student discussion.
3. Teacher grading
The "teachers" in this study were a class professor and teaching assistant. The assistant was carefully selected for his (or her) ability and previous experience with peer assessment. However, to maintain the integrity of this research, the assistant was not involved in data analysis.
Data Analysis
Owing to the limited number of people (groups), restricted to nine groups and 24 people, experimental research methods could not be used to empirically confirm the effectiveness of NWI. Therefore, qualitative analysis was performed to select the best web-page reports, show the effectiveness of NWI and explain their strong points.
The problem of reliability and validity in this research was resolved by adopting quantitative analytical methods. SPSS8.0 was used to calculate narrative statistics, Pearson's correlation, Kendall’s tau, and their significance test.
Resear ch Questions
Research Question 1: What is the effectiveness of NWI?
Research Question 2: Is peer assessment of a "web-page report" a reliable evaluation method? Is the inter-rater reliability among peers on a "web-page report" acceptable?
Research Question 3: Is peer assessment of a "web-page report" a valid evaluation method? Does a significant positive correlation (external validity) exist between teacher and student assessors on a "web-page report"?
Research Question 4: Is peer assessment of " Oral presentation" a reliable evaluation method? Is the inter-rater reliability among peers on " Oral presentation" acceptable?
Research Question 5: Is peer assessment of " Oral presentation" an effective evaluation method? Does a significant positive correlation (external validity) exist between the teacher and student assessors on "Oral presentation"?
Analysis Results
Research Question 1: NWI yields sever al positive lear ning results. Examples
that are illustrated below.
Figure 1: Concurrent Version Control System
Group 12' s Concur rent Ver sion Control System (Fig. 1)
1. System description: Largely helps prevent version conflict and allows version control when program designers are carrying out concurrent program design on a network. This is a web-based version control system. The user's interface is shown in web format. The files are stored in a database and, as such, a good inquiry and check in/out interface is required. This system slightly differs from conventional version control systems because its files also contain correspondence.
2. Interface design: No attractive interface, but a basic version that fulfills the functional requirements of users is created.
3. System function: The function objectives in the original plan are achieved.
4. Applicability: The effort put into system planning is obvious. Time is also spent on familiarize oneself with the detailed processes of version control applications.
5. Future development: A version control file code naming and management method is proposed, which has feasible industrial applications.
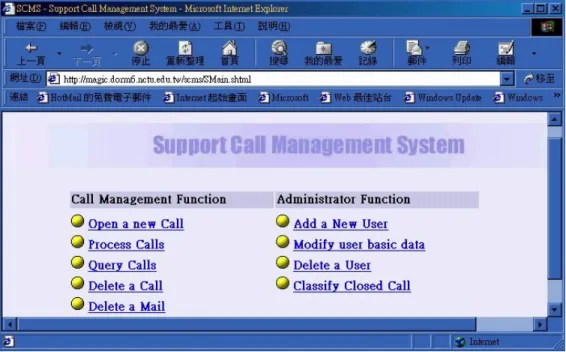
Figure 2: Support Call Management System
Group 1' s Suppor t Call Management System (Fig. 2)
1. System description: This is established on the World Wide Web (WWW) like previous plan management systems. This system can also be used as an internal management system for company customer service departments. It gives each customer a number, storing the content, date and service follow-ups for service items. It also manages the progress, work completion date, and final processing date for service items that engineers are responsible for.
2. Interface design: The design is direct and user friendly.
3. System function: The system can only perform a few simple functions.
4. Applicability: This design product is with new concept and detailed framework planning.
5. Future development: This system can find industrial applications if the concept can be genuinely realized.
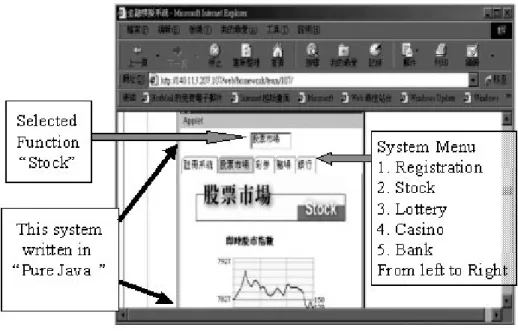
Figure 3: Finance Simulation System
Group 2’s Finance Simulation System (Fig. 3)
1. System description: The system was developed using Java RMI/CORBA technology. It is a finance game simulation environment. Users initially deposit money in a bank account and, then, use this account to make stock market investments, place bets or purchase lottery tickets in order to make money.
2. Interface design: Attractive and suitable interface, a very high level of art design.
3. System function: Many functions have not yet been realized.
4. Applicability: The framework is clearly arranged and can involve many practical economic applications. With further effort, this can become a functionally very powerful system.
5. Future development: This provides an interesting on-line entertainment feature, with promising commercial value.
Research Question 2 and 3: Are the reliability and validity of peer assessment of " web-page repor t" significant? Does a significant positive cor relation exist between peer assessor s (peer assessment inter -r ater reliability)? Does a significant positive cor relation exist between teacher assessor s (teacher assessment inter -r ater reliability)? Does a significant positive cor relation exist between " web-page repor t" teacher and student assessor s (exter nal validity)?
Scores for the web-page report ranged from 30-95%. Cumulatively, 24 people were tested, although no one was allowed to evaluate their own work. Therefore, the 24 students evaluated the work of nine groups. Kendall’s tau analysis of the reliability of assessors revealed that whether conducting a significance test of the reliability of survey work compilation, system design or implementing the system over three rounds of web page reports, the value of χ2 reached a certain level. Restated, the grading of the 24 peer assessors for the nine works and three types of reports resembled each other. That is, the grading given each group differed only slightly.
Table 1: Kendall’s tau harmony index and significance test to measure the grading
reliability of peer assessors for survey work compilation, system design, and system implementation over three rounds of web-page reports
Web-page repor t Number of People (N) Kendall’s tau χ2 Survey work compilation 24 .573 123.755 ** System design 24 .498 107.464 ** System implementation 24 .373 80.637 ** **: p < .01
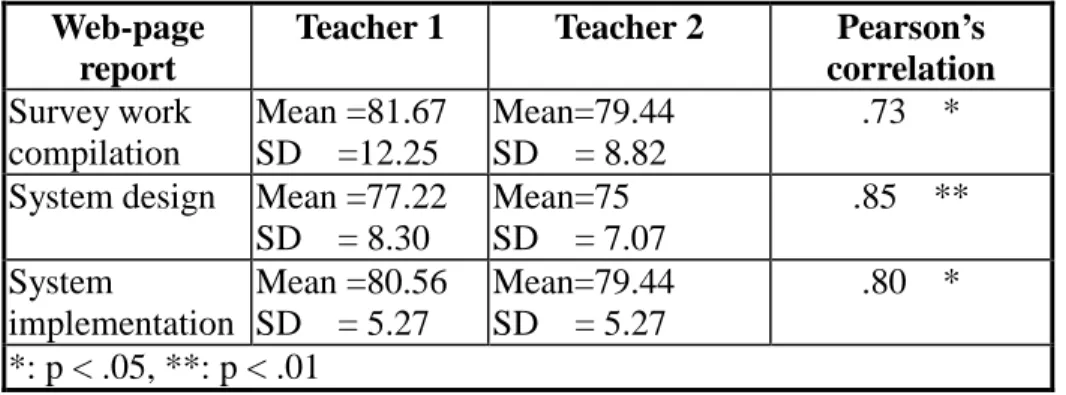
The statistical results in Table 2 show a significant correlation between the grading of the two experts for survey work compilation, system design and system implementation over three rounds of a web-page report. This indicates a high level of reliability in the grading of teachers (teacher and assistant)
Table 2: Narrative statistics, inter-rater reliability correlation coefficient and
significance test on teacher grading of survey work compilation, system design, and system implementation over three rounds of web-page reports
Web-page repor t
Teacher 1 Teacher 2 Pear son’s
cor relation Survey work compilation Mean =81.67 SD =12.25 Mean=79.44 SD = 8.82 .73 *
System design Mean =77.22 SD = 8.30 Mean=75 SD = 7.07 .85 ** System implementation Mean =80.56 SD = 5.27 Mean=79.44 SD = 5.27 .80 * *: p < .05, **: p < .01
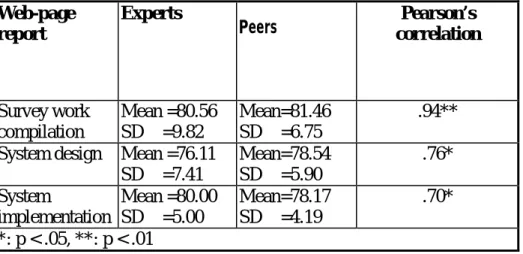
Table 3 reveals a significant positive correlation in teacher and peer grading for survey work compilation, system design and system implementation over three rounds of web-page reports. This finding indicates that when teacher evaluation is taken as an external validity indicator (a suitability indicator) of the quality of work, a high level of correlation exists between peer assessment and the suitability indicator. Therefore, peer assessment appears to be valid.
Web-page report peer assessment is two-way anonymous. That is, assessors are unaware whose work they are grading, and submitting students do not know who has evaluated their work. Consequently, there is a greater likelihood of reliability in grading and suitable external validity. Zhao [24] conferred that anonymity is an important variable in peer assessment. Anonymity makes students more willing to criticize, provide suggestions and prevents factors such as friendship from interfering with the assessment [19].
Table 3: Narrative statistics, correlation between the two, and significance tests, for
teacher and peer grading of survey work compilation, system design, and system implementation over three rounds of web-page reports. The peer assessment score is the average value of the scores given by all the students.
Web-page repor t
Exper ts
Peers cor relationPear son’s
Survey work compilation Mean =80.56 SD =9.82 Mean=81.46 SD =6.75 .94**
System design Mean =76.11 SD =7.41 Mean=78.54 SD =5.90 .76* System implementation Mean =80.00 SD =5.00 Mean=78.17 SD =4.19 .70* *: p < .05, **: p < .01
Research Question 4 and 5: Ar e the reliability and validity of peer assessment of " Or al presentation" significant? Does a significant positive cor relation exist between peer assessor s (peer assessment inter -r ater reliability)? Does a significant positive cor relation exist between teacher assessor s (teacher assessment inter -r ater reliability)? Does a significant positive cor r elation exist between " or al presentation" teacher and student assessor s (exter nal validity)?
good. Table 4 summarizes analysis results based on Kendall’s tau for inter-rater reliability. According to this table, regardless of whether conducting a significance test of the reliability of survey work compilation, system design and system implementation over three rounds of web page reports the value of χ2 reached a certain level. Namely, the grading of the 24 peer assessors for the nine design products and three types of oral report resembled each other. That is, the grading given each group only slightly differed.
Table 4: Kendall’s tau harmony index and significance test for the reliability of peer
assessment of survey work compilation, system design and system implementation over three rounds of oral presentation
Web-page repor t Number of People (N) Kendall’s tau χ2 Survey work compilation 24 .498 95.683 ** System design 24 .154 33.319 ** System implementation 24 .079 16.983 * *: p < .05, **: p < .01
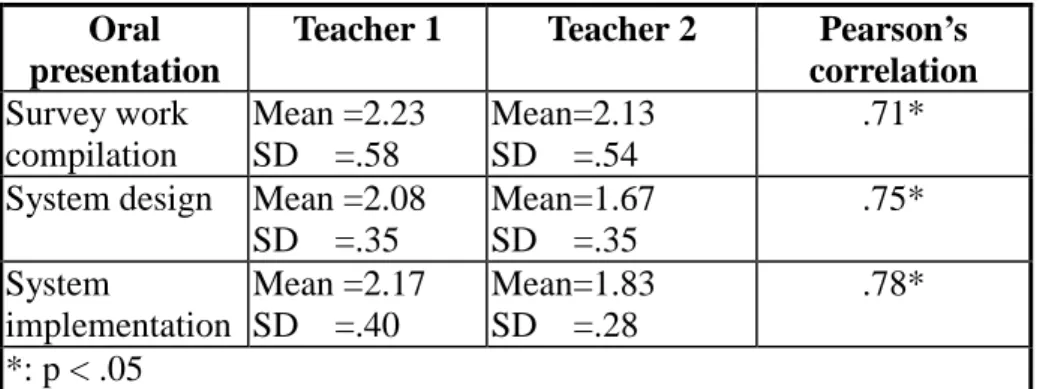
Table 5 shows a significant positive correlation between the two teachers' grading of survey work compilation, system design and system implementation over three rounds of oral presentation. This finding indicates a high level of reliability in the grading of teachers.
Table 5: Narrative statistics, inter-rater reliability correlation coefficient and
significance test on teacher grading of survey work compilation, system design, and system implementation over three rounds of oral presentation
Or al presentation
Teacher 1 Teacher 2 Pear son’s
cor relation Survey work compilation Mean =2.23 SD =.58 Mean=2.13 SD =.54 .71*
System design Mean =2.08 SD =.35 Mean=1.67 SD =.35 .75* System implementation Mean =2.17 SD =.40 Mean=1.83 SD =.28 .78* *: p < .05
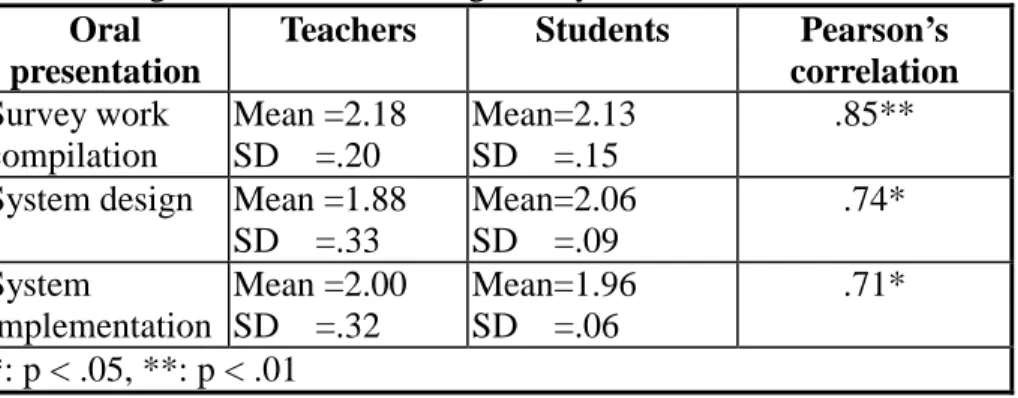
Table 6 reveals a significant and positive correlation between teacher and peer grading of survey work compilation, system design and system implementation over three rounds of oral presentation. This figure also indicates that when teacher grading is taken as an external validity indicator (a suitability indicator) of the quality of work, a high level of correlation exists between peer assessment and the suitability indicator. Therefore, peer assessment appears to be valid.
Table 6: Narrative statistics, correlation between the two, and significance tests, for
teacher and peer grading of survey work compilation, system design, and system implementation over three rounds of web-page reporting. The peer assessment score is the average value of the scores given by all students.
Or al presentation
Teacher s Students Pear son’s
cor relation Survey work compilation Mean =2.18 SD =.20 Mean=2.13 SD =.15 .85**
System design Mean =1.88 SD =.33 Mean=2.06 SD =.09 .74* System implementation Mean =2.00 SD =.32 Mean=1.96 SD =.06 .71* *: p < .05, **: p < .01
Conclusions
This study has demonstrated that when the NWI method is applied to a computer and information science course at graduate level, where the students are capable and highly motivated, the overall performance of students was excellent. Unfortunately this research can not answer some of the deeper questions. For example, Does NWI encourage better learning results, or were the final results good because the test subjects were already capable and motivated? When it comes to improving learning results, which of the four key elements in NWI, i.e., presentation, discussion, peer assessment and constructivism, predominate? Such questions require further research and the application of standard empirical methods (e.g., random sampling, experimental design and control groups)
Although networked peer assessment is both reliable and valid, the number of subjects in this research was insufficient, and the students were capable and motivated graduate students. Whether this method retains the same level of reliability and viability when applied to ordinary students is worth exploring. However, we strongly recommend the use of NWI to university professors as an innovative teaching method in their classrooms.
of this research were not randomly selected. Therefore, care should be taken when drawing conclusions from our findings. Owing to the small number of subjects, the number of groups formed was also small, possibly leading to a bias in the correlation coefficients. Owing to the innovativeness of NWI, students cooperate with each other owing to the novelty of their assignment. Consequently, future research should undertake a longer study period to determine whether the cooperation level among authors is maintained.
Acknowledgements
The authors would like to thank the National Science Council, Taiwan, R.O.C, for financially supporting this research under Contract No. NSC89-2520-S-009-016.
Refer ences
1. D. E. Arrendondo, and T. T. Rucinski, “Using the Workshop Approach in
University Classes to Develop Student Metacognition,” Innovative Higher Education, Vol. 18, 273-288, 1994.
2. R. L. Bangert-Drowns, C. L. C. Kulick, J. A. Kulick, and M. T. Morgan, “The instructional effect of feedback in test-like events,” Review of Educational Research, Vol. 61, 213-238, 1991.
3. W. Cheng, and M. Warren, “Peer and teacher assessment of the oral and written tasks of a group project,” Assessment & Evaluation in Higher Education, Vol. 24, 301-314, 1999.
4. L. Croker, and J. Algina, “Introduction to classical and modern test theory,” NY: Harcourt Brace Jovanovich College publishers, 1986.
5. F. J. R. C. Dochy, and L. McDowell, “Assessment as a tool for learning,” Studies in Educational Evaluation, Vol. 23, 279-298, 1997.
6. N. Falchikov, “Group process analysis: self and peer assessment of working
together in a group,” In S. Brown & P. Dove (Eds.) Self and Peer assessment (15-27). Birmingham, UK: Standing Conference on Education Development, 1991.
7. J. H. Flavell, “Cognitive development (2nd ed.),” Englewood Cliffs, NJ: Prentice Hall, 1985.
8. T. Gatfield, “Examining student satisfaction with group projects and peer assessment,” Assessment and Evaluation in Higher Education, Vol. 24, 365-377, 1999.
9. C. Gale, J. R. Bourne, B. Thompson, “Creating a workshop on the World Wide Web: The experiences of Internet 101,” In ERIC database ED429533, 1997.
10. G. S. Goldstein, “Using a Group Workshop to Encourage Collaborative Learning in an Undergraduate Counseling Course,” Teaching of Psychology, Vol. 20, 108-110, 1993.
11. H. Gullicksen, “Theory of mental test,” Hillsdale, NJ: Lawrence Erlbaum Associates, 1987.
12. A. G. Hall, “A Workshop Approach Using Spreadsheets for the Teaching of Statistics and Probability,” Computers and Education, Vol. 25, 5-12, 1995.
13. A. M. Ingham, and J. K. Gilbert, “The Workshop-Interview Technique in Higher Education: A Versatile Method for Selection and Monitoring of Science Students,” Assessment and Evaluation in Higher Education, Vol. 17, 29-43, 1992.
14. E. Z. F. Liu, “Networked peer assessment system: an analysis of student segments,” A thesis for the master degree of Computer and Information Science of National Chiao-Tung University, 1999.
15. C. J. McKinley, and W. R. Stoll, “A Method of Improving Student Learning in Physiology: The Small Group Workshop,” Advances in Physiology Education, Vol. 11,
16-23, 1994.
16. M. Resnick, “Beyond the Centralized Mindset,” Proceedings of the International Conference on the Learning Sciences, 1997.
17. W. M. Roth, “From everyday science to science education: how science and technology studies inspired curriculum design and classroom research,” Science and Education, Vol. 6, 372-296, 1997.
18. D. L. Schwartz, J. B. Black, and J. Strange, “Dyads have a fourfold advantage over individuals inducing abstract rules,” Paper presented at the Annual Meeting of the American Educational Research Association, Chicago, 1991.
19. D. Sluijsmans, F. Dochy, and G. Moerkerke, “Creating a learning environment by using self-, peer- and co-assessment,” Learning Environments Research, Vol. 1, 293-319, 1999.
20. P. C. Taylor, and B. J. Fraser, “CLES: An instrument for assessing constructivist learning environments,” Paper presented at the annual meeting of the National Association for Research in Science Teaching, Lake Geneva, WI, 1991.
21. K. Topping, “Peer Assessment Between Students in Colleges and Universities,” Review of Educational Research, Vol. 68, 249-276, 1998.
22. W. Veen, I. Lam and R. Taconis, “A virtual workshop as a tool for collaboration: towards a model of telematic learning environments,” Computers Educ., Vol. 30,
31-39, 1998.
23. T. R. Vierheller “A workshop on UNIX, Workstations, and Internet Connections,” Journal of College Science Teaching, Vol. 27, 39-43, 1997.
24. Y. Zhao, “The effects of anonymity on computer-mediated peer review,” International Journal of Educational Telecommunications, Vol. 4, 311-345, 1998.
Abstr act title:
A content analysis of online discussion for networked collaborative design
Authors and affiliations:
Sunny S.J. Lin*, Chuen-Tsai Sun **
*Center for Teacher Education, National Chiao Tung University, Hsinchu, 300, Taiwan
**Department of Computer and Information Science, National Chiao Tung University, Hsinchu, 300, Taiwan
Type of presentation preferred: poster
Name of one author of correspondence: Sunny S.J. Lin Postal address of corresponding author:
Dr. Sunny S.J. Lin, Center for Teacher Education, National Chiao Tung University, 1001 Ta Hsueh Rd., Hsinchu 300, Taiwan
E-mail of corresponding author: [email protected] Tel: 886 (3) 573-1714
Fax: 886 (3) 573-8083
Key topic: web-based collaborative design, Vee heuristic, computer conferencing, metacognition, content analysis
A content analysis of online discussion for networked collaborative design I. Purposes of the study
Many researchers and educators have promoted the use of technology to create a shared space among learners (Schrage, 1995). Fabos and Young (1999) found that most projects using internet-based communication in teaching and learning have claimed to effectively enhance participants’ cognitive and social skills with fewer limitations on time, location, and delivery cost. Therefore, in this study we grouped computer science undergraduate students for web-based collaborative design in a programming course. They used the web-based Vee system as a design aide and online discussion for critical inquiry, brain storming, and social knowledge construction.
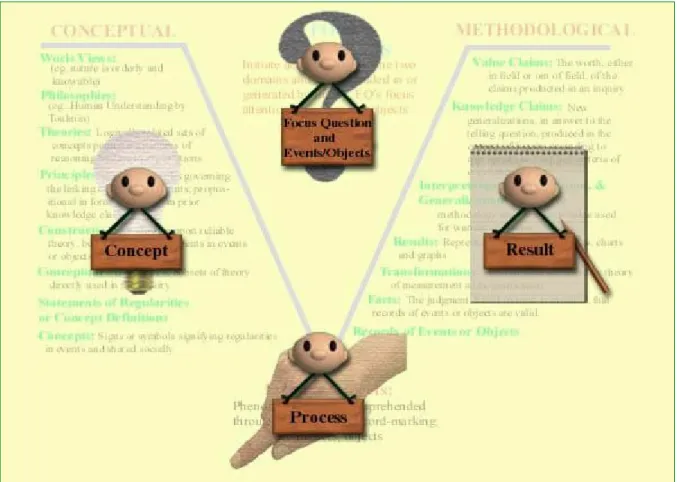
Novak and Gowin (1994) provide vee heuristic as a metacognitive aide for science exploration or design. The Vee diagram (in Figure 1) consists of four components: Focus Questions, Events/Objects, Conceptual Activities, and
Methodological Activities. In this study, participants were asked to discussion and, first of all, to specify their focus question or what the designers intended to do. They had to present their focus questions in hypertext format for demonstration on the Web. In doing so, we hope to promote cognitive modeling (Collins, Brown, & Newman, 1989) among groups. Then in the second stage, they had to choose a designing event or object and to express the reasons why they chose the event or object as well as the principles behind this selection. Also, they had to provide theories, concepts, or any previous works possible for guiding the design. In the third stage, students were required to connect concepts and methodology of designing, the so-called active interplay in Vee diagram, and provide the initial outcome of design task. Finally, each group had to reflect the whole design process and modify the initial design outcome, then to complete the final product. At each stage, each team had to present their design task on the Web.
(Insert Figure 1 here)
In the design process, members of each team were encouraged to discuss (within group) through a web-based chat room and to post design relevant information
(between group) on a Broadcasting Board Specialized (BBS). Content analysis for online discussion is an emerging research area. It needs more empirical studies to form some effective tools or guidelines for analysis methods. Henri (1992) identified five dimensions for analysis of online discussion from surface features to deep embedded learning features as well as from social to cognitive perspectives: 1) the participation rate, 2) interaction style, 3) social cues, 4) cognitive skills, and 5) metacognitive skills. Hara, Bonk, & Angeli (2000) has empirically tested the above 5 dimensions and provided initial description about its reliability and validity. Therefore,
this study used these dimensions with a slight modification to fit the particular situation for analysis of discussion during collaborative design. The content of online discussion was analyzed to examine 1) the amount of paragraphs the highly
competent and less competent groups generated in on-line discussion during
programming design, 2) the process of web-based collaborative design, 3) the social dynamics among team members. These also were the research questions of this study.
II. Methodology
II.1. Subjects
The subjects of this study included 36
undergraduate
computer
science
students
enrolled in “Artificial Intelligence” class during
2000 spring semester in a research university in
Taiwan. They were randomly grouped into 12
teams, three students in one team. Two high
competent and two less competent teams were
selected for further content analysis and the
description were in the result section.
II.2. Task and Procedure
Part of the course requirement asked each team to design a Java program to simulate the evolution of any species. For example, one team simulated the evolution of zebra and how body strips of zebra adapted to various environments; while another team simulated how computer virus evolve to survive from anti-virus programs and successfully infect programs of other online computers. The program should include various evolution conditions, such as mutation, breeding, enemy, food supply, and color adjustment with environment. Each team had to upload the design task to the system four times in the stages of focus question, design event/object, design methodology and initial outcome, as well as final outcome. The uploaded tasks (in Chinese) were displayed at the following web site: sandy.cis.nctu.edu.tw/~colearn/ page1.html.
The web-based collaborative design system, CORAL Vee, (in Figure 2)
contained seven modules: user registration, system announcement, chat room, BBS, task demonstration, simulation experiment, and production. Figure 3 depicted
homepage of the electronic Vee diagram. The system was performed by retrieving and storing DBMS’s (Data Base Management System) information through CGI program. Detail description about the system refers to Sun and Lin (in press).
Two raters, a doctoral student and a master student in computer science who had obtained two-year training of educational research, rated the design projects. They independently graded (scores range from 35 to 100) team projects in four stages and the inter-rater correlations were significant in all stages (t = 0.51 ~ 0.67, all ps < .01).
Two raters also worked together in content analysis about the online discussion. Content analysis revealed three dimensions of online discussion: the participation rate (raw number of discussion sentences), the creativity of design (raw number of
innovative design ideas and how flexible is a team in designing evolution program), the cognitive procedure of design, and social cues. Any sentence could conceivably contain several ideas, so the base “unit” of the analysis was not a sentence, but a paragraph. When one paragraph contained two ideas, it was counted as two separate units. Two raters coded paragraphs separately along four dimensions and the
inter-rater consistency was 72% for the creativity of design, 75% for the cognitive procedure, and 76% for social cues. Hara, Bonk, & Angeli (2000) suggested that such coding agreement among raters is adequate given the subjectiveness of coding
criteria.
III. Findings
III.1. The high competent and less competent groups
In Table 1, two teams (nos. 4 and 5) gained highest average scores and thus were categorized as the high competent teams and they also produced substantial amounts of online discussion sentences (1816 and 807). While two other teams (nos. 11 and 5) gained lowest scores were named less competent teams and produced few online discussion sentences. Thus, those who performed better in design evolution programming project discussed more.
(Insert Table 1 here)
III.2. The amount of paragraphs that the highly competent and less competent groups generated in on-line discussion during programming design
Table 2 shows discussion contribution (raw number of paragraphs) made by each member in four design stages among teams. Obviously, some members produced far more paragraphs than others both in high or less competent teams. For example, in the 4th team if three members contributed equally to discussion, then each member were to generate 33% (82 paragraphs) of total paragraphs. However, the first member generated 45 paragraphs, the second 104 paragraphs, the third 97 paragraphs, and the difference was very significant (X2 = 78.78, p < .01). For the two competent teams, paragraphs produced in various stages were significantly different. The 8th team discussed more in the first and second stages in forming focus questions and design orientation; whereas the 4th team discussed more in the last two stages during design
outcome production. In addition, in various stages high competent teams discussed more than the less competent teams.
(Insert Table 2 here)
III.3. The process of web-based collaborative design
Figure 4 depicted the process of web-based collaborative design observed in the study. This flow chart illustrated the underlining cognitive and metacognitive
processes in discussion as well as their trial and error in designing a Java program of evolution simulation. In the first and second stages, team members mainly engaged in brain storming for a better or innovative focus question as well as design
objects/events. It is very likely that the creativity of a design product is determined in the initial step of designing process. Also, the coding result showed that both high and less competent teams could generate innovative ideas. However, the less competent team generated slightly fewer ideas. The 8th team generated 10 distinctive ideas, the 4th team 5, the 11th team 4, and the 5th team 3.
(Insert Figure 4 here)
However, in the third and final stage of designing, team members were mainly engaged in planning, monitoring, and regulation. When team members went a step further, they always check how well the original plan worked in terms of feasibility, time limit, and functionality. In sum, it is a very typical process of metacognition. The high competent teams displayed a very complicated metacognitive process and that is what the less competent teams lacked.
III.4. The social dynamics through online discussion
In examining the social cues of discussion, team members’ conversation was very formal and polite in the first several days. When the design process went further, they became more and more relax, less formal, and even fooling around. There is always a leader, some active but others passive, made the final decisions or voted critically. Leaders were always in a higher grade level (senior students) and performed leadership in a democratic style. All leaders showed respect to expertise and tried to maintain a volunteering but fair partnership in design.
Acknowledgements
The authors would like to thank the National Science Council of the Republic of China for financially supporting this research under Contract No. NSC
89-2520-S-009-016.
IV. References
Teaching the crafts of reading, writing, and mathematics. In L. B. Resnick (Ed.),
Knowing, learning, and instruction: Essays in honor of Robert Glaser (pp. 453-494).
Hillsdale, NJ: Lawrence Erlbaum.
Hara, N., Bonk, C. J., & Angeli, C. (2000). Content analysis of online discussion in an applied educational psychology course. Instructional Science, 28, 115-152.
Henri, F. (1992). Computer conferencing and content analysis. In A. R. Kaye (ed.),
Coolaborative learning through computer conferencing: The Najaden papers (pp.
115-136). New York: Springer.
Novak, J. D., & Gowin, D. B. (1984). Learning how to learn. Cambridge University Press, Cambridge.
Schrage, M. (1995). No more teams: Mastering the dynamics of creative collaboration. New York: Currency Doubleday.
Sun, C. T. & Lin, S. S. J. (In press). Network-based Cooperative Design: Environment, Learning, and Evaluation. IEEE Transaction on Education.
Table 1
Scores and online discussion sentences of high and less competent teams in four stages of design process.
Category team# Stage1: Focus question Stage 2: design event/object Stage 3: methodology /initial outcome Stage 4: Final outcome Subtotal Online discussion sentences 8 100 75 90 70 83.75 1816 High competent 4 85 50 80 90 76.25 807 11 100 80 45 40 66.25 114 Less competent 5 80 45 60 60 61.25 340 Table 2
Numbers of online discussion paragraphs contributed by each team members in the high and less competent teams in four stages of programming design process and Chi square examination of frequency homogeneity.
Team # Member# Stage1: Focus question Stage 2: Design event/object Stage 3: methodology /initial outcome Stage 4: Final outcome Subtotal X2(df) 1 106 72 33 35 246 2 81 26 26 9 142 3 30 13 6 5 54 8 Total 217 112 65 49 442 155.28(3)** X2 (df) 41.48(2)** 51.95(2)** 18.12(2)** 32.49(2)** 125.39(2)** 1 7 7 15 16 45 2 20 4 23 57 104 3 15 9 33 40 97 4 Total 42 20 71 113 246 78.78(3)** X2 (df) 6.14(2)* 1.9(2) 6.87(2)* 22.53(2)** 25.34(2)** 1 22 3 0 0 25 2 5 1 0 0 5 3 1 1 0 0 2 11 Total 28 5 0 0 32 X2 (df) 1 15 30 0 3 48 2 45 20 0 19 84 3 3 5 0 2 10 5 Total 63 55 0 24 142 17.93(3)** X2 (df) 44.57(2)** 17.27(2)** * p< .05; ** p < .01
Figure 1. The Vee Heuristic
Figure 2: The homepage of CORAL-Vee for the promotion of students’
collaborative design. Web address: sandy.cis.nctu.edu.tw/~colearn/ page1.html.
F o c u s Q u e s tio n s A c ti v e I n te r p la y C o n c e p tu a l M e th o d o lo g ic a l W o r ld V i e w s P h ilo s o p h i e s T h e o r ie s P r in c ip le s C o n s tr u c ts C o n c e p tu a l S tr u c tu r e s S ta te m e n ts o f R e g u la r itie s C o n c e p t D e f in itio n s C o n c e p ts V a lu e C la im s K n o w le d g e C la im s I n te r p r e ta tio n s E x p la n a tio n s G e n e r a liz a tio n s R e s u lt s T r a n s f o r m a tio n s F a c t s R e c o r d s o f E v e n ts R e c o r d s o f O b je c ts E v e n ts /O b je c ts
31 Figure 4: The process of web-based collaborative design observed in designing Java program on evolution simulation.
Design Method/Initial outcome
Recall evolution setting Recall evolution variables Decision initial values of variables Decision final values of variables Feasibility Time limit Functionality
Plan Monitor Regulation
Design Object/Event Decision evolution setting Decision evolution variables Brain storming Between group comparison Idea questioning Innovation Feasibility Time limit