行政院國家科學委員會專題研究計畫 成果報告
員工認股權分配與企業績效及企業價值關連性之研究
研究成果報告(精簡版)
計 畫 類 別 : 個別型 計 畫 編 號 : NSC 95-2416-H-002-027- 執 行 期 間 : 95 年 08 月 01 日至 96 年 07 月 31 日 執 行 單 位 : 國立臺灣大學會計學系暨研究所 計 畫 主 持 人 : 葉疏 計畫參與人員: 博士班研究生-兼任助理:李貴富 報 告 附 件 : 出席國際會議研究心得報告及發表論文 處 理 方 式 : 本計畫可公開查詢中 華 民 國 96 年 10 月 31 日
中文摘要
本研究探討企業分配員工認股權予高階主管和一般員工的比重,以及高階主管和一般 員工持有之員工認股權是否對企業經營績效與價值有不同的影響。該研究亦加入公司 治理變數,檢驗公司治理良莠是否影響上述關係式。本研究發現,公司治理愈佳之企 業,發放給高階主管的員工認股選擇權比例愈低。以整體樣本來看,員工認股選擇權 對營業淨利和企業價值間的關聯性在發放給高階主管的部份弱於發放給一般員工的部 份。但將樣本以公司治理程度高低區分為兩組時,在公司治理較差(佳)之樣本,高 階主管認股權證與企業績效和價值的關連性顯著低(高)於一般員工取得之認股權證。 敏感性測試中控制選擇發放員工認股權證之內生性影響後,結論並無顯著差異。綜合 來說,本研究結果指出公司治理較差之企業,傾向發放較高比例之高階主管認股權證, 且顯示由這些認股權證中獲得之效益相對較低。 關鍵字:公司治理、員工認股權、一般員工認股權、高階主管認股權Abstract
We examine the determinants and consequences of the split of options between executive and non-executive employees. We find that the proportion of options granted to executives is lower the stronger is firm governance. For the sample as a whole, the relation between options and both operating income and valuation is weaker for executive options than for options to lower level employees. Splitting the sample between weak and strong governance firms, for the weak (strong) governance firms, the relation between executive options and firm performance and valuation is weaker (stronger) relative to non-executive options. Results are robust to controls for the
endogeneity of option granting choice. Taken as a whole, our results suggest that firms with relatively weak governance tend to give a larger proportion of options to executives and appear to receive relatively less benefit from those options.
Key words: Employee Stock Options, Executive Stock Options, Broad-Based Options, Governance
1. Introduction
A growing body of literature examines the consequences of options for valuation and performance. Because of the nature of the data, most researchers consider either executive options from proxy statements or total options from financial statement footnotes. However, there are many reasons to believe that executive options have different costs and benefits than broad-based plans. Our goal in this paper is to consider explicitly determinants of the decision of how to split options between executive and non-executive employees, and the effect of that decision on the relative valuation and performance implications of options.
Existing literature has investigated links between option compensation, and both valuation and future profitability. For example, Bell, Landsman, Miller, and Yeh (2002) finds that, for a sample of profitable software companies, the market appears to value outstanding options as assets, suggesting that outstanding options enhance expected future cash flows. Similarly, Aboody, Barth, and Kasznik (2004) considers a sample of small to medium firms and provides evidence that the market values options as an expense, especially once future earnings growth is controlled, suggesting that options represent an asset which is used up over the life of the options. Their focus is on total options outstanding and they do not differentiate between executive and broad-based options. Similarly, Hanlon, Rajgopal, and Shevlin (2003) focuses on executive options and finds that higher levels of options tend to be associated with future profitability, suggesting that options have positive incentive properties.
It seems fairly clear that the effect of options on firm performance and valuation might depend on the level of employees to whom they are granted. Executive options, for example, are more likely to have significant incentive effects because executives have more control over factors that affect share price. As a consequence, options granted to executives have the potential to provide greater benefits to the firm. On the other hand, if executives have significant influence over compensation packages, it is possible that option grants may be excessive, potentially reducing or eliminating these benefits.
Bebchuk and Fried (2004) argues that compensation schemes are primarily a result of managerial power rather than optimal contracting and provides evidence that executives with greater power receive more pay.1 They suggest that, as a consequence, executives may earn excessive compensation, especially when governance is relatively weak.2 Consistent with that assertion, recent cases such as those involving Tyco and the NYSE suggest a link between relatively weak governance oversight and excessive compensation. This argument is particularly relevant for options because they are typically not expensed and, hence, it may be easier to argue that they have little cost. If so, it is possible that options granted to executives may have reduced incentive effects and valuation implications. This reasoning underlies, at least in part, some of the recent calls for option expensing.
1 See also Core, Guay and Thomas (2005) for counter-arguments.
2 Consistent with that argument, Core, Holthausen and Larcker (1999) examines the relation between governance,
CEO compensation and firm performance for a sample of 205 firms during 1982-1984 and provides evidence that CEOs of firms with weaker governance, and hence greater agency problems, extract greater compensation and such firms have worse future performance.
Beyond the direct implications of excess compensation, options may also have troubling incentive effects, especially if coupled with weak oversight. For example, executives with excess option compensation may have increased incentives to manipulate earnings or take other actions to artificially inflate share price (Bergstresser and Philippon, 2006; Erickson et al., 2006) or to increase risk (Rajgopal and Shevlin, 2002). As a consequence, high levels of executive option compensation coupled with relatively weak governance may not increase value
sufficiently to justify their cost and may even, in the extreme, reduce shareholder value.3
Lower-level stock options are less likely to have some of the problems of executive options, but raise their own set of issues. It has been argued, for example, that broad based option plans are not optimal because of the risk/reward tradeoff for lower-level employees (Hall and Murphy, 2003). To the extent that lower-level employees have limited ability to influence share price and are risk averse, it is possible that options are less efficient than traditional forms of compensation. Potentially exacerbating that issue is the possibility that, if lower-level employees are relatively more risk averse, options will be a more expensive form of
compensation (Hall and Murphy, 2002; Meulbroek, 2001). On the other hand, some have argued that broad-based option plans can perform important retention and sorting functions (Ittner et al., 2003; Oyer and Schaefer, 2005) and tie compensation to changes in employees’ reservation wages (Oyer, 2004).
Compared with executive options, it is more difficult to argue why firms would grant broad-based options if they were not optimal. However, even in the case of lower-level
employees, option granting may reflect the fact that options have not traditionally been expensed under GAAP. In particular, studies including Hall and Murphy (2003) have argued that many choices with respect to options appear to be driven by accounting treatment.4 Employers may be more willing to grant options, even if they are not optimal, since this form of compensation enables them to avoid expense recognition.
The notion that the implications of options may differ by level in the company is also reflected in decisions by legislators and regulators. For example, proxy statements require disclosure of option holdings as part of executive compensation, while not requiring similar disclosure for employees deeper in the organization, apparently reflecting a belief that the
incentive effects of options are likely different for top executives than for lower-level employees. Similarly, the House of Representatives overwhelmingly passed the Stock Option Accounting Reform Act, which would limit option expensing to executives in the firm, arguing that options do not constitute an expense when awarded to lower-level employees. The underlying notion appears to be that executive options are likely to be excessive and should be discouraged while options to lower-level employees should be encouraged. While it is difficult to see a strong conceptual rationale for a difference in the accounting treatment of options for executives
3 That raises the question of why firms would provide compensation that was not optimal from a shareholder
perspective. As argued in papers such as Gompers et al (2003), governance problems may result in decisions that, viewed in isolation, are not optimal from a shareholder perspective, but reflect a more general decision about balance of power in the organization.
4 Consistent with the notion that compensation design is affected by accounting treatment, Carter and Lynch (2003)
provides evidence that firms changed option terms around changes in the accounting treatment of option repricings.
relative to lower-level employees, even if the costs or incentives differ, it is clear that many view the costs and incentive effects of options as differing across levels of the firm.
Our analysis is based on an examination of the profitability and valuation implications of options, splitting between higher- and lower-level employees. An advantage of comparing the two types of options is that many of the incentives for issuing options are (at least partially) naturally controlled. For example, if firms choose options because they are not expensed for financial reporting, it would not necessarily affect the mix of executive versus lower-level options since both sets are accounted for analogously. Both sets of options are typically treated similarly for tax purposes, so differences in tax incentives should not affect the mix. Also, if options are favored by firms with cash constraints, the incentives should be similar for both types of options. Of course, that raises issues of why otherwise similar firms would choose a
different option mix. Because of the potential endogeneity, we include estimation approaches that take into account the potential simultaneity of option mix choice.
We begin by examining determinants of the split of option grants between executives and lower-level employees.5 We have two primary interests here. First, if we understand determinants of option grants, we are in a better position to address why options distribution differs across firms. Of particular interest is the relation between the proportion of options granted to executives and governance, since one of the concerns with executive option grants is the effect of governance. This setting is particularly interesting since the comparison is effectively within firm, allowing differences in firm-wide factors such as capital needs and accounting considerations to be naturally controlled. We find, among other things, a significant relation between governance, as measured by the “Governance Index” from Gompers, Ishii, and Metrick (2003), and the extent to which option grants are concentrated in the executive suite, suggesting that executives receive a greater proportion of options when governance is relatively weak.
Next we examine the relation between executive and broad-based options, and operating income and equity market value. We examine operating income and market value because there are difficult design issues with both measures and consistent evidence across the two provides greater confidence in the results. Further, operating income captures the effect on realized near-term performance while market value captures the market’s assessment of the likely effect on future performance. As noted earlier, findings in Hanlon et al. (2003) suggest a positive relation between executive options and future operating income. Our interest is in the relative size of the coefficient estimates across the two groups since we recognize that omitted correlated variables and noise can influence the coefficient levels.
We conduct our analysis both with ordinary least squares and with controls for
5
As discussed below, because of the nature of publicly-available data, we are limited to splitting options between the top five executives and other employees in the firm. For convenience, we refer to the top five executives as “executives” and the remaining employees receiving options as “non-executives,” and refer to plans as
“broad-based” when a substantial proportion of options are granted to employees below the top five. Our assumption is that firms that grant a larger proportion of options below the top five executives distribute options deeper into the organization. However, we cannot explicitly track the actual employees receiving options below the top-five executives.
endogeneity using a two-stage least squares estimation approach. In particular, our concern is that factors including profitability and market value might affect the choice of how deep in the organization to grant options. We address this concern by using the original specification for the determinants of option split to obtain instruments for executive and non-executive options which are then used to estimate the operating income and market valuation regressions.
Our results suggest that, in general, the coefficient on executive options is smaller than for lower-level options, particularly after controlling for endogeneity. We conduct a similar analysis for market value following Bell et al. (2002) which finds that options carry a positive coefficient in valuation. Consistent with the results for operating income, we find that, on average, the coefficient for executive options is smaller than for options deeper into the organization. Again, results are especially strong after including controls for endogeneity.
On the surface it may seem surprising that the effect of options appears to be smaller for executives than for lower-level employees since, from a risk/incentive perspective, it seems likely that executives have more control over firm performance and may be less risk averse. However, as noted earlier, one potential explanation is the effect of governance. If option grants to executives are excessive with relatively weak oversight or if options create pathological incentives (e.g., to manage earnings or increase risk) in the face of weak governance, the value of options in firms with weak governance may be weaker. To investigate this possibility, we examine the relative consequences of options for earnings and valuation by splitting the sample based on governance as measured by the Governance Index. Our results suggest that the relation between options and performance is a function of governance in the sense that executive options have the strongest relation to income and valuation in the presence of strong governance. In particular, in the absence of strong governance, executive options have little or negative
consequences for valuation and future profitability.
Taken as a whole, our results make several potential contributions. First, they suggest the importance of differentiating between executive options and options to lower-level employees. Papers in the literature often do not differentiate between executive options and lower-level options.6 However, there are a variety of reasons to expect option costs and benefits to differ based on employees’ levels in the company. Further, our results highlight the importance of controls for endogeneity. Although controls for endogeneity do not fundamentally change our primary conclusions, they do affect the point estimates and strength of our conclusions.
6 An exception is Ittner et al. (2003) which examines the structure and performance consequences of equity grants
for a proprietary dataset of new economy firms with relatively detailed compensation data. They provide evidence that option granting behavior is significantly different relative to old economy firms. New economy firms indicate that employee retention and attraction is a primary goal of option issuance, and their empirical results suggest that employee retention (but not attraction) is an important determinant of grants to new employees (but not existing employees) across all levels of the organization. Further, they provide some evidence that lower than expected option grants are associated with lower future stock returns and return on assets two years in the future, but little evidence that firms with higher than expected option grants have lower subsequent performance. Another exception is Callaghan et al. (2006), which shows that stock option grants to executives and lower-level employees are value creating for the firm. Although these findings appear to contradict ours, their tests are based on separate estimations for executive and non-executive employees, which contrasts with our tests that include both employee grants simultaneously.
Second, we provide exploratory evidence on the net benefits of options at varying levels in the organization. Admittedly, it is extremely difficult to draw strong inferences about benefits of various compensation schemes based on evidence such as that in this paper. However, in the spirit of Hanlon et al. (2003) and Bell et al. (2002), our point is that the level in the organization that options are granted may be important to understanding the implications of options.
Third, the findings complement research such as Gompers et al. (2003) on potential reasons for a link between governance and performance. In particular, the findings in Gompers et al. (2003) suggest that weak governance is associated with poor firm performance (although Core, Guay, and Rusticus (2006) question that conclusion). Consistent with Core, Holthausen and Larcker (1999), our results suggest a link between weak governance, executive
compensation and firm performance.
Fourth, our findings suggest that disclosure of options by level in the company may be useful in understanding the implications of options for investors. Currently, footnote option disclosure is aggregated across all options outstanding. However, to the extent that options at different levels in the organization have different valuation implications, disaggregation across levels may be important.
The remainder of the paper is organized as follows. Section 2 presents estimating equations. Section 3 describes the sample and data. Section 4 presents our findings and section 5 discusses robustness tests. Section 6 summarizes and concludes the study. 2. Empirical Approach
2.1 Determinants of the Split between Executive and Non-Executive Option Grants
Existing literature is not clear as to which variables to include to explain the proportion of options granted to executives because most prior research focuses on either the overall level of executive grants or of firm-wide grants, but not their relative proportions. The estimating equation we use is based on that used in Core and Guay (2001) to estimate the determinants of non-executive incentive grants, equation (2) in their study. Our estimating equation differs from theirs because we have a different focus. In particular, Core and Guay (2001) investigates whether cash or financing constraints affect non-executive grants, while we are interested in the determinants of the relative proportion or “split” of option fair values granted to executives and non-executives, which should be less affected by the firm’s cash position. Because we later use the “split” regression fitted value to control for endogeneity in the operating income and market valuation regressions, we also include lagged operating income in the estimating equation. Finally, we include the Governance Index as a measure of corporate governance, GOV. The Governance Index is a combination of twenty-four shareholder protection characteristics. It seems particularly appropriate in this context because it captures the extent to which managers are shielded from shareholder oversight by, for example, permitting firms to delay hostile bidders; limiting shareholder voting rights; insuring officers and directors against termination and liability; and other takeover defenses. A firm with a high governance score is one for which
management is relatively shielded from shareholder oversight and therefore, for which management is more likely to have the ability to behave dictatorially.
The option split model is given by equation (1).
it it it it it it it it OI GOV BM RD SALES EMPL SPLIT ε α α α α α α α + + + + + + + = −1 6 5 4 3 2 1 0 ln( ) ln( ) (1) where SPLIT = ESO/[ESO+XSO]
ESO = Fair value of non-executive option grants, measured as fair value of total employee option grants, per SFAS No. 123 disclosure, less XSO
XSO = Fair value of top 5 executive option grants, per Execucomp ln(EMPL) = logarithm transformation of the number of employees
ln(SALES) = logarithm transformation of annual sales (Compustat item 12)
RD = Research and development expenses (Compustat item 46), deflated by sales. Following HRS, a value of zero is assigned when it is missing from Compustat BM = Book value of equity at year-end (Compustat item 60) divided by equity market
value at year-end (Compustat item 25*item 199)
GOV = Gomper’s et al. (2003) corporate governance Index. Higher values indicate lower shareholder rights7
OI = Operating Income before R&D expenses after SGA (Compustat item 13 + item 46), deflated by sales
We expect a positive coefficient for RD and a negative coefficient for BM because firms with more research and development and resulting intangible assets are likely to have more technical employees who have greater influence on share price. We make no predictions on the sign of the ln(EMPL) and ln(SALES) coefficients, but include those variables to control for firm differences relating to size as measured by sales and the number of employees. We predict the coefficient on GOV will be negative to the extent that firms with better corporate governance (lower values of GOV) are less likely to overcompensate their executives relative to
non-executive employees. We do not have a prediction for OI since it is not clear how profitability will affect the option split between executive and nonexecutive employees. We estimate equation (1) pooling available firm-year observations, using year and industry fixed effects.
2.2 Implications of Executive and Non-Executive Option Grants 2.2.1 Operating Income Equations
We base our operating income equations on those in Hanlon, et al. (2003, hereafter HRS), which predicts and finds evidence that granting options to executives results in higher future operating income.8 In contrast to HRS, our estimating equations include both ESO and XSO to
7 The Gomper’s et al. (2003) corporate governance Index is constructed from data prepared by the Investor
Responsibility Research Center (IRRC). Gomper’s et al. (2003) classified 24 governance factors in the IRRC database into five groups (tactics for delaying hostile takeover, voting rights, director/officer protection, other take- over defenses, and state laws), and create their Index by summing 24 binary governance factors.
8 An alternate approach to estimating the operating income equation (2) and the valuation equation (3) below is to
base the analysis on “excess” options from a first stage regression of options on economic determinants under the assumption that options affect profitability and valuation only when they deviate from optimal levels (Ittner et al., 2003). We apply our approach to measuring the effect of options for consistency with Bell et al (2002) and the primary tests of Hanlon et al (2003).
determine the marginal effects of each on future profitability.9 it t t s is t t s is it t i TA XSO ESO OI, =α0 +α1 −1 +α2∑ =−2 +α3∑ =−2 +ε (2) Our specification differs from that in HRS in two ways. First, whereas HRS includes current
and lagged values of executive grants for the prior five years, we include only data for executive and non-executive grants for the current and prior two years because the employee stock option data disclosed under Statement of Financial Accounting Standards No. 123: Accounting for Stock-Based Compensation (FASB 1995, hereafter, SFAS No. 123) only extend back to 1996 and including five year lagged data would severely limit our sample. Second, HRS includes separate regressors for each of the current and prior five year executive grants, permitting each to have its own coefficient, while we sum our executive and non-executive grant fair values, effectively constraining each lagged amount to have the same coefficient. This research design choice reflects a tradeoff between the cost of unstable coefficients in the year-to-year option grant fair values arising from their high collinearity (see HRS, table 2) and the cost of imposing the same coefficient on each of the lagged option grant fair values.10 Conceptually, one can view
and as proxies for the likely value of outstanding options since options are typically held for multiple years before exercise.
∑ XSO ∑ ESO
We compare the relative implications of options to executive and non-executive employees by testing the null α2 =α3 in equation (2) using an F-test. Following HRS, equation (2) includes beginning total assets (Compustat item 6) as a control for size differences, and each of the variables in the estimating equations is deflated by sales, SALES (Compustat item 12), corresponding to year the variable is measured. In particular, each of the lagged XSO and ESO amounts in year t is deflated by SALES in year t. As with equation (1), we estimate equation (2) pooling available firm-year observations using year and industry fixed effects. 2.2.2 Valuation Equations
Our market valuation equation is based on that employed by Bell, et al. (2002, hereafter BLMY), in which equity market value is regressed on residual income, equity book value, option expense per SFAS No. 123, and a book value measure of an intangible asset arising from current and past option grants. Our valuation regressions include equity book value, residual income,
and . As with the operating income equation, we estimate models including both and to simultaneously determine the marginal relation between
and and current equity market value. The equity valuation model is given by equation (3): ∑ XSO ∑ ∑ ∑ ESO ∑ XSO ESO ESO ∑ XSO it t t s is t t s is it it
it BVE RI XSO ESO
MVE =α0 +α1 +α2 +α3∑=−2 +α4∑ =−2 +ε (3)
Following prior research (Barth, Beaver, Hand, and Landsman, 1999; Dechow, Hutton, and Sloan, 1999; Bell et al., 2002), we measure residual income as net income (Compustat item 18) less twelve percent of lagged equity book value.
The current study differs from BLMY in several ways. First, our estimating equations include the fair value of options granted in the current and prior two years, rather than option expense and the intangible asset. In principle, the two approaches are similar in that the sum of
9 In interpreting our results, it is important to note that there is no overlap in options between XSO and ESO (i.e.,
options included in XSO are not also included in ESO), so the coefficient on XSO is not incremental to the coefficient on ESO. Note that for ease of exposition, we use the same notation for coefficients and error terms in equations (1) and (2), as well as equation (3) below.
10 As discussed below, findings are robust to estimating separate coefficients on lagged option grant fair values and
basing inferences on XSO and ESO coefficient sums.
the prior year executive and non-executive option fair values likely is highly correlated with the intangible asset measure in BLMY. An advantage of the current research design is that no accounting method is imposed when constructing the employee stock option variables. As with the operating income equation (2), we compare the relative valuation effect of granting options to executive and non-executive employees by testing the null α3=α4 in equation (3) using an F-test. Second, whereas BLMY are interested in examining the valuation properties of option fair value disclosures within the context of the Ohlson (1995) model, we do not assume the Ohlson model necessarily holds. Our interest is in whether options are associated with incremental valuation after taking into account book value of equity and residual income. We expect that, if outstanding options increase expected cash flows, there should be positive coefficients on and , and the relative magnitudes of the two coefficients provides insight on differences in the expected cash flow implications of the two classes of options. As with equations (1) and (2), we estimate equation (3) pooling available firm-year observations using year and industry fixed effects, and deflating all variables by sales.
∑ XSO ∑ ESO
2.3 Impact of Corporate Governance on Income and Valuation Equations
To examine the effect of governance on profitability and valuation, we split our sample using, GOV, based on the Governance Index, because the likelihood of excess executive
compensation may be greater and potential pathological effects of options more pronounced with worse corporate governance, other things equal. As a consequence, the relation between
executive options and income and valuation may vary based on governance environment. We predict that better corporate governance will be associated with a higher XSO coefficient relative to the ESO coefficient for both the operating income and market valuation equations. To test this proposition, we estimate equations (2) and (3) separately for subsamples of “high” and “low” governance firms based on the median value of GOV, which is 10. As with the pooled sample, we then compare the relative valuation effect of granting options to executive and non-executive employees separately for high and low GOV observations by testing the null
3
2 α
α = in equations (2) and α3 =α4 in equation (3) and by testing the relative magnitude of
2
α and α3 between the high and low GOV partitions.11 2.4 Two-Stage Least Squares Estimation
As noted by Larcker (2003) in his discussion of HRS, that study’s operating income regressions likely suffer from endogeneity bias arising from the fact that profitability affects option granting behavior. This concern may also apply equally to valuation regressions. To address this problem, we estimate a two-stage least squares procedure, using predicted values of SPLIT from a version of equation (1) to construct instruments for and which are then used when estimating equations (2) and (3).
∑ XSO ∑ ESO
The procedure works as follows.12 First, we estimate equation (1), excluding GOV as
an explanatory variable. We exclude GOV because we do not want the instruments we construct to reflect the effects of corporate governance, to avoid “throwing away the baby with the bath water” when we test for operating income and valuation coefficient differences based on
11 We test whether the and coefficient magnitudes differ for high and low Governance Index
observations by estimating pooled regressions including an indicator variable for high/low Governance Index values and interaction variables and .
∑ ESO ∑ × G ∑ XSO × G ESO ∑ XSO
12 Our two-stage least squares approach is a variant of the two-stage procedure described in Kmenta (1971), in
which predetermined variables in a system of equations are used to construct instruments for the endogenous variables, which in our case are SPLIT, ESO, and XSO.
governance.13 Second, we construct “predicted” instruments for and , XSOP and ESOP, based on the following formulas:
∑ XSO ∑ ESO
) (
2
,t ts t is is is
i SPLIT ESO XSO
ESOP =∑ =− × + (4.1) )] ( ) 1 ( 2 , is is is t t s t
i SPLIT ESO XSO
XSOP =
∑
=− − × + (4.2)where SPLIT is the fitted value from equation (1) with GOV omitted from the model. Third, it
we re-estimate equations (2) and (3) using XSOP and ESOP in place of and . We also re-estimate equations (2) and (3) for subsamples of high and low governance firms as described in section 2.3 using XSOP and ESOP. XSOP and ESOP have the desired property of being constructed from exogenous variables to ensure each is uncorrelated with the error term in the operating income and valuation equations. While this type of simultaneous estimation has the potential advantage of controlling for endogeneity, it implicitly assumes that the instruments and total option grants are exogenously determined.
∑ XSO ∑ ESO
14 To the extent that the first stage SPLIT
regression is of low power, this procedure will tend to bias against finding significant coefficients for XSOP and ESOP in the operating income and valuation regressions. 3. Sample and Data
The sample comprises 1,170 firm-year observations drawn from the S&P 500 Industrial Index.15 The sample period includes fiscal years 1996-2001, but the sample observations are from 1998-2001 because we require three years of option data. We begin with 1996 because that is the first year for which SFAS No. 123 data are available. The potential sample for use in our cross-sectional regression is 2,000 observations. We require firms to have earnings, equity market value, (non-negative) equity book value, estimates of fair value of employee stock option grants disclosed under SFAS 123, fair value of executive stock option grants, and a Governance Index score. Earnings, equity book value and equity market value data are drawn from the Compustat database. The fair value of employee stock option grants per the SFAS No. 123 disclosures are from a database provided to us byJack Ciesielski of R.G. Associates, Inc. We obtain the fair value of executive stock option grants from the Execucomp database,16 and the Governance Index data from Andrew Metrick’s website,
http://finance.wharton.upenn.edu/~metrick/data.htm.17
13 As discussed later, our conclusions are not sensitive to the exclusion of GOV in the estimation.
14 We also assume that with respect to the split decision, the determinants of SPLIT in equation (1) are fixed. In
principle, employees, sales, research and development expenditures, and governance are jointly determined along with the decision of relative option grants to higher and lower level employees. Nonetheless, untabulated findings for the operating earnings and valuation equations based on alternative SPLIT instruments result in similar
inferences to those based on findings reported in panel B of tables 3 through 6.
15 We focus on the S&P 500 firms because we were able to obtain machine-readable data on the fair value of
employee stock option grants and because they are large and stable firms. Although Execucomp provides some data on the number of securities underlying equity grants to executives relative to other employees, the data are frequently missing and it is important to measure accurately the total fair value of options granted to conduct our empirical analysis.
16 The Execucomp database provides stock option grant information for only the top 5 executives. Thus, it is not
possible to distinguish which option grants below the top 5 executive relate to other executives and which relate to broad-based option plans.
17 Studies using the Governance Index include Bebchuk and Cohen (2005), Bowen Rajgopal, and Venkatachalam
(2004), Ashbaugh, Collins, and LaFond (2006), and Bergstresser, Desai and Rauh (2006), among others. Several of the studies use the Governance Index to represent a broad index of corporate governance even though it is an anti-takeover protection index (Brown and Caylor, 2006). See section 5 below for a discussion of robustness tests that use alternative governance measures based on subsets of the Governance Index.
To mitigate the effects of outliers, for each variable appearing in the estimating equations, we treat as missing any observations that are in the extreme top and bottom one percentile
(Kothari and Zimmerman, 1995; Collins, Maydew and Weiss, 1997; Fama and French, 1998; Barth, Beaver, Hand, and Landsman, 1999, 2005). Table 1, panel A, summarizes how we obtain the final sample of 1,170 firm-year observations used in the operating income and valuation regressions after imposing the various sampling requirements. The largest loss of observations, 766, results from summing option fair values over three years to obtain the key explanatory variables, ∑ XSO and ∑ ESO.18
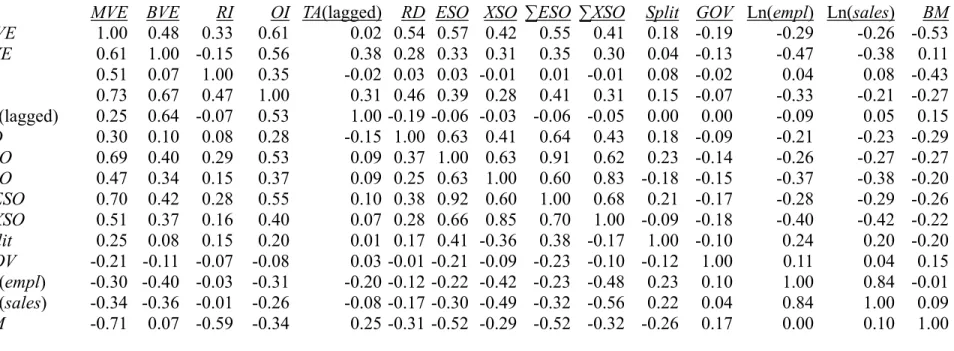
Table 1, panels B and C, present descriptive statistics and Spearman and Pearson correlations for the variables used in the study. Panel B indicates that approximately 20% of the total fair value of annual option grants are awarded to executives, with the remainder going to lower-level employees. In addition, the sum of average XSO and ESO is of the same order of magnitude as residual income, which averages approximately 2% of sales, comparable to levels found in HRS and BLMY. Panel C reports correlations among our variables. In particular, the Pearson correlation between and is 0.68 indicating that, while firms that grant more options to lower-level employees also tend to grant more options to executives, variation in lower-level options explains only about 46% of variation in executive options.
∑ XSO ∑ ESO
4. Results
4.1 Determinants of Split between Executive and Non-Executive Option Grants
Table 2 presents summary statistics from estimating equation (1), which regresses SPLIT (i.e., the ratio of the fair value of non-executive option grants to total option grants,
ESO/[ESO+XSO]) on our explanatory variables. The first two columns relate to specifications that include the Governance Index variable, GOV; the first (second) column excludes (includes) lagged operating income, OI. The third and fourth columns present analogous statistics but with GOV omitted. Predicted values of the dependent variable, SPLIT, from these latter two specifications are used in subsequent tests that address endogeneity of ESO and XSO in the operating income and valuation regression models.
4.2 Operating Income and Market Valuation Regressions
Table 3, panel A, presents results from estimating the operating income regression (equation (2)) using ordinary least squares. The findings in table 3, panel A, suggest that option grants predict higher future operating income. The coefficient on is 0.49, which is
significantly positive (t-statistic of 10.21). Interestingly, the coefficient point estimate on is 0.38, which is smaller than that for and is insignificant. This result suggests that, after controlling for non-executive options, there is no longer a significant relation between future operating income and executive option compensation.
∑ ESO
∑ XSO ∑ ESO
As noted earlier, an issue with the ordinary least squares specification is the possibility that the split between executive and non-executive options is endogenous, which results in
and not being fixed regressors in the operating income equation. To control for that possibility, we simultaneously estimate the operating income and split regressions. XSOP and ESOP, defined by equations (4.2) and (4.1), are instruments for and created using predicted values from the SPLIT regression. The first stage SPLIT regression results are
∑ ESO ∑ XSO
∑ XSO ∑ ESO
18 Note that the split regression include observations for 1996 through 2001 while the operating income and
valuation regressions include observations only from 1998 to 2001 because the operating income and valuation regressions require value for and , which are constructed using three years of data. This accounts for the loss of the 766 observations that relate to years 1996 and 1997.
∑ XSO ∑ ESO
tabulated as columns three and four of table 2. To assess the potential importance of endogeneity, we first apply the Hausman (1978, 1983) test. Untabulated results suggest significant endogeneity with respect to operating income, but not the market value of equity. For consistency, we report results for both operating income and market value both with and without endogeneity controls.
Results from the second stage operating income regressions that control for endogeneity are presented in table 3, panel B. We present results from two different instruments, one of which is based on the SPLIT regression that excludes lagged operating income, SPLIT1, and another which includes lagged operating income, SPLIT2. The two-stage least squares results are generally consistent with those for ordinary least squares. The controls for endogeneity
strengthen the positive relation between lower-level options and future operating profit, with the coefficient estimate increasing to 0.62 (t-statistic of 6.51) for the specification without operating income in the first stage and 0.85 (t-statistic of 11.62) for the specification including operating income in the first stage. More interesting, the relation between executive options and future operating profit becomes even weaker after controlling for endogeneity. In both specifications, the coefficient point estimate for executive options is negative after controlling for endogeneity, significantly so for the specification in which the endogeneity control includes operating income. As noted earlier, our primary interest is in the level of the coefficient on executive options
relative to non-executive options since omitted variables could affect the overall level of our coefficient estimates. After controlling for endogeneity, the coefficient on executive options is below that on non-executive options, although only significantly so for the specification
including operating income (F-statistic of 31.36).
Results from the market value of equity regression using ordinary least squares, reported in table 4, panel A, tell a similar story to the operating income results. As with operating income, the relation between non-executive options and market value is significantly positive (coefficient estimate of 8.22 and t-statistic of 10.46), suggesting that non-executive options are valued as assets by the market. However, as with operating income, the coefficient on executive options is insignificant (coefficient estimate of 6.81 and t-statistic of 1.78), suggesting that, after
controlling for non-executive options, there is no remaining significant relation between executive options and market value.
Table 4, panel B, reports results for the two-stage least squares market value regression. As with the results for operating income, the control for endogeneity makes the difference between executive and non-executive options even more stark. Including our controls for endogeneity, the relation between non-executive options and market value is even stronger, with the coefficient estimate increasing to 13.28 (t-statistic of 8.88) and 12.79 (t-statistic of 10.31) for the specifications with and without operating income. As with the operating income results, after controlling for endogeneity, the executive options have a reliably negative effect on valuation (t-statistics of −2.55 and −3.02, respectively, in the specifications with and without controls for operating income), suggesting that after controlling for the effects of non-executive options and endogeneity, executive options may actually reduce value. More importantly, the difference in valuation effect between the executive and non-executive options is statistically significant (F statistics of 14.26 and 19.61, respectively, for the specifications with and without controls for operating income).19
5. Summary and Conclusions
19 Untabulated findings from regressions without fixed effects result in similar inferences to those associated with
findings reported in tables 3 and 4.
We examine the determinants of the split between option grants to executive and
non-executive employees and the relation between executive and non-executive options and firm performance and valuation. We first examine the split between executive and non-executive options and document that the depth to which options are granted in the organization is a function of governance in the organization. In particular, proportionally more options tend to be granted to executives when governance is weak. Our measure of governance here is based on the Governance Index of shareholder rights. The results suggest that the proportion of options granted to executives tends to higher when managers are more insulated from
shareholder pressure through mechanisms such as takeover defenses and other measures that make it more difficult for shareholders to monitor management.
We then evaluate the implications of executive and non-executive options for firm
performance and valuation. We find that, while both executive and non-executive options tend to be associated with better performance and higher market value, if anything, the relation seems stronger for non-executive options than executive options. While that seems surprising on its face, we argue that, if options are inefficiently granted to executives because of governance issues as argued in Bebchuk and Fried (2004), executive options may do less to enhance firm value and may, in the extreme, reduce firm performance and firm value.
To investigate that possibility, we split the sample between good and poor governance based on the Gompers et al. (2003) measure. Our results suggest that, from both a performance and market value perspective, executive options contribute less (and may even destroy value) in cases of poor governance.
Our results highlight the importance of differentiating between type of option in research on firm performance and valuation and, further, differentiating between good and poor governance. Results are particularly interesting because governance appears to have relatively little effect on the performance and valuation implications of lower-level options, suggesting that governance matters to the efficacy of executive options but not to lower level options. That difference is not surprising since lower-level employees have less control over the activities of the firm.
Of course, our results are sensitive to caveats. Assessing causality in this type of setting is notoriously difficult since compensation design is, by its very nature, endogenous. We have attempted to consider the endogeneity issue by evaluating determinants of the stock option split and by estimating our equations simultaneously.
References
Aboody, D., M. E. Barth, and R. Kasznik. 2004. “SFAS 123 Stock-Based Compensation Expense and Equity Market Values.” The Accounting Review 79, 251-276.
Ashbaugh, H. , D. Collins, and R. LaFond (2006). “The Effects of Corporate Governance on Firms’ Credit Ratings.” Journal of Accounting and Economics 42, 203-243.
Barth, M.E., W.H. Beaver, J.M. Hand, and W.R. Landsman (1999). “Accruals, Cash Flows, and Equity Values.” Review of Accounting Studies 4, 205-229.
Barth, M.E., W.H. Beaver, J.M. Hand, and W.R. Landsman (2005). “Accruals, Accounting-Based Valuation Models, and the Prediction of Equity Values.” Journal of Accounting, Auditing, and Finance 20, 311-345.
Bebchuk, L., and A. Cohen (2005). “The Cost of Entrenched Boards.” Journal of Financial Economics 78, 409–433.
Bebchuk, L. and J. Fried (2004). “Pay Without Performance: The Unfulfilled Promise of Executive Compensation,” Harvard University Press, Cambridge, Massachusetts. Bell, T.B., W.R. Landsman, B.L. Miller, and S. Yeh, (2002). “The Valuation Implications of
Employee Stock Option Accounting for Profitable Computer Software Firms.” The Accounting Review 77, 971-996.
Bergstresser, D., Desai, and Rauh (2006). “Earnings Manipulation, Pension Assumptions, and Managerial Investment Decisions.” Quarterly Journal of Economics 121, 157-195.
Bergstresser, D. and T. Philippon, (2006). "CEO Incentives and Earnings Management,” Journal of Financial Economics 80, 511-529.
Bowen, R., Rajgopal, and Venkatachalam. (2004). “Accounting Discretion, Corporate Governance, and Firm Performance.” Working Paper, University of Washington.
Brown, L.D, and M.L. Caylor (2006). “Corporate Governance and Firm Valuation.” Journal of Accounting and Public Policy 25, 409–434
Callaghan, S.R., M. Stanford, and C. Subramaniam (2006). “Do Broad-Based Option
Compensation Plans Improve Future Firm Performance for Technology and Non-Technology Firms?” Working paper, Texas Christian University.
Carter, Mary Ellen, and Luann J. Lynch. (2003). “The Consequences of the FASB’s 1998 Proposal on Accounting for Stock Option Repricing.” Journal of Accounting & Economics, 35:51-72.
Collins, D.W., Maydew, E.L., and I.S. Weiss. (1997). “Changes in the Value-Relevance of Earnings & Equity Book Values Over The Past Forty Years.” Journal of Accounting and Economics 24, 39-67.
Core, J. and W. Guay (2001). “Stock option plans for non-executive employees.” Journal of Financial Economics 61, 253–287.
Core, J., W. Guay, and T. Rusticus (2006). “Does Weak Governance Cause Weak Stock Returns? An Examination of Firm Operating Performance and Investors’ Expectations.” Journal of Finance 61, 655-687..
Core, J., W. Guay and R. Thomas (2005). “Is U.S. CEO Compensation Inefficient Pay without Performance?” Michigan Law Review 103, 1142-1185.
Core, J., R. Holthausen, and D. Larcker (1999). “Corporate Governance, Chief Executive Officer Compensation, and Firm Performance.” Journal of Financial Economics 51, 371-406.
Cremers, K.J.M., V.B. Nair (2005). “Governance Mechanisms and Equity Prices.” Journal of Finance 60, 2859–2894.
14
Dechow, P.M., A.P. Hutton, and R.G. Sloan (1999). “An Empirical Assessment of the Residual Income Valuation Model.” Journal of Accounting and Economics 26, 1-34.
Erickson, M., M. Hanlon and E. Maydew (2006). “Is There a Link Between Executive Compensation and Accounting Fraud?” Journal of Accounting Research 44, 113-143. Fama, E.F., and K.R. French. (1998). “Taxes, Financing Decisions, and Firm Value.” Journal of
Finance 53, 819-843.
Financial Accounting Standards Board (1995). Statement of Financial Accounting Standards No. 123: Accounting for Stock-Based Compensation. FASB, Norwalk, CT.
Gompers, P.A., J.L. Ishii, and A. Metrick (2003), “Corporate Governance and Equity Prices,” The Quarterly Journal of Economics 118, 107–155.
Hall, Brian, and Kevin J. Murphy. 2002. “Stock Options for Undiversified Executives.” Journal of Accounting & Economics 33: 3-42.
Hall, Brian J., and Kevin J. Murphy. 2003. “The Trouble with Stock Options.” Journal of Economic Perspectives, vol. 17, no. 3: 49-72.
Hanlon, M., S. Rajgopal, and T. Shevlin (2003). “Are Executive Stock Options Associated with Future Earnings?” Journal of Accounting and Economics 36, 3-43.
Hausman, J. (1978). “Specification Tests in Econometrics.” Econometrica 46, 1251 1271. Hausman, J. (1983). “Specification and Estimation of Simultaneous Equations Models,” in: Z.
Griliches and M. Intriligator, eds., Handbook of econometrics (North-Holland, Amsterdam). Inderst, R. and H. Müller (2004). “Benefits of Broad-Based Option Pay.” Working Paper,
London School of Economics and New York University.
Ittner, C., R. Lambert and D. Larcker (2003). “The Structure and Performance Consequences of Equity Grants to Employees of New Economy Firms, Journal of Accounting and Economics 34, 89-127.
Kmenta, J. (1971). Elements of Econometrics. Macmillan Publishing Company, New York. Kothari, S.P., and J. Zimmerman. (1995). “Price and Return Models.” Journal of Accounting and
Economics 20, 155-192.
Larcker, D. (2003). “Discussion of ‘Are Executive Stock Options Associated with Future Earnings?’” Journal of Accounting and Economics 36, 45-50.
Meulbroek, L.K. 2001. “The Efficiency of Equity-Linked Compensation: Understanding the Full Cost of Awarding Executive Stock Options.” Financial Management 30: 5–30.
Ohlson, J.A. (1995). “Earnings, Equity Book Values, and Dividends in Equity Valuation.” Contemporary Accounting Research, 661-687.
Oyer, P., 2004, “Why Do Firms Use Incentives That Have No Incentive Effects.” Journal of Finance, 1619-1650.
Oyer, P. and S. Schaefer, 2005, “Why Do Some Firms Give Stock Options to All Employees?: An Empirical Examination of Alternative Theories.” Journal of Financial Economics 76, 99–133.. Rajgopal, Shivaram, and Terry Shevlin. 2002. “Empirical Evidence on the Relation Between
Stock Option Compensation and Risk Taking.” Journal of Accounting & Economics, 33:145-171.
TABLE 1
Descriptive Statistics for a Sample of S&P 500 Industrial Index Firms, with
1,170 Firm-Year Observations, 1998-2001
Panel A: Summary statistics of sampling process
Number of
firm years Firms in S&P 500 Industrial Index for years 1996 -2001 3,000 Less: Firm years with missing SFAS 123 disclosure from
J. Ciesielski of R.G. Associates, Inc. Database (402) Less: Firm years with missing XSO data from Execucomp (45) Less: Firm years with missing Governance Index data: (213) Less: Firm years with various financial statement data missing (147) Less: Top and bottom 1% trimming for all variables with available data (260) Less: Firm years lost in summing option fair values over three year period (766)
Total Sample firms for year 1998 - 2001 1,170
Panel B: Distributional statistics*
Variable Mean 25th % Median 75th % Standard Deviation MVE 2.56 0.85 1.70 3.17 2.69 BVE 0.56 0.29 0.46 0.74 0.38 RI 0.02 0.00 0.02 0.06 0.08 OI 0.25 0.15 0.22 0.33 0.14 TA(lagged) 1.97 0.73 1.07 1.67 2.53 RD 0.03 0.00 0.00 0.04 0.06 ESO (in %) 1.99 0.27 0.67 1.61 4.02 XSO (in %) 0.34 0.05 0.12 0.31 0.69 ∑ESO (in %) 5.23 0.84 1.94 4.33 9.86 ∑XSO (in %) 0.96 0.16 0.36 0.95 1.78 Split 0.79 0.73 0.84 0.92 0.17 GOV 9.78 8.00 10.00 12.00 2.53 Ln(empl) 3.05 2.22 3.11 3.90 1.17 Ln(sales) 8.61 7.81 8.59 9.36 1.07 BM 0.34 0.16 0.30 0.47 0.22 15
Table 1 continued
Panel C: Correlation coefficients, with Pearson (Spearman) correlations above (below) the diagonal
MVE BVE RI OI TA(lagged) RD ESO XSO ∑ESO ∑XSO Split GOV Ln(empl) Ln(sales) BM
MVE 1.00 0.48 0.33 0.61 0.02 0.54 0.57 0.42 0.55 0.41 0.18 -0.19 -0.29 -0.26 -0.53 BVE 0.61 1.00 -0.15 0.56 0.38 0.28 0.33 0.31 0.35 0.30 0.04 -0.13 -0.47 -0.38 0.11 RI 0.51 0.07 1.00 0.35 -0.02 0.03 0.03 -0.01 0.01 -0.01 0.08 -0.02 0.04 0.08 -0.43 OI 0.73 0.67 0.47 1.00 0.31 0.46 0.39 0.28 0.41 0.31 0.15 -0.07 -0.33 -0.21 -0.27 TA(lagged) 0.25 0.64 -0.07 0.53 1.00 -0.19 -0.06 -0.03 -0.06 -0.05 0.00 0.00 -0.09 0.05 0.15 RD 0.30 0.10 0.08 0.28 -0.15 1.00 0.63 0.41 0.64 0.43 0.18 -0.09 -0.21 -0.23 -0.29 ESO 0.69 0.40 0.29 0.53 0.09 0.37 1.00 0.63 0.91 0.62 0.23 -0.14 -0.26 -0.27 -0.27 XSO 0.47 0.34 0.15 0.37 0.09 0.25 0.63 1.00 0.60 0.83 -0.18 -0.15 -0.37 -0.38 -0.20 ∑ESO 0.70 0.42 0.28 0.55 0.10 0.38 0.92 0.60 1.00 0.68 0.21 -0.17 -0.28 -0.29 -0.26 ∑XSO 0.51 0.37 0.16 0.40 0.07 0.28 0.66 0.85 0.70 1.00 -0.09 -0.18 -0.40 -0.42 -0.22 Split 0.25 0.08 0.15 0.20 0.01 0.17 0.41 -0.36 0.38 -0.17 1.00 -0.10 0.24 0.20 -0.20 GOV -0.21 -0.11 -0.07 -0.08 0.03 -0.01 -0.21 -0.09 -0.23 -0.10 -0.12 1.00 0.11 0.04 0.15 Ln(empl) -0.30 -0.40 -0.03 -0.31 -0.20 -0.12 -0.22 -0.42 -0.23 -0.48 0.23 0.10 1.00 0.84 -0.01 Ln(sales) -0.34 -0.36 -0.01 -0.26 -0.08 -0.17 -0.30 -0.49 -0.32 -0.56 0.22 0.04 0.84 1.00 0.09 BM -0.71 0.07 -0.59 -0.34 0.25 -0.31 -0.52 -0.29 -0.52 -0.32 -0.26 0.17 0.00 0.10 1.00 *Variable definitions
MVE = Market value of common equity at year end, measured as Compustat item 25 * item 199, deflated by sales (Compustat item 12).
BVE = Book value of common equity at year end, measured as Compustat item 60, deflated by sales (Compustat item 12).
RI = Residual income, measured as net income (Compustat item 18) less 0.12 times BVE (lagged), deflated by sales (Compustat item 12).
17
Table 1 continued (*Variable definitions)
OI = Operating Income before R&D expenses after SGA, measured as Compustat item 13 + item 46, deflated by sales (Compustat item 12).
TA = Total Asset, measured as Compustat item 6, deflated by sales (Compustat item 12).
RD = RD expenses, measured as Compustat item 46, deflated by sales (Compustat item 12). Following HRS, a value of zero is assigned when it is missing from Compustat. ESO = Fair value of non-executive option grants, measured as fair value of total employee option grants, per executive option grants XSO, deflated by sales (Compustat item 12). SFAS No. 123 disclosure, less top 5 XSO = Fair value of top 5 executive option grants, per Execucomp, deflated by sales (Compustat item 12).
∑ESO = Sum of current and prior two years' ESOs . ∑XSO = Sum of current and prior two years' XSOs .
GOV = Gomper’s et al. (2003) Governance Index of corporate governance, which is a construct that captures 24 components of shareholder rights. Higher values indicate lower shareholder rights.
Split = The ratio of non-executive options to total options, measured as (ESO)/(XSO+ESO).
Ln(empl) = Logarithm transformation of the number of employees.
Ln(sales) = Logarithm transformation of annual sales, measured as Compustat item 12.
Table 2
Regressions of the Ratio of the Fair Value of Non-executive Option
Grants to Total Option Grants on Its Determinants*
ln( ) ln( )
0 1 2 3 4
5 6 1
it it it it it
it it it
SPLIT EMPL SALES RD BM
GOV OI α α α α α α α − ε = + + + + + + +
Dependent variable = Split
ln(empl)i,t 0.02 0.03 0.02 0.03 t-stat 3.02 3.86 2.50 3.31 ln(sales)i,t 0.02 0.02 0.02 0.02 t-stat 2.82 2.62 3.10 2.92 (RD)i,t 0.34 0.02 0.35 0.03 t-stat 3.27 0.16 3.30 0.24 (BM)i,t -0.10 -0.06 -0.11 -0.07 t-stat -4.92 -2.96 -5.29 -3.34 (Gov)i,t -0.01 -0.01 t-stat -3.82 -3.97 (OI)i,t-1 0.28 0.28 t-stat 7.48 7.35 No. of Obs. 1,936 1,916 1,936 1,916 Adj. R2 0.116 0.140 0.110 0.133
* See Table 1 for the definitions of all variables.
All regressions are estimated with year and industry fixed effects (coefficients and t-statistics are not tabulated).
Table 3
Regressions of Operating Income with Fair Values of Option Grants Included as Regressors,
1998-2001*
Panel A: Summary statistics from regression of operating income on lagged total asset and fair values of option grants
, 1 0 1 2 2 3 2
t t
i t it s t is s t is it
OI + =α α+ TA +α
∑
= − XSO +α∑
= − ESO +εTA ∑XSO ∑ESO α2 =α3
Equation No. of Obs. Coefficient t-stat. Coefficient t-stat. Coefficient t-stat. F-stat. Adj. R2
(2) 1,170 0.02 10.21 0.38 1.58 0.49 10.21 0.17 0.437 Panel B: Summary statistics from regression of operating income on lagged total asset and predicted values of fair values of option grants
, 0 1 1 2 3 i t it it it it OI =α α+ TA − +α XSOP +α ESOP +ε TA XSOP ESOP α2=α3 Prediction 19
No. of Obs. Coefficient t-stat. Coefficient t-stat. Coefficient t-stat. F-stat. Adj. R2
Split 1** 1,170 0.02 10.27 -0.16 -0.38 0.62 6.51 2.38 0.438
Split 2** 1,137 0.01 9.37 -1.39 -4.15 0.85 11.62 31.36 0.473
* See Table 1 for the definitions of all variables, except for predicted values for ∑XSO and ∑ESO, XSOP and ESOP.
, 2(1 ) ( )]
t
i t s t is is is
XSOP =∑= − −SPLIT × ESO +XSO and
, 2
i t s t= − is ( is is) t
ESOP =∑ SPLIT × ESO +XSO . SPLITis is the fitted value from option split regression reported in Table 2.
All regressions are estimated with year and industry fixed effects (coefficients and t-statistics are not tabulated).
** In the first stage Split regressions, Split 1 includes Ln(empl), Ln(sales), RD, and BM, as independent variables, and Split 2 includes lagged OI, Ln(empl), Ln(sales), RD, and BM, as independent variables.
Table 4
Regressions of Equity Market Value, with Fair Values of Option Grants Included as Regressors,
1998-2001*
Panel A: Summary statistics from regression of market value of equity on equity book value, abnormal earnings, and fair values of option grants
0 1 2 3 2 4 2
t t
it it it s t is s t is it
MVE =α α+ BVE +α RI +α
∑
= − XSO +α∑
= − ESO +εBVE RI ∑XSO ∑ESO α3=α4
Equation No. of Obs. Coefficient t-stat. Coefficient t-stat. Coefficient t-stat. Coefficient t-stat. F-stat. Adj. R2
(3) 1,170 2.93 18.11 12.04 16.93 6.81 1.78 8.22 10.46 0.11 0.598
Panel B: Summary statistics from regression of market value of equity on equity book value, abnormal earnings, and predicted values of fair values of option grants
0 1 2 3 4
it it it it it it
MVE =α α+ BVE +α RI +α XSOP +α ESOP +ε
BVE RI XSOP ESOP α3=α4
Prediction No. of Obs. Coefficient t-stat. Coefficient t-stat. Coefficient t-stat. Coefficient t-stat. F-stat. Adj. R2
Split 1** 1,170 3.00 18.56 11.90 16.81 -17.00 -2.55 13.28 8.88 14.26 0.603
Split 2** 1,137 2.97 18.07 11.92 16.40 -17.23 -3.02 12.79 10.31 19.61 0.601
* See Table 1 for the definitions of all variables, except for predicted values for ∑XSO and ∑ESO, XSOP and ESOP.
, 2(1 ) ( )]
t
i t s t is is is
XSOP =∑= − −SPLIT × ESO +XSO and
, 2
i t s t= − is ( is is) t
ESOP =∑ SPLIT × ESO +XSO . SPLITis is the fitted value from option split regression reported in Table 2.
All regressions are estimated with year and industry fixed effects (coefficients and t-statistics are not tabulated).
** In the first stage Split regressions, Split 1 includes Ln(empl), Ln(sales), RD, and BM, as independent variables, and Split 2 includes lagged OI, Ln(empl), Ln(sales), RD, and BM, as independent variables.
1
出席國際學術會議心得報告
計畫編號 NSC 95-2416-H-002-027 計畫名稱 員工認股權分配與企業績效及企業價值關連性之研究 出國人員姓名 服務機關及職稱 葉疏副教授,國立台灣大學會計學系 會議時間地點 September 15 &16, 2006New York University Stern School of Business 44 West Fourth Street, New York, NY 10012
會議名稱 The 2006 Journal of Accounting, Auditing and Finance/KPMG Foundation Conference
發表論文題目 Governance and the Split of Options between
Executive and Non-executive Employees
一、參加會議經過
本人於 2006 年 9 月 14 日自桃園國際機場出發,美國時間當日到達紐約。該會議於 9/15 及 9/16 兩天舉行,共有八篇學術論文依序進行討論。第一天討論的文章包括本文, 以及Conservatism, Growth, and Return on Investment; Audit Committee Financial Literacy: A Work in Progress; Did Earnings Conservatism Increase For Former
Andersen Clients?; An Empirical Analysis of CEO Risk Aversion and the Propensity to Smooth Earnings。第二天討論的文章則有 Earnings Momentum and Earnings
Management; Organizational structure and Earnings Management; Regulation Fair
Disclosure and Analysts’ First-Forecast Horizon。每篇文章討論時間有 75 分鐘,由於討
論時間相當充裕,與會者皆能充分地參與討論,提出問題及建議。 二、與會心得 本次研討會的主軸在探討審計、保守穩健、盈餘管理、員工認股選擇權之效用 等現象,對於資本市場之影響。研討會接受之文章,共有八篇。吾人在參與全程 之討論後,除對於該類研究議題更加瞭解,亦對於一流學術文章如何選定研究議 題和動機有了更深的體認。本次研討會的參與研討會之知名學者,除本篇之共同作者
Wayne Landsman外,尚包括Douglas J. Skinner, Larry Brown, Mark T. Soliman等國際 知名學者。吾人在會間與這些學者有所互動,除與其討論目前正在進行之研究外, 亦對於研討會中發表之文章可能之未來研究方向,有諸多討論。
此次與會之心得包括:
(1) 得以獲得先進學者之第一手經驗與看法。
2
(3) 得以管窺目前或潛在會計研究問題與機會。 (4) 自研討會發表的若干文章獲得研究靈感。