國立臺中教育大學教育測驗統計研究所碩士論文
National Taichung University of Education, Graduate Institute of
Educational Measurement and Statistics
Master’s Thesis
指導教授:郭伯臣 博士
Advisor: Dr. Bor-Chen Kuo
Gender and Location Difference in
Mathematics Achievement in Mongolia:
An Item Response Theory Approach
研究生:Otgonbaatar Khajidmaa 撰
Graduate: Otgonbaatar Khajidmaa
中
華
民
國
一
○
二
年
七
月
Abstract
The current study investigated whether males and females differed in math achievement based on an Item Response Theory Approach. This study also explored the difference in math achievement between students attending schools in rural areas and those enrolled in urban schools. 482 students (54.14% males and 45.86% females) were given a mathematical test which consists of 15 TIMSS math items and 15 Mongolian math items. Mean age of the participants was 14.01 (standard deviation=0.193) 324 of them are from urban schools and 158 from rural schools in Mongolia. The test items are grouped into five content categories such as arithmetic, statistics and probability, geometry, algebra, and proportionality. The test was administrated to the participants in paper-based format and lasted for 40 minutes. For the statistical analysis, t-test was used to decide the difference between variables. For the item analysis Three Parameter Logistic Model was used.
The study has found no significant gender difference in mathematics achievement among Mongolian 8th graders. However, it had small difference favoring boys. Interestingly, examining differences by content area reveals males scored higher on average than females in arithmetic, proportionality and statistics and probability with the exception of geometry and algebra in which female students scored higher.
The study has found there is significant difference in math achievement between students from rural and urban schools. The students from small rural schools performed worse than those attending large urban schools. The Mongolian items had higher item difficulty index versus TIMSS mathematics items for 8th grade. However, the hardest item was found among TIMSS items.
Acknowledgements
First of all, I would like to express my appreciation and gratitude towards my advisor Dr. Bor Chen Kuo who made this thesis possible, for his guidance during my research and study in National Taichung University. This thesis would not have been possible unless great support of you.
I would like to gratefully acknowledge the enthusiastic teachers in Graduate Institute of Educational Measurement and Statistics, Professor Hsui-Fei Wang, Prof Cheng Chen Yang, Prof Edward Tsai, and Professor Frank for their teaching and motivation.
I owe my deepest gratitude to Hsiao-Chien, Tseng for her great guidance, advice and assistance in the creation of my thesis.
I would like to show my gratitude to my sister Kh.Amarjargal and her colleagues for their great contribution to collect my data which is the most important part of my research.
All my lab friends at Computer-Based Test & Computational Intelligence Laboratory made it a convivial place to research and study in particular, Te-Hung Lee, Elaine Chen, Minn-Shyan Wang and others for their friendship. My classmates and other Taiwanese friends, specifically my dear Ching Hui-Lee and also Tiker John all of international students in this program Muslim Daud, Exkarach Deenang, Dang Thanh Binh, Phan Nguyet and KyongHo Kim. Thanks a bunch for solidarity and togetherness during study here.
I am indebted to International Cooperation Department of National Taichung University that support and help me, specifically Prof Eric Chu, Ms Chia-Feng Hsu, Ms Lai and others.
I dedicate my thesis to my parents Khajidmaa Yadamjav, Rentsendulam Bukh, also my younger sister Otgontsetseg Khajidmaa and my brothers and older sisters for their encouragement, understanding and endless patience.
Table of Contents
English Abstract………....…...I
Acknowledgements………...II
Table of Contents……….III
List of Figures………...…..….IV
List of Tables………...……...…...V
Explanation of Symbols……….….……VI
CHAPTER ONE INTRODUCTION………..…….1
1.1
Motivation………...……...1
1.2
Objectives………..…...…...2
1.3
Significance of the study………...………....2
1.4
Limitations of the study………..…….…....2
1.5
Organization of the study……….….….…...3
CHAPTER TWO LITERATURE REVIEW………..4
2.1.
Related studies………...…..…….4
2.2.
Overview of Item Response Theory………..6
2.3.
Item Response Theory models………..………...….…8
Rasch Simple Logistic Model………..…...9
The One-Parameter Logistic Model………...11
The Two-Parameter Logistic Model………...…...11
The Three-Parameter Logistic Model……….………..…12
The “a” parameter: Item Discrimination……….……….…...12
The “b” parameter: Item Difficulty………...13
The “c” parameter: Pseudo-guessing………..…13
2.5.
Overview of TIMSS………..……….13
2.6.
Mathematics Curriculum in 8
thGrade in Mongolia ………...….15
CHAPTER THREE METHODS AND MATERIALS……….…...20
3.1 Sample size……….…...20
3.2 Data Collection Procedures……….……….….20
3.3 Research Instruments………..……….……….….21
CHAPTER FOUR RESULTS………..………….……….………23
4.1 Item Analysis……….………..…24
4.2 Statistical Analysis……….……....26
CHAPTER FIVE DISCUSSION AND CONCLUSION………….………....30
REFERENCES………...………..33
List of Figures
1.
Figure 1. Score difference of urban and rural students by content area…….27
2.
Figure 2 Score difference of boys and girls by content area………..28
3.
Figure 3 Item Characteristics Curve 1……….………...39
4.
Figure 4. Item Characteristics Curve 2………..…...…..40
5.
Figure 5. Item Characteristics Curve 3………..…...…..41
6.
Figure 6. Item Characteristics Curve 4………..……...42
7.
Figure 7. Item Characteristics Curve 5………..…...…..43
8.
Figure 8. Item Characteristics Curve 6………..…...…..44
9.
Figure 9. Item Characteristics Curve 7……….…..45
10.
Figure 10. Item Characteristics Curve 8………...…..46
11.
Figure 11. Item Characteristics Curve 9………...47
12.
Figure12. Item Characteristics Curve 10………...48
13.
Figure 13. Item Characteristics Curve 11………..…...49
14.
Figure 14. Item Characteristics Curve 12………...……50
15.
Figure 15. Item Characteristics Curve 13………...……....51
16.
Figure 16. Item Characteristics Curve 14………...…..…..52
17.
Figure 17. Item Characteristics Curve 15………...…..…..53
18.
Figure 18. Item Characteristics Curve 16……….…..54
19.
Figure 19. Item Characteristics Curve 17………..…...…..55
20.
Figure 20. Item Characteristics Curve 18………..…...56
21.
Figure 21. Item Characteristics Curve 19……….…..57
22.
Figure 22. Item Characteristics Curve 20………..…...…..58
23.
Figure 23. Item Characteristics Curve 21………..……...59
24.
Figure 24. Item Characteristics Curve 22………..……...60
25.
Figure 25. Item Characteristics Curve 23……….…..61
26.
Figure 26. Item Characteristics Curve 24………..…...62
27.
Figure 27. Item Characteristics Curve 25………..…...63
29.
Figure 29. Item Characteristics Curve 27………..…...65
30.
Figure 30. Item Characteristics Curve 28………..…….66
31.
Figure 31. Item Characteristics Curve 29………..…...67
List of Tables
1.
Table 1. Mathematics content areas in Mongolian middle schools…………..16
2.
Table 2. Time Schedule for Data Collection………...………...20
3.
Table 3. Five content areas, and items and curriculum hours………...21
4.
Table 4: Average passing rate by content area………...24
5.
Table 5: Item Response Theory parameters………...25
6.
Table 6: Comparison of Item difficulty indices……….………...26
7.
Table 7: Mean of students ability and t-test in location……….…..26
8.
Table 8: Mean of students ability and t-test in gender………...28
9.
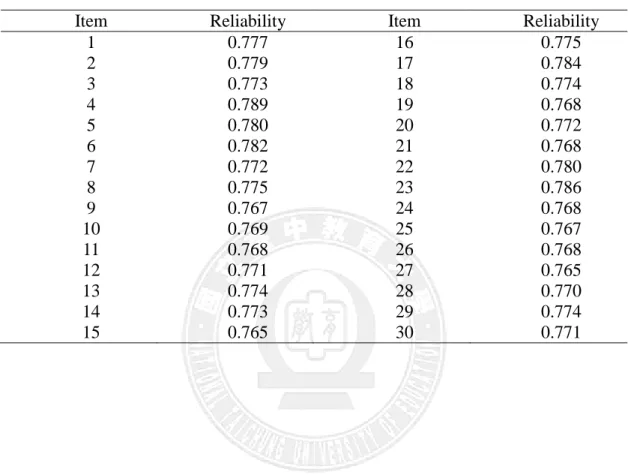
Table 9: Test reliability………..…...37
10.
Table 10: Each item’s reliability………..…...37
List of Abbreviations and Symbols
1.
TIMSS- Trends in International Mathematics and Science………..1
2.
PISA- Program for International Students Assessment………...1
3.
OECD- Organization for Economic Cooperation and Development……...1
4.
IRT – Item Response Theory………...…...6
5.
ICC- Item Characteristics Curve………...…....7
6.
θ- Ability………...………...…...9
7.
1PL – One Parameter Logistic Model………..…..11
8.
2PL- Two Parameter Logistic Model………...11
9.
3PL- Three Parameter Logistic Model………...12
10.
“a”- Item discrimination parameter………12
11.
“b”-Item difficulty parameter………...13
12.
“c”- Guessing parameter………...……..13
13.
IEA-International Association for the Evaluation of Educational
Achievement………....13
14.
PIRLS- Progress in International Reading Literacy Study………...13
15.
SD-Standard deviation………...……….26
16.
H
0-Null hypothesis………..26
17.
H
A-Alternative hypothesis………...………...26
18.
n-sample size………...………...26
CHAPTER ONE
INTRODUCTION
1.1 Motivation
Mathematics is an important life skill and part of the school curriculum, there is growing pressure on educators to find effective ways to teach well to all students, male, female in all level of education. Therefore for the past 20 years, TIMSS (Trends in International Mathematics and Science Study) has measured in mathematics and science at the fourth and eighth grades (13-14) and PISA (Program for International Student Assessment) conducted by the OECD has measured 15-year old students’ mathematics skill besides reading and science literacy since 2000. Trends in International Mathematics and Science Study (TIMSS) and, The Program for International Student Assessment (PISA) and, NAEP (National Assessment of Educational Progress) over the past ten years reveal that on average girls underperform (outperform) boys in math competencies in number of countries that take part in the evaluation program. Unlike these studies, other authors find no significant differences in overall math aptitudes between boys and girls.
Over last three decades, the gender gap in mathematics has been an important and extremely divisive of academic debate (e.g Sweeney 1953, Fennema and Sherman 1977, Goldin 1994, Hausmann et.al 2008) and number of researchers have paid attention to the gender difference in mathematics achievement as indicators of gender inequalities at early stages of life.
Because it is noted that understanding these early differences between boys and girls is of crucial importance from economic and social perspectives since they may ultimately affect their choices of education and professional careers (Ainara Gonzalez de San Roman & Sara de la Rica, 2010).
Besides that concern about potential rural-urban differences in mathematics is not limited to Mongolia, but also appears to be a global issue. Many studies comparing students from rural and urban areas on educational outcome variables especially on mathematics have been conducted in South Africa, Nigeria Australia, India, Columbia,
America and Peru.
Not surprisingly, some of those studies support that education in rural schools is better than education in urban schools while others have different opinion.
So, potential of rural-urban urban difference has been major topic of academic research for last twenty years.
1.2 Research objectives:
The present study is going to be guided by the following specific research objectives:
1. To investigate the difference in mathematics performance between boys and girls.
2. To investigate the difference in mathematics performance between students from urban and rural schools.
3. To investigate the difference in item difficulty indices between TIMSS items and Mongolian items.
1.3 Significance of the study
This study is significant for several reasons. It will provide fundamental knowledge about educational measurement and statistics which is being newly developed in Mongolia, specifically assumptions of Item Response Theory (IRT) and its models. It is hoped that this study will give a clear picture of educational quality and performance in urban and rural schools and will provide significant points to the national mathematics curriculum to evaluate which mathematics content area should be developed more in the future.
Hopefully, the study will also help in the understanding of the importance of international educational assessment which can be linked to education quality improvements.
1.4 Limitations of the study
Although this research was carefully prepared, I am still aware of its limitations and shortcomings. Several limitations to our study exist. Firstly, because of the time limit and difficulty in distance sample size of the students from rural area is smaller compare to urban areas’. A larger sample size would allow us to be more precise about
the size of the effects. Secondly, the students’ overloaded work to some extent, might affect test reliability because they were required to take part in many studies at the same time.
1.5 Organization of the study
Chapter 2 gives a description and review of literature. Chapter 3 develops the data collection, sample size and methodology for this research. Chapter 4 presents the results obtained from the methodology. Finally, the discussion of the results and conclusion for future research are stated in Chapter 5.
CHAPTER TWO
LITERATURE REVIEW
2.1. Related studies
Over the past three decades, a considerable number of studies seeking to determine a relationship between gender and mathematics performance have been conducted in various countries. In recent years research efforts (Fierros, 1999; Zhang and Manon, 2000; Johnson, 2000; Leahe and Guo, 2001; Chrostowski, S.J and Smith, T.A, 2004, Ericikan, McCreith, and Lapointe, 2005) show no significant differences in math achievement between boys and girls. Nonetheless, differences favoring male students begin to emerge with time (Campbell, 1995; Mullis y Stemler, 2002).
Contrary to these studies, other authors find gender differences in overall mathematics achievement between boys and girls. In particular, Catherine T.Amelink (2009) finds that among fourth-graders, males outscored their female peers by 2 points in NAEP 2007. Examining differences by content area reveals males scored higher on average than females in all mathematics content areas (numbers and operations, measurement, data analysis and probability, algebra) with the exception of geometry in which female students scored higher. Among eight graders, males also outscored their female peers by 2 points in 2007. With the exception of geometry and data analysis/probability, male students scored higher on average than female students in all mathematics content areas (Catherine T.Amelink 2009).
In another study, Guiso, Monte, Sapienza & Zingales (2008) make use of the 2003 PISA survey and construct several measures of the degree of gender equality of a country-e.g. the Gender Gap Index (World Economic Forum). They find a higher math performance by girls in countries with more gender-equal cultures.
Moreover, Ina V.S Mullis and Steven E.Stemler (2002) analyzed gender differences for high-achieving students on TIMSS. According to the study, for high-performing students, significant gender differences in advanced mathematics achievement favoring males were found in 11 out of 13 countries. For low-performing students, however, statistically significant gender differences in achievement were found in 9 out of 13 countries (Ina V.S Mullis and Steven E.Stemler 2002).
According to PISA 2009 internationally, in 35 out of 65 countries and economies that participated in PISA 2009, boys score significantly higher in mathematics than girls. However, in 25 countries there is no statistically significant difference, and in 5 countries (Qatar, Kyrgyzstan, Lithuania, Trinidad and Tobago, and Albania) girls have slightly higher scores (PISA 2009 at a Glance).
Furthermore in most countries that participated in TIMSS 2007, males and females in the fourth grade had approximately the same average mathematics achievement. The few statistically differences that were observed favored males rather than females (Korea, Japan, and Netherlands). Gender differences in average mathematics achievement were also small for eighth grade students. Again however, all of the statistically significant differences favored males rather than females. Males had significantly higher average mathematics achievement than females in Japan, Spain, Portugal, Iran, Korea, Denmark, Greece, and Israel. In advanced mathematics test which is one of the two measures of mathematics achievement, in most of the countries, males had significantly higher average achievement than females (Gender Differences in Achievement TIMSS, 2000). This information informs the first hypothesis in this study.
H1: There is a significant difference in math performance between male and female students.
Moreover the concern about potential rural-urban differences in education outcomes is not limited to Mongolia, but rather appears to be a global issue. For example, research comparing students from rural and urban areas on a variety of social, psychological, and educational outcome variables have been conducted in South Africa (Liddell, 1994; Mwamwenda, 1992), Nigeria (Akande, 1990), Australia (Northern Territory Department of Education, Darwin, Australia, 1992), India (Singh & Varma, 1995), and Peru (Stevenson, Chen, & Booth, 1990). Because rural-urban differences in cultural, economic, and political conditions can differ drastically from one country to another, findings from a study conducted in one country are not necessarily generalizable to another. Not surprisingly, like many other issues in education, the research comparing rural students with their suburban and urban counterparts in educational outcomes in general, and in academic achievement in particular, has yielded inconsistent findings (E.Bouck, 2004, Khattri, Riley, & Kane,
1997, Young, D. J. 1998). While some studies fail to find any statistically significant differences (Alspaugh, 1992; Snyder & West, 1992; Edington & Koehler, 1987; Haller, Monk, & Tien, 1993), other studies find that students in metropolitan areas exhibit better performance than their rural counterparts in mathematics, reading, and science and on the ACT (Coe, Howley, & Hughes, 1989a, b, Edington & Koehler, 1987; Greenberg & Teixeira, 1995; Lindberg, Nelson, & Nelson, 1985). In other studies, however, students from rural schools were found to have performed better than those from metropolitan areas (Alspaugh, 1992; Alspaugh & Harting, 1995; Haller et al., 1993).
Researchers have compared rural students with students from metropolitan schools on several major areas of academic achievement, including reading, mathematics, science, and social studies. For math, some studies have found no differences in math achievement scores (Alspaugh, 1992) or the higher-order thinking skills presumably required for mathematics achievement (Haller et aI., 1993). Others, however, have found differences in math achievement among schools of different size (Wilson, 1985). Lindberg and colleagues (1985) found that students from small rural schools performed worse than those attending larger schools, and some researchers have concluded that such differences may not be attributable to differences in technology resources (Templeton & Paden, 1991).
H2: Students from small rural schools perform worse than those attending large urban schools.
2.2 Overview of Item Response Theory
During the last decades a new measurement system, item response theory (IRT), has been developed and has become an important complement to CTT (Classical Test Theory) in the design and evaluation of tests. The potential of IRT for solving different kind of testing problems is substantial, provided that there is fit between the model and the test data of interest. IRT rests on two basic postulates: a) the performance of an examinee on a test item can be predicted (or explained) by a set of factors called traits, latent traits or abilities; and b) the relationship between examinees’ item performance and the set of traits underlying item performance can be described by a monotonically increasing function called an item characteristic function or item characteristic curve
(Hambleton et. al., 1991, p. 7).
IRT allows us to evaluate examinee ability and to describe how well items on the test are performing. Instead of treating ability solely as a function of examinee’s score, IRT uses the concept of an Item Characteristic Curve (ICC) to show the relationship between examinee ability and performance on an item. In IRT, ability and item parameters are both estimated based on examinee’s response patterns on the test. The number of item parameters to be estimated determines which IRT statistical model will be used. Although these models involve complex mathematical procedures, the basic concepts are easy to understand.
For these reasons, IRT has become a popular psychometric method for educational assessment because of its utility for test creation, but it has only recently been applied to the study of personality and psychopathology. For example, Santor, Ramsey, and Zuroff (1994) used IRT methods to examine gender differences on the Beck Depression Inventory. The use of IRT methods is still largely confined to studies of cross-cultural or racial differences in personality and attitude (Cooke, Kosson, & Michie, 2001; Ellis, Becker, & Kimmel, 1993; Ellis, Minsel, & Becker, 1989; Huang, Church, & Katigbak, 1997).
Last two decades, numbers of studies were carried out based on IRT models to investigate gender difference in various kinds of subjects such as mathematics, reading, psychology, and computer science.
For instance, Sunha Kim and Mido Chang, (2010) studied the effect of computer games on students math achievement and investigated the relationship differ by gender using Item Response Theory scale scores to measure students’ math achievement with five plausible values. This study found that male students who played math computer games daily performed significantly worse than the students who never played. The study also found a gender- based differential effect of computer games on math achievement the computer game was significantly associated with males’ math achievement, but not with females’ achievement.
Likewise previous study, Christina used IRT model (3 PL) to compare item difficulty indices for males and females from CTT (Classical Test Theory) with item difficulty parameters for males and females estimated by IRT based on WORD items.
However, the study found no significant difference between CTT and IRT in terms of gender difference.
Another study by J. Serrita Jane, Thomas F.Oltmanns & Susan C.South, Eric Turkheimer applied the two-parameter logistic model (2PL) to examine gender difference in personality disorders. The study found men and women with equivalent levels of pathology endorsed the items at different rates.
Furthermore, an early study (Ou Lydia Liu, Mark Wilson, and Insu Paek, 2008) applied multidimensional Rasch model to examine gender difference on large-scale standardized tests, the 2003 PISA mathematics data. The study found the least amount of gender difference in favor of boys.
TIMSS 2007 used Item Response Theory (IRT) methods to summarize the achievement for each grade on a scale with a mean of 500 and standard deviation of 100 and found significant gender differences in advanced mathematics achievement favoring males were found in 11 out of 13 countries. At the eighth grade on average across the TIMSS 2007 countries, girls had higher average mathematics achievement than boys in 16 of the participating countries, including Lithuania, Malaysia, Egypt, Bulgaria, Botswana, Romania, Cyprus, Jordan, Singapore, Kuwait, Saudi Arabia, Thailand, Bahrain, the Palestinian National Authority, Qatar and Oman. Boys had higher average achievement than girls in 8 countries including Algeria, Lebanon, Australia, the Syrian, Arab Republic, El Salvador, Tunisia, Ghana, and Colombia.
TIMSS Advanced 2008 used Item Response Theory (IRT) methods again to summarize the advanced mathematics scale with a mean of 500 and standard deviation of 100. According to TIMSS Advanced 2008 report, several countries had gender differences in most of the content areas.
2.3 Item Response Theory Models
Thissen and Orlando (2001) discussed two approaches to model building in item response theory. One approach is to develop a well-fitting model to reflect the item response data by parameterizing the ability or trait of interest as well as the properties of the items. The goal of this approach is item analysis. The model should reflect the properties of the item response data sufficiently and accurately, so that the behavior of the item is summarized by the item parameters. The philosophy is that the items are
assumed to measure as they do, not as they should (Thissen & Orlando, 2001). This approach to model building believes the theory of measurement is to explain (i.e., model) the data.
Another approach of IRT model building is to obtain specific measurement properties defined by the model to which the item response data must fit. If the item or a person does not fit within the measurement properties of the IRT model, assessed by analysis of residuals (i.e., item and person fit statistics), the item or person is discarded. This approach follows that of the Rasch (1960) models, and in the cases where the data fits the model, offers a simple interpretation for item analysis and scale scoring. This approach to model building believes optimal measurement is defined mathematically, and then the class of item response models that yield such measurement is derived. The two approaches described above yield a division in psychometrics. Those who believe health research measurement should be about describing the behaviors behind the response patterns in a survey will use the most appropriate IRT model (e.g., Rasch/One- Parameter Logistic Model, Two-Parameter Logistic Model, Graded Model) to fit the data. The choice of the IRT model is data dependent. Researchers from the Rasch tradition believe that the only appropriate models to use are the Rasch family of models, which retain strong mathematical properties such as specific objectivity (person parameters and item parameters estimated separately) and summed score simple sufficiency. Several advantages of the Rasch model include: the ability of the model to produce more stable estimates of person and item properties when there is a small number of respondents, when extremely non-representative samples are used, and when the population distribution over the underlying trait is heavily skewed.
Embretson and Reise (2000) suggest one should use the Rasch family of models when each item carries equal weight (i.e., each item is equally important) in defining the underlying variable, and when strong measurement model properties (i.e., specific objectivity, simple sufficiency) are desired. If one desires fitting an IRT model to existing data or desires highly accurate parameter estimates, then a more complex model such as the Two-Parameter Logistic Model or Graded Model should be used.
The Rasch Simple Logistic Model (Rasch, 1960) was the first to develop the
however this model differed from models discussed below. In the Rasch Model, a person is characterized by a level on a latent trait ξ, and an item is characterized by a degree of difficulty δ. The probability of an item endorsement is a function of the ratio of a person's level on the trait to the item difficulty ξ/δ (Tinsley, 1992).
Given that the data adequately fit the Rasch model, one can make simple comparisons of the items and respondents according to the principles of specific
objectivity. Specific objectivity means that comparison of two items' difficulty
parameters are assumed to be independent of any group of subjects being surveyed, and the comparison of two subjects' trait levels does not depend on any subset of items being administered (Mellenbergh, 1994).
The Rasch model assumes that the items are all equal in discrimination (weight equally on a factor) and that chance factors (e.g. guessing) do not influence the response. For a particular item, Rasch proposed a simple trace line (probability) function that increases from zero to one with trait level, as:
T= ξ
ξ δ
(2.2.1)
The model in this form has the interpretation of the probability of a positive response being equal to the value of the person parameter ξ relative to the value of the item parameter δ (Linden & Hambleton, 1997).
If we use current item response theory notation, substituting exp θ for ξ and exp b for δ, we have:
T =
=
[ ] (2.2.2)
As what is shown above, theta (θ) represents a person's trait level, and b represents the item threshold. This model shows the dependent variable, the probability of endorsing an item, as a function of the difference between two independent variables, the person’s level on the underlying trait θ and the item threshold b (difficulty). Rasch constrained the sum of the difficulty parameters for all scale items to be equal to zero (∑ = 0), thus setting the scale of the θ parameter. Given this constraint, the population distribution of θ is unspecified. The distribution "has some mean, relative to the average item difficulty, and some variance, relative to the unit slope of the trace lines. The shape of the population distribution [of θ] is
unknown; it is whatever shape it has to be to produce the observed score distribution." (Thissen & Orlando, 2001, p.76-77).
The One-Parameter Logistic Model (1PL) was developed based on the
development of the Rasch model, but both have similar features and are mathematically equivalent.
The one-parameter logistic (1PL) model trace line for a given item i is: Ti (ui =1/θ)
=
[ ]
(2.2.3)
Ti (ui =1/θ) traces the conditional probability of a positive (ui =1) response to
item i as a function of the trait parameter θ, the threshold or difficulty parameter bi, and the discrimination parameter a. Where the Rasch model had a fixed slope of one for all items, the 1PL model only requires the slope to be equal for all items (Thissen & Orlando, 2001).
The population distribution of the underlying variable θ for the one-parameter logistic model (as well as the two and three-parameter logistic models) is usually specified to have a population mean of zero and a variance of one. The threshold (or difficulty) parameters bi are located relative to zero, which is the average trait level in the population, and the slope parameter a takes some value relative to the unit standard deviation of the latent variable (Thissen & Orlando, 2001). Thus, it is the latent variable θ the model is assuming to be normally distributed, not the categorical item responses (Thissen & Steinberg, 1988).
The Two-Parameter Logistic Model (2PL; Birnbaum, 1968) allows the slope or
discrimination parameter “a” to vary across items instead of being constrained to be equal as in the one-parameter logistic or Rasch model. The relative importance of the difference between a person’s trait level and item threshold is determined by the magnitude of the discriminating power of the item (Embretson & Reise, 2000). The two-parameter logistic model trace line for the probability of a positive response to item i for a person with latent trait level θ is:
Ti (u i = 1/ )
=
[ .(2.2.4)
The constant, 1.7, is added to the model as an adjustment so that the logistic model approximates the normal ogive model. Approximately half of the literature
includes the adjustment and half does not (Thissen & Steinberg, 1988).
The Three-Parameter Logistic IRT Model (3PL, Lord, 1980) was developed in
educational testing to extend the application of item response theory to multiple choice items that may elicit guessing. For item i, the three-parameter logistic trace line is:
Ti (u i = 1/ )
= +
[ .(2.2.5)
The guessing parameter c is the probability of a positive response to item i even if the person does not know the answer. When c = 0, the three-parameter model is equivalent to the 2PL model. Including the guessing parameter changes the interpretation of other parameters in the model.
The threshold parameter b is the value of theta at which respondents have a (.5 +.5c)*(100) % chance of responding correctly to the item (Thissen & Orlando, 2001).
2.4 Item parameters
The item parameter is a fundamental concept of IRT. Common IRT models are based on one, two, or three parameters. Here is a model containing all three parameters.
Item discrimination parameter (a)
One characteristic of a good test item is that high-ability candidates will answer it correctly more frequently than lower-ability candidates. The Item discrimination parameter expresses how well an item can differentiate among examinees with different ability levels. Good items usually have discrimination values ranging from 0.5 to 2. This is illustrated by the ICC plots below. The steeper the slope of an ICC is the higher an item’s discrimination value. High discrimination indicates that higher-scoring examinees tend to answer the item correctly, while lower-scoring examinees tend to answer it incorrectly. Suppose we administer a 30-item test to a large group of examinees. After testing, we select samples of high-ability examinees (Group A) and low-ability examinees (Group B). Examinees in Group A answered an average of 28 items correctly, compared to an average of only 8 correct answers in Group B. An item that nearly all examinees in Group B answered correctly and nearly all examinees in Group B answered incorrectly will have a high discrimination estimate.
Item difficulty parameter (b)
The difficulty of an item, known as the b parameter, is the point where the S-shaped curve has the steepest slope. The more difficult an item is, the higher an examinee’s ability must be in order answer the item correctly. Items with high b values are hard items, which low-ability examinees are unlikely to answer correctly. Items with low b values are easy items, which most examinees, including those with low ability, will have at least a moderate chance of answering correctly.
Pseudo-guessing (c)
Some IRT models include a pseudo-guessing parameter. This c parameter expresses the likelihood that an examinee with very low ability can guess the correct response to an item and therefore has a greater than zero probability of answering correctly. For example, an examinee who randomly selects responses to items that have four response choices should answer these items correctly about 1 out of 4 time, meaning that the probability of guessing correctly is about 0.25. The ICC still retains the S-shape, but now the lowest point on the curve is greater than zero.
2.2.1 Overview of TIMSS.
TIMSS (Trends in International Mathematics and Science) aims to help countries improve teaching and learning in mathematics and science and has measured in mathematics and science at the fourth and eighth grades (13-14). TIMSS is IEA’s (International Association for the Evaluation of Educational Achievement) series of highly important international assessment of mathematics and science.
TIMSS 2007 used Item Response Theory (IRT) methods to summarize the achievement for each grade on a scale with a mean of 500 and standard deviation of 100 and found significant gender differences in advanced mathematics achievement favoring males were found in 11 out of 13 countries. At the eighth grade on average across the TIMSS 2007 countries, girls had higher average mathematics achievement than boys in 16 of the participating countries, including Lithuania, Malaysia, Egypt, Bulgaria, Botswana, Romania, Cyprus, Jordan, Singapore, Kuwait, Saudi Arabia, Thailand, Bahrain, the Palestinian National Authority, Qatar and Oman. Boys had higher average achievement than girls in 8 countries including Algeria, Lebanon, Australia, the Syrian, Arab Republic, El Salvador, Tunisia, Ghana, and Colombia.
TIMSS Advanced 2008 used Item Response Theory (IRT) methods again to summarize the advanced mathematics scale with a mean of 500 and standard deviation of 100. According to TIMSS Advanced 2008 report, several countries had gender differences in most of the content areas. In the Philippines and Slovenia, males had significantly higher average scores than females in all six areas. In Iran, males had significantly higher average achievement than females in all except the knowing cognitive domain. In contrast, in Lebanon, females had higher average achievement than males in all except the reasoning domain.
Also, Armenia, the Netherland, and Norway had almost no differences in average achievement by gender; except males had higher average achievement than females in calculus and in applying in Armenia, higher average achievement in knowing in the Netherlands, and in reasoning in Norway.
Nationally representative samples of approximately 4,000 students from 150-200 schools participated in TIMSS 2011 at each level. More than 300,000 students participated in the TIMSS 2011 fourth grade assessment and a further 300,000 in the eighth grade assessment.
The results of high-quality international assessment such as TIMSS 2007, 2008, 2011 can make important contributions to improving educational quality. Yet, it must be kept in mind that countries are very different from one another in fundamental ways, and educational systems reflect these differences. One of the most important features of IEA studies is the substantial effort expended to address the more substantive and important questions about the meaning of the achievement results. TIMSS has the specific goal of increasing understanding of the effects of educational policies and practices within and across countries.
15
2.6 Mathematics Curriculum in 8
thgrade in Mongolia
Mathematics is introduced beginning in the first grade and is taught each year
through the 12th grade. According to the national curriculum, mathematics education in
secondary school aims to develop students’ calculation, reasoning and formalizing skills, as well as to develop students’ visual, spatial, and statistical thinking. Understanding and applying mathematical concepts, models, methods, and relationships allows students to better know the world, solve everyday life problems, and adopt the culture of human thought and action developed through the centuries.
Knowledge gained in various mathematical content areas should help students orient themselves in everyday life and prepare for further successful study of mathematics, natural sciences, and technologies. Through mathematical study, students should be able to communicate using mathematical concepts as a means of conveying information, learn to use mathematical vocabulary and symbols, adopt elements of mathematical reasoning, and solve simple problems from everyday life that corresponds to their experience and interests. Students should understand the importance of mathematics for their own and others’ lives and its applicability in various spheres of practical human endeavors. Lastly, students should value the honestly, perseverance, and creativity needed for intellectual work, and desire additional mathematical knowledge and skills.
16
Table 1
Mathematics Curriculum Topics Taught Seventh Grade
Area of Mathematics Topics
Arithmetic
Ratio, proportionality, and percentages
Whole numbers, place value, factorization and four operations
Computation, estimations, and approximations involving whole numbers Fractions equivalent fractions, and ordering of fractions
Decimals, place value, ordering and converting to common fractions Representing decimal and fractions using words, numbers, models Computations with fractions
Computation with decimals
Algebra Numeric, algebraic, and geometric patterns
Sums, products, and powers of expressions containing variables Evaluating expressions for given numeric value
Simplifying or comparing algebraic expressions
Simple linear equations and simultaneous (two-variable) equations
Geometry and Measure
Angles: acute, right, straight, obtuse, and reflex Relationships for angles at a point, on a line,
Properties of geometric shapes, triangles, quadrilaterals, and other common polygons
Constructing or drawing triangles and rectangles of given dimensions Similar triangles and their properties
Pythagorean theorem to find length of side of a right triangle
Statistics and Probability Perform simple proof; draw elementary conclusions from statements; Extract information from tables, diagrams, and graphs;
Compose tables and draw diagrams and graphs, Calculate average values of results of measurement,
Find the frequency of events using one’s own observations and statistical data, and find the probabilities of random events.
CHAPTER THREE
METHOD AND MATERIALS
3.1. Sample size
The sample size is stratified at two stages. First, schools are randomly selected; and second, students at each school are randomly assigned to take a mathematics test. The sample size covers 502 students attending year eight at 12 secondary schools in urban and rural area in Mongolia, 6 of which belong to the urban area, while another 6 schools are from rural area. Two schools from each urban and rural area are dropped from the sample size because they provide only 10 observations, which make any calculation at the tails of the distribution problematic. The study ends up with 482 students (n=482, mean=14.57, standard deviation=0.193) at 10 schools.
3.2. Data collection procedures
Table 2 shows the dates when the test was conducted and its respective duration. Table 2
Time Schedule for Data Collection
Test Dates Total time Location
Math test January.10th, 2013 40 minutes Urban (School №20) Math test January.12th, 2013 40 minutes Urban (School №40)
Math test January.26th, 2013 40 minutes Urban (“Oyunii Undraa” school) Math test February. 14th, 2013 40 minutes Urban (“Shine-Erin” school) Math test March. 10th, 2013 40 minutes Urban (“Shine-Ekhlel” school) Math test January. 11th, 2013 40 minutes Rural (Altai province, School №1) Math test January. 20th, 2013 40 minutes Rural (Altai province, School №2) Math test January. 25th, 2013 40 minutes Rural (Altai province, School №2) Math test February, 5th, 2013 40 minutes Rural (Selenge, School №3) Math test February, 10th, 2013 40 minutes Rural (Selenge, School №1)
3.3. Research instruments
The mathematics test with thirty items was introduced, 15 are of those TIMSS mathematics items and 15 of those are items developed by Mongolian mathematics
text book writers and each item has four multiple choices. TIMMS items were originally in English and translated into Mongolian and reviewed by high school English and Math teachers in Mongolia. This math test is a group test which is aimed to evaluate 8th graders mathematics ability based on TIMSS mathematics curriculum for 8th grade and Mongolian mathematics curriculum in lower secondary grades. Test items are grouped into five content categories such as arithmetic, statistics and probability, geometry, algebra, and proportionality. Number of items for each category is decided according to Mongolian 7th grade mathematics curriculum hour. The test was administrated in paper-based format and lasted for 40 minutes which is one class hour. The five content categories, number of items and curriculum hours are shown in Table 3.
Table 3
The five content categories, number of items and curriculum hours
Content category Number of items Curriculum hours
Arithmetic 8 52 Algebra 12 60 Geometry 4 10 Statistics and probability 2 6 Proportionality 4 10
Several considerations guided the selection of the variables for the statistical analysis. First, students’ gender was included to see whether it is related to their mathematics performance. Some researchers have hypothesized that boys do better than girls in mathematics. However some studies found different results favoring girls. Second, school locations which might influence students’ mathematics performance were included as urban and rural area. In other words, the research pattern is being used are descriptive survey research comparing selected urban and rural school. Third, TIMSS released items and Mongolian items were included in the test to see if these items have different item difficulty.
The collected data is analyzed using a program called Statistical Package for the Social Science (SPSS version 12.0 For Windows) and BILOG-MG.
For the statistical analysis, t-test (William Sealy Gosset) was the most important research method to meet main objectives of our research which was used to decide the difference between variables. For the item analysis, 3 parameter logistic model was used since our test has four multiple choices, in other words guessing parameter (c) is introduced.
3.3.1. BILOG-MG
BILOG-MG is an extension of the BILOG program that is designed for the efficient analysis of binary items, including multiple choice or short-answer items scored right, wrong, omitted, or not-presented. BILOG-MG is capable of large-scale production applications with unlimited numbers of items or respondents. It can perform item analysis and scoring of any number of sub-tests or subscales in a single program run. All the program output may be directed to text files for purposes of selecting items or preparing reports of test scores.
The BILOG-MG program implements an extension of Item Response Theory (IRT) to multiple groups of respondents. It has many applications in test development and maintenance. Applications of multiple-group item response theory in education measurement and other large-scale testing programs include nonequivalent groups equating for maintaining the comparability of scale scores as new forms of the test are developed; vertical equating of test forms across school grades or age groups; analysis of Differential Item Functioning (DIF) associated with demographic or other group differences; detecting and correcting for item parameter trends over time (DRIFT); calibrating and scoring tests in two-stage testing procedures designed to reduce total testing time; estimating latent ability or proficiency distributions of students in schools, communities, or other aggregations.
3.3.2. SPSS (Statistical Package for the Social Sciences)
SPSS (originally, Statistical Package for the Social Sciences, later modified to read Statistical Product and Service Solutions) was released in its first version in 1968 after being developed by Norman H.Nie, Dale H.Bent and C. Hadlai Hull. SPSS is among the most widely used programs for statistical analysis in social science. It is used by market researchers, health researchers, survey companies, government, education researchers, marketing organizations and others.
CHAPTER FOUR
RESULTS
4.1. Item analysis
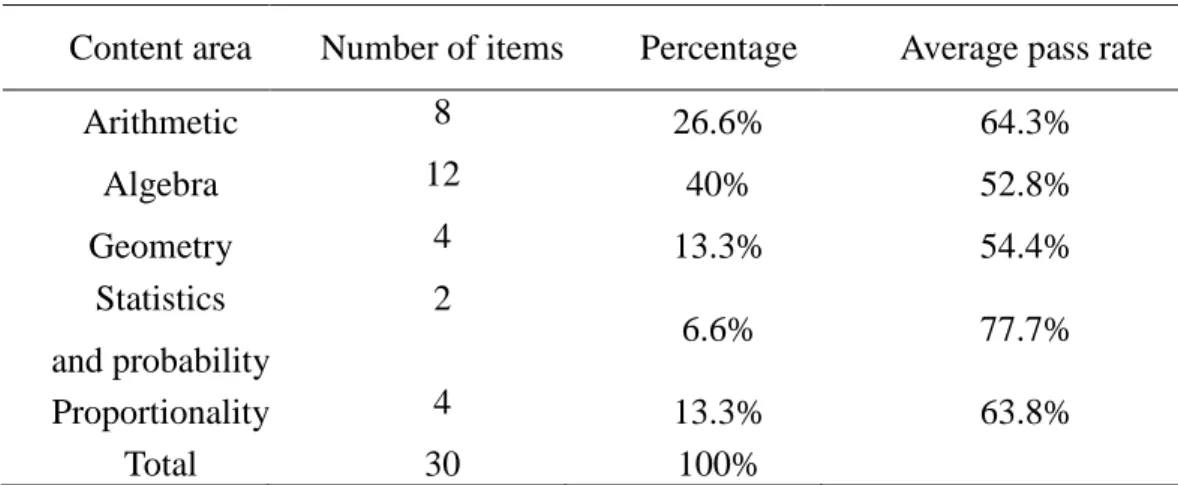
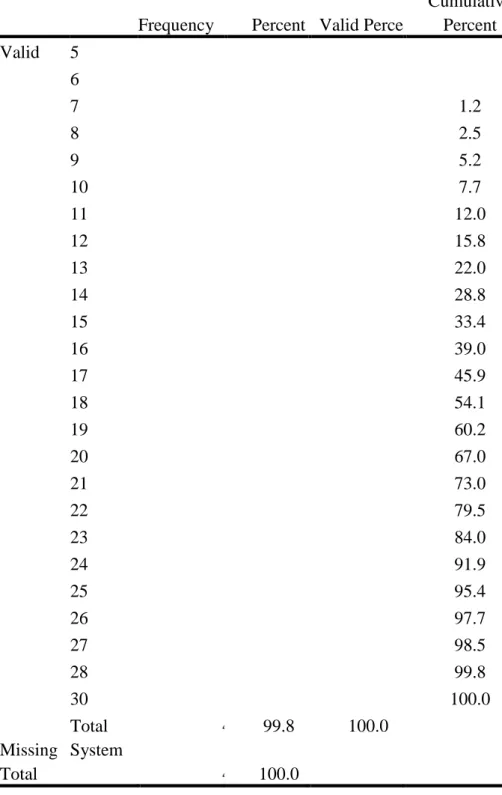
Table 6 reports results from the five content categories that measured students’ levels of mathematics knowledge. While 77.7% of students answered the statistics and probability items correctly, only 54.4% answered the geometry items correctly and 63.8% answered the proportionality items correctly. Moreover only 52.8% answered the algebra items correctly and 64.3% answered the arithmetic items correctly. In any case, the low correct response rates, particularly to the geometry and algebra items, indicated that many 7th graders lack knowledge of basic mathematics concept. Furthermore 45.8% or 221 of students answered less than 18 items correctly and, only one student answered all 30 items correctly. According to frequency table (Table 10) 38.1% or 184 of students answered 18-23 items correctly and while 13.7% or 28 of students answered 24-26 items correctly. Interestingly, only one student who answered all 30 items correctly is a boy and very close to him 10 students answered 27-28 items correctly. Two students shown the worst performance answering only 5 items correctly, one is male and another is female. Finally, mean mathematics ability of the 8th graders is -0.021 which is very low, while all students’ ability was found between 2.665 and -2.043.
Table 4
Average pass rate by content area
Content area Number of items Percentage Average pass rate
Arithmetic 8 26.6% 64.3% Algebra 12 40% 52.8% Geometry 4 13.3% 54.4% Statistics and probability 2 6.6% 77.7% Proportionality 4 13.3% 63.8% Total 30 100%
index (2.972) which is the hardest, while Item 2 (Arithmetic content area) has the lowest item difficulty index (-2.585) which is the easiest item.
Table 5
Item Response Theory parameters
Item Total Right IRT parameters
a b c PIRT 1 482 305 0.679 0.199 0.320 0.628 2 482 433 0.447 -2.585 0.283 0.898 3 482 355 0.729 -0.393 0.343 0.733 4 482 185 0.685 2.972 0.347 0.377 5 482 275 0.379 0.960 0.322 0.566 6 482 174 0.954 1.840 0.285 0.353 7 482 395 0.863 -1.104 0.236 0.823 8 482 274 0.840 0.840 0.380 0.559 9 482 312 0.814 -0.279 0.184 0.650 10 482 279 0.960 0.305 0.275 0.575 11 482 274 0.836 0.228 0.228 0.567 12 482 352 0.852 -0.432 0.301 0.728 13 482 390 0.690 -1.070 0.287 0.810 14 482 396 0.659 -1.200 0.287 0.822 15 482 363 1.139 -0.724 0.172 0.758 16 482 103 1.029 1.681 0.116 0.210 17 482 89 1.709 2.044 0.155 0.180 18 482 329 0.626 -0.189 0.304 0.680 19 482 285 1.007 0.080 0.219 0.591 20 482 151 1.428 1.208 0.181 0.306 21 482 336 1.051 -0.335 0.250 0.697 22 482 199 0.463 1.878 0.256 0.410 23 482 205 1.279 2.243 0.395 0.414 24 482 387 1.461 -0.696 0.300 0.802 25 482 326 1.021 -0.307 0.219 0.677 26 482 349 1.636 -0.313 0.297 0.721 27 482 360 2.177 -0.449 0.261 0.744 28 482 333 0.750 -0.449 0.216 0.693 29 482 111 0.800 1.913 0.133 0.229 30 482 276 0.687 0.106 0.189 0.573
According to Table 6 which shows correct answer percentage of TIMSS & Mongolian items, Mongolian items have higher item difficulty than TIMSS items. In average, 67.47 % of students answered TIMSS items correctly, while 53% of students answered Mongolian items
correctly.
Table 6
Comparison of item difficulty indexes
TIMSS Mongolia Item Percentage of correct
answer
Item Percentage of correct answer 1 63.27% 16 21.36% 2 89.83% 17 18.46% 3 73.65% 18 68.25% 4 3.77% 19 58.28% 5 57.1% 20 31.12% 6 36.1% 21 69.70% 7 81.95% 22 41.28% 8 56.84% 23 42.53% 9 64.73% 24 80.29% 10 58.09% 25 67.63% 11 57.88% 26 72.40% 12 73.02% 27 74.68% 13 80.70% 28 69.08% 14 82.15% 29 22.82% 15 75.31% 30 57.26% Average 67.47% Average 53.00%
4.2. Statistical analysis
Urban versus Rural area
Claim: There is a significant difference between math performance and location
of Mongolian students. In comparing urban students’ math ability against rural students’ math ability, the hypothesis is:
H0: µ urban > µ rural HA: µ urban = µ rural
Table 7
Mean of the students’ ability and t-test for math performance in location
*significant level .05
Location n mean SD Equal Variance t p
Urban 324 .185 0.888 1.213 .271 6.769 0.000* Rural 158 - .387 0.837
Based on Table 7, the p-value for the test statistics is 0.000 and the test statistics value is 6.769. Since the p-value of test statistics is smaller than 0.05 of level of significance, we may accept the null hypothesis at 5% level of significance. Hence, we conclude there is a significant difference between urban students and rural students in math performance. Mean for urban students’ math ability is 0.185 versus mean for rural students’ math ability is - 0.387. However, the mean difference is small even though the difference is significant.
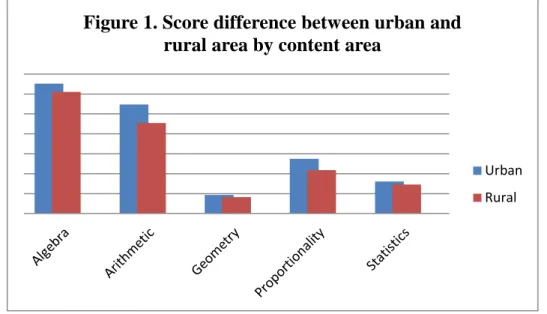
Figure 1 indicates that score difference between urban and rural students. Examining differences by content area reveals urban students scored higher on average than rural students in all mathematics content areas (algebra, arithmetic, geometry, proportionality, and statistics and probability).
Boys versus Girls
Claim: There is a significant difference between math performance and gender of
Mongolian students. In comparing boys’ math scores against girls’ math scores, the hypothesis is:
H0: µ male # µ female HA: µ male = µ female
Figure 1. Score difference between urban and rural area by content area
Urban Rural
Table 8
Mean of the students’ ability and t-test for math performance in gender
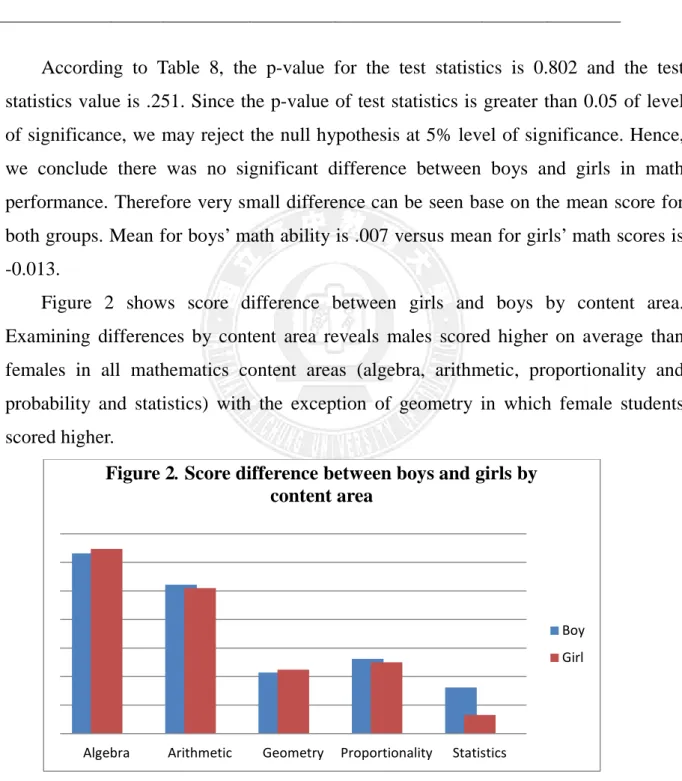
According to Table 8, the p-value for the test statistics is 0.802 and the test statistics value is .251. Since the p-value of test statistics is greater than 0.05 of level of significance, we may reject the null hypothesis at 5% level of significance. Hence, we conclude there was no significant difference between boys and girls in math performance. Therefore very small difference can be seen base on the mean score for both groups. Mean for boys’ math ability is .007 versus mean for girls’ math scores is -0.013.
Figure 2 shows score difference between girls and boys by content area. Examining differences by content area reveals males scored higher on average than females in all mathematics content areas (algebra, arithmetic, proportionality and probability and statistics) with the exception of geometry in which female students scored higher.
Algebra Arithmetic Geometry Proportionality Statistics Figure 2. Score difference between boys and girls by
content area
Boy Girl
Gender n mean SD Equal Variance t p Male 261 .007 .878 1.345 .247 .251
.802 Female 221 - .013 .951
CHAPTER FIVE
DISCUSSION & CONCLUSION
This study has conducted analyses to examine the issue of whether any gender and location differences exist in students’ mathematics achievement using Item Response Theory and test statistics method. Performance comparisons among males and females, and students from urban and rural schools were made for sample of 482 7TH graders in Mongolia.
According to the first objective of the study there was no significant gender difference in mathematics achievement among Mongolian 8th graders. However, it had small difference favoring boys. This finding supports the findings of several previous studies which carried out by Fierros, (1999), Zhang and Manon (2000) and Johnson (2000) and Erickan, McCreith, and Lapointe, (2005). Interestingly, Examining differences by content area reveals males scored higher on average than females in all mathematics content areas (algebra, arithmetic, proportionality and probability and statistics) with the exception of geometry in which female students scored higher. This finding is exactly parallel to the study carried out by Catherine T.Amelink (2009). Hence, we may conclude that girls have better geometric ability than boys.
To the second objective, research has also found there is a statistically significant difference in math achievement between students from rural and urban schools. This is parallel to the findings of Lindberg and Wilson (1985), and Raul Ramos and his colleagues (2012) and Jennifer Lawless (2009) which say that students from small rural schools performed worse than those attending large urban schools. This might be caused of several reasons as follow. Firstly, it is due to the distance and environment problem. Five rural schools were sampled in this study 3 of those are located over 1000 km far away from the urban area. Some evidence say that the support from the state and federal recourse come to the rural schools slowly. Therefore children from rural area still need to do house chores and help out on the farm and take care of the domestic animals. Moreover, rural schools have lack of classroom equipments and latest trend in technology compare to urban schools. For example: Students from urban schools have greater access to many resources and therefore have opportunities that
are not as easily accessible to rural students (Jennifer Lawless). Secondly, rural schools might be short of qualified teachers.
Surprisingly, in some rural schools, one teacher provides 2-3 different classes at the same time which means rural schools have lack of number of professional teachers for particular subjects.
To the third objective, Mongolian math items had higher item difficulty index versus TIMSS mathematics items for 8TH grade. However, the hardest item was found among TIMSS items. Furthermore, Mongolian students haven’t been experienced in PISA or TIMSS yet. So, it could be a signal that claims Mongolia should participate in TIMMS or PISA to evaluate its national curriculum on several particular subjects comparing other participating countries’ experience.
According to the item analysis results from the five content categories that measured students’ levels of mathematics knowledge. While 77.7% of students answered the statistics and probability items correctly, only 54.4% answered the geometry items correctly and 63.8% answered the proportionality items correctly. Moreover only 52.8% answered the algebra items correctly and 64.3% answered the arithmetic items correctly. Furthermore 45.8% or 221 of students answered less than 18 items correctly and, only one student answered all 30 items correctly. According to frequency table (Table) 38.1% or 184 of students answered 18-23 items correctly and while 13.7% or 28 of students answered 24-26 items correctly. Therefore, mean mathematics ability of the 7th graders is -0.021 which is very low, while all students’ ability was found between 2.665 and -2.043. Hence, we conclude in any case, the low correct response rates, particularly to the geometry and algebra items, indicated that many 7th graders lack knowledge of basic mathematics concept.
Based on these findings, several future paths of research are opened up. Firstly, present study supports a hypothesis that girls may perform on geometry better than boys. So this result encourages us to investigate what factors could possibly be strong predictor of girls’ knowledge of geometry which makes them perform better than boys. Secondly, however, such studies will require larger database regarding the information needed to capture the characteristics of the areas in which the students are resident. This kind of data would enable us to investigate which geographical location or environment can have an impact on student’s educational outcomes and what standard
demographic characteristics such as gender, ethnicity, and family background could possibly be strong predictor of mathematics ability. In this respect, it is important to develop new ways to assess the impact of mathematical education on the young.
References
Ainara Gonzalez de San Roman & Sara de la Rica (2010). The Impact of Social norms and the Mother’s transmission of role attitudes.
Alspaugh, J. W. (1992). Socioeconomic measures and achievement: Urban vs. rural.
Rural Educator, 13, 2-7.
Alspaugh, J.W., & Harting, R.D. (1995). Transition effects of school grade-level organization on student achievement. Journal of Research and Development
in Education, 28, 145-149.
Beaton, A.E.; Mullis,I.V.; Martin,M.O.; Gonzales , E.J.; Kelly, D.L.; Smith, T.A. (1996). Mathematics achievement in the middle school years: IEA’s Third International Mathematics and Science Study. Boston: TIMSS International
study Center Boston College
Bock, R. D. (1997). A brief history of item response theory. Educational Measurement:
Issues and Practice, 16, 21-33.
Bock, R. D., & Aitkin, M. (1981). Marginal maximum likelihood estimation of item parameters: application of an EM algorithm. Psychometrika, 46, 443-459. Christina Stage (2000). Predicting Gender Differences in WORD Items:
A Comparison of Item Response Theory and Classical Test Theory.
Chrostowski, S. J., & Smith, T. A. (2000). TIMSS 1999 international mathematics report: Findings from IEA‘s Repeat of the Third International Mathematics and Science Study at the eighth grade. Chestnut Hill, MA: Boston College.
C. Howley, Research About Mathematics Achievement in the Rural Circumstance. (Athens, OH: Ohio University, Appalachian Collaborative Center for the Study of
Learning, Assessment, and Instruction in Mathematics, 2002), available at http://acclaim.coe.ohiou.edu/rc/rc_sub/pub/3_wp/CBH_WP1.pdf).
Coe, P., Howley, C. B., & Hughes, M. (1989a). The condition of rural education in Kentucky: A profile. Charleston, WV: Appalachia Educational
Laboratory. (ERIC Document Reproduction Service No. ED 319 579)
Coe, P., Howley, C. B., & Hughes, M. (1989b). The condition of rural education in Virginia: A profile. Charleston, WV: Appalachia Educational
Ercikan, K.; McCreith, T. and Lapointe, V. (2005). Factors associated with
mathematics achievement and participation in advanced mathematics courses: An examination of gender differences from an international perspective. School
Science and Mathematics v105 n1 p5.
Edington, E.D. (1981). ACT scores of incoming freshmen to New Mexico State University by high school size. (ERIC Document Reproduction Service No.
ED 272354).
E. Bouck, How Size and Setting Impact Education in Rural Schools. Rural Educator,
vol. 25, no.3 (2004): 38-42.
Fierros, E.G. (1999). Examining Gender Differences in Mathematics Achievement on the Third International Mathematics and Science Study (TIMSS).
Gila Hanna & Toronto (2000). Declining Gender Difference from FIMS to TIMSS. Guiso, L., Monte, F., Sapienza, P. & Zingales, L. (2008). Culture, Gender and Math.
Science, 320(5880): 1164-1165.
Haller, E. J., Monk, D. H., & Tien, L.T. (1993). Small schools and higher order thinking skills. Journal of Research in Rural Education,
Johnson, R. M. (2000). Gender Differences in Mathematics Performance: Walberg’s
Educational Productivity Model and the NELS: 88 Database.
J.Serrita Jane, Thomas F.Oltmanns & Susan C. South, Eric Turkheimer (2007).
Journal of Abnormal Psychology, Vol. 116, No. 1, 106-175
Khattri, N., Riley, K. W., & Kane, M. B. (1997). Students at risk in poor, rural areas: Journal of Research in Rural Education, 13, 79-100.
Lawless, J. (2009). Advantages and Disadvantages of Attending Rural and Urban Middle Schools.
Linden, W. J., & Hambleton, R. K. (Eds.) (1997). Handbook of modern item response theory. New York, NY: Springer-Verlag.
Mellenbergh, G.J. (1994). A unidimensional latent trait model for continuous item responses. Multivariate Behavioral Research, 29, 223-236.
Mullis, I. V. S., Martin, M.O., Fierros, E.G., Goldberg, A. L., & Stemler, S. E. (2000). Gender differences in achievement: IEA’s Third International Mathematics and Science Study (TIMSS). Chestnut Hill, MA: Boston College.