國
立
交
通
大
學
管理科學系碩士班
碩
士
論
文
探討品牌權益與服務失敗歸因之交互作用對於顧客
滿意度的影響
The Interactive Effects between Brand Equity and
Firm’s Controllability over a Service Failure on
Customer Satisfaction
研 究 生:施慧妤
指導教授:張家齊 博士
探討品牌權益與服務失敗歸因之交互作用對於顧客
滿意度的影響
The Interactive Effects between Brand Equity and
Firm’s Controllability over a Service Failure on
Customer Satisfaction
研 究 生: 施慧妤 Student: Hui-Yu Shih
指導教授: 張家齊 博士 Advisor: Dr. Chia-Chi Chang
國 立 交 通 大 學 管 理 科 學 系
碩 士 論 文
A Thesis
Submitted to Department of Management Science College of Management
National Chiao Tung University in Partial Fulfillment of the Requirements
for the Degree of Master
in
Management Science
June 2008
Hsinchu, Taiwan, Republic of China
探討品牌權益與服務失敗歸因之交互作用對於顧客滿意度的影響
學生: 施慧妤 指導教授: 張家齊 博士國立交通大學管理科學系碩士班
中文摘要
本篇論文主要是在研究品牌權益與服務失敗歸因之交互作用對顧客滿意度的影 響。本篇作者檢視兩種對立的假設,一個是愛是盲目的效果,另一個是由愛生恨效果。 過去文獻指出高品牌權益公司代表顧客有大量的品牌知識和許多容易取得且正面的品 牌連結,此時當消費者將服務失敗歸因為公司不可控制時,會強化消費者對高品牌權益 公司的同化謬誤,產生愛是盲目效果,為公司創造了一個避免滿意度受創的緩衝機制; 反言之,一旦消費者認知到服務失敗是公司可以高度控制時,則強化對比效果,消費者 會擴大對產品表現和預期之間的差異,由愛生恨,高品牌權益的消費者變得更不滿意。 本研究結果暗示公司除了引導顧客瞭解發生服務失敗的原因,讓顧客瞭解在某些特定情 況下,公司只有有限的失敗控制能力,展現公司有進行預防失敗的努力;另外,管理者 必須重視公司的品牌權益,則發生低度控制的失敗時,對公司產生有利的緩衝機制。 關鍵字:品牌權益、服務失敗歸因、負面情緒The Interactive Effects between Brand Equity and Firm’s Controllability over a
Service Failure on Customer Satisfaction
Student: Hui-Yu Shih Advisor: Dr. Chia-Chi Chang
Department of Management Science
National Chiao Tung University
Abstract
This study investigates the effects of brand equity on customer satisfaction after
service failures. We posit that the effects of brand equity are contingent upon the attributions
customers make about the firm’s controllability over a service failure. Two competing
hypotheses are examined and reconciled. The “love is blind” hypothesis posits that when low
controllability is inferred, the satisfaction reduction after a service failure (compared to
satisfaction before a service failure) will be smaller for high-equity brand than for low-equity
brand. On the other hand, the “love becomes hate” hypothesis specifies that when high
controllability is inferred, the satisfaction reduction after a service failure will be stronger for
high-equity brand than for low-equity brand. The hypotheses are tested with a scenario
methodology and this study conducted research in two service industries: hair salons and
restaurants.
Acknowledgement 這份論文可以順利完成,必須感謝很多人,首先,謝謝我的指導教授,張家齊博士, 對於論文細心、耐心的指導,老師對研究嚴謹的態度與對學術的熱忱,讓我獲益良多, 每個禮拜充滿歡笑與淚水的互動,為研究所生涯留下非常深刻的回憶。感謝我的家人, 阿嬷、爸媽、哥哥和家家,對我求學過程一路的支持和信任,給我最溫暖、最窩心的寵 愛,包容我的任性,讓我沒有後顧之憂的完成學業。 另外,感謝提供許多研究建議的學長姐們,特別要感謝佳誼學長的大力協助,在遇 到瓶頸的時候,不時提供相關文獻供我參考,給予非常多寶貴的意見;以及最特別的張 門五人小組,總是能讓我迴旋式笑開懷的瞇路柏源、培真小天才、大魔王艾芸和比我還 健忘的室友雅君,能和你們成為同門真的是很幸運的一件事,無數個挑燈夜戰的晚上, 你們的一路相隨、不離不棄、彼此打氣打鬧,因為你們,讓每個禮拜延長又加碼的六小 時Meeting 變成開心的事;因為你們的督促,才能讓我不斷向前、完成我的碩士論文。 還有,最感動的是許多管科 95 級同學們的陪伴,回想起這兩年,只要有人生日,大家 都會聚在一起唱歌玩樂喝酒,謝謝你們豐富我的研究生活,讓我在壓力下仍能非常快樂 地研究。最後,必須感謝每個曾經協助我完成碩士論文的人,陪我一路走來的最愛姊妹 們和很多很多好朋友的鼎力相助,由於大家好心地幫我填寫問卷,我才能順利完成論文。 這個彷彿過了半個世紀之久的研究所生涯,終於要劃下句點了,有很多不捨與感 謝,而這份感動將一直留在我心裡,也謝謝交大提供我一個很好的學習環境,才能成就 如今磨練後的我。 施慧妤 謹誌於 民國 97 年於新竹交大管科
Index
中文摘要...i
Abstract ...ii
Acknowledgement...iii
Table Index...vi
Figure Index ...vii
Chapter 1 Introduction ... 1
1.1 Research Background ...1
1.2 Research Motivation...2
1.3 Research Objectives ...3
1.4 Literature Structure ...4
Chapter 2 Literature Review... 5
2.1. Brand equity...5
2.2 Two rival explanations: “Love is blind” versus “Love becomes hate”...8
2.2.1 Love is blind ...8
2.2.2 Love becomes hate ...9
2.3 Firm’s controllability over failure... 11
2.4 Negative emotions...13 2.5 Satisfaction Reduction...14 2.6 Patronage Reduction ...15 2.7 Hypotheses...16 2.8 Research Framework ...19 Chapter 3 Methodology ... 21
3.1 Conceptual Research Framework...21
3.2 Experimental Design ...22 3.2.1 Experiment Procedure...22 3.2.2 Stimulus Development ...24 3.3 Measurements ...26 3.3.1 Brand Equity...26 3.3.2 Negative emotions...26 3.3.3 Satisfaction...27 3.3.4 Patronage Reduction ...27
3.3.5 Firm’s Controllability Over Failure...27
3.4 Data Collection and Analysis Methods ...28
3.5 Pretest ...28
Chapter 4 Research Analysis and Results ... 29
4.1 Background of Participants...29
4.3.1 Manipulation Check of brand equity...31
4.3.2 Manipulation Check of Controllability...32
4.4 Analysis of Results ...32
4.4.1 Service Industries ...32
4.4.2 Brand Equity with Firm’s Controllability over failure and Negative Emotions ...35
4.4.3 Brand Equity with Firm’s Controllability over failure and Satisfaction reduction ...42
4.4.4 Brand Equity with Firm’s Controllability over failure and Patronage Reduction ...49
Chapter 5 Discussion and Future Research ... 56
5.1 Discussion of Results ...56
5.1.1 The “Love is blind” effect...56
5.1.2 The “Love becomes hate” effect...56
5.2 Implications...57
5.3 Limitations ...59
5.4 Future Research...60
Reference ... 61
Appendix A Scenarios (Haircut)... 64
Appendix B Scenarios (Restaurant)... 68
Table Index
Table 1 Experimental design ...23
Table 2 Demographics of Participants...30
Table 3 Reliability Statistics ...31
Table 4 Manipulation Check of Brand Equity...32
Table 5 Manipulation Check of Controllability...32
Table 6 Tests of Between-Subjects Effects...33
Table 7 Tests of Between-Subjects Effects ...34
Table 8 Tests of Between-Subjects Effects ...35
Table 9 Descriptive Statistics (Hair salon)...36
Table 10 Tests of Between-Subjects Effects (Hair salon)...37
Table 11 Multiple Comparisons of Brand Equity and Controllability (LSD) ...38
Table 12 Descriptive Statistics (Restaurant) ...40
Table 13 Tests of Between-Subjects Effects (Restaurant) ...40
Table 14 Multiple Comparisons of Brand Equity and Controllability (LSD)...41
Table 15 Descriptive Statistics (Hair salon) ...43
Table 16 Tests of Brand Equity and Controllability (Hair salon)...44
Table 17 Multiple Comparisons of Brand Equity and Controllability (LSD)...45
Table 18 Descriptive Statistics (Restaurant) ...46
Table 19 Tests of Brand Equity and Controllability (Restaurant) ...47
Table 20 Multiple Comparisons (LSD)(Restaurant) ...48
Table 21 Descriptive Statistics (Hair salon)...50
Table 22 Tests of Between-Subjects Effects (Hair salon)...50
Table 23 Multiple Comparisons of Brand Equity and Controllability (LSD)...51
Table 24 Descriptive Statistics (Restaurant) ...53
Table 25 Tests of Between-Subjects Effects (Restaurant) ...53
Figure Index
Figure 1 Research Flow...4
Figure 2 Composition of Brand Equity ...6
Figure 3 Research Framework (1)...20
Figure 4 Research Framework (2)...20
Figure 5 Interactions between Brand Equity and Controllability (Hair salon)...39
Figure 6 Interactions between Brand Equity and Controllability (Restaurant) ...42
Figure 7 Interactions between Brand Equity and Controllability (Haircut) ...46
Figure 8 Interactions between Brand Equity and Controllability (Restaurant) ...49
Figure 9 Interactions between Brand Equity and Controllability (Haircut) ...52
Chapter 1 Introduction 1.1 Research Background
No one in the service industry can entirely escape failure (Fisk, Brown, & Bitner, 1993).
Although service firms try to offer a high level of quality in their activities, they are unlikely
to be able to eliminate all service failures (Miller et al. 2000; Lewis & Spyrakopoulos, 2001).
The very personal and intangible characteristics of service delivery frequently produces
situations in which customer needs are misjudged or mishandled, resulting in customer
dissatisfaction. Even well-respected and highly esteemed brands sometimes fail their
customers. Most of us have had the experience of purchasing a venerable brand, but
eventually finding that after-sales service is quite disappointing. When a failed brand
possesses high a priori equity, how customers react is a very important issue. We need to
examine the relationship between brand equity and consumer response to service failure.
Branding theory suggests that the benefit of positive associations enjoyed by a
high-equity brands predisposes favorable responses to it (Keller, 1998). Previous research has
stressed that high-equity brands are more profitable because customers shop more regularly,
spend more per visit (Wulf, Odekerken-Schroder, & Iacobucci, 2001) and are willing to pay a
premium on the products and services they buy (Dowling & Uncles, 1997). Brand equity
represents a key asset for service firms, but it also is at risk of a failed service experience.
of a high-equity brand. First, according to the disconfirmation paradigm (Richard L. Oliver,
1981), customers’ expectations serve as a salient reference point when evaluating the current
consumption experience. Therefore, as frustration is compounded by the high expectations
attached to brands of strong stature, consumers’ adverse reactions may escalate. Second, other
researchers have found that high brand equity provides an important buffer to service firms
when service failures occur, resulting in less dissatisfaction (Goodman, Fichman, Lerch, &
Snyder, 1995; Hess Jr, Ganesan, & Klein, 2003; Kelley & Davis, 1994).
Therefore, it is imperative that managers should carefully consider what conditions
might “soften the blow”, or may mitigate customers’ negative responses toward the failure of
a high-equity brand. This issue is at the center of this research.
1.2 Research Motivation
Service failures are the leading cause of customer switching behaviors (Keaveney, 1995).
For decades researchers have studied branding theory and service failures. Understanding
how brand equity affects customer responses to service failure is important because service
failures have the potential to switch loyal customers to “enemies”. The consequences are very
serious for a firm’s reputation and long-term profitability. Therefore, we focus on the effects
of brand equity upon customers’ negative emotions and satisfaction after service failures.
In addition, integrating the contributions of brand equity and the investigation into
about the causes of service failures (causal attributions) moderate the relationship between
brand equity and satisfaction. This is an issue that has not been sufficiently studied to date.
Finally, this study offers a framework that reconciles these two competing explanations:
the “love is blind” versus the “love becomes hate” effects.
1.3 Research Objectives
In view of the above, the research aims to find:
1. The differences of customer responses to service failures by high-equity brands and
low-equity brands.
2. Whether the role of causal attributions (controllability) would moderate the effect of
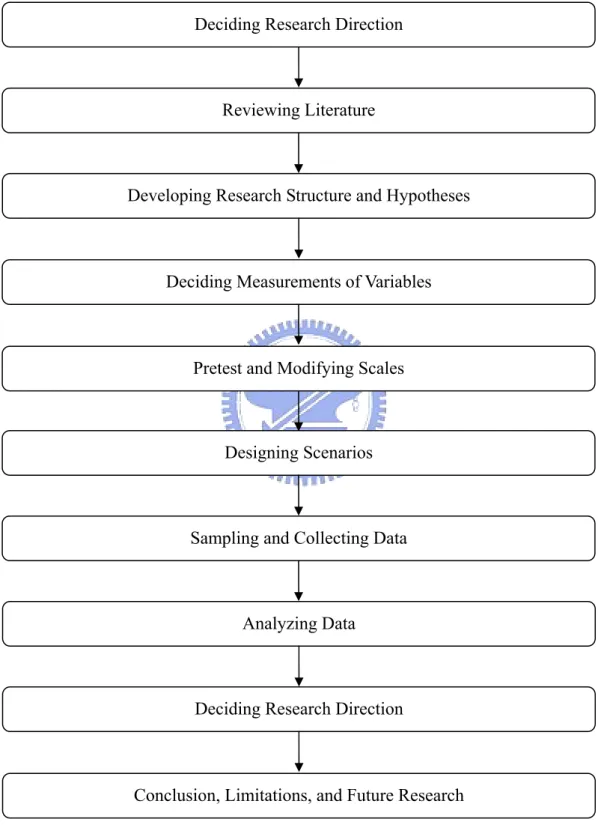
1.4 Literature Structure
This research includes five chapters, and the outline of each chapter is as follows:
Figure 1 Research Flow
Deciding Research Direction
Reviewing Literature
Developing Research Structure and Hypotheses
Deciding Measurements of Variables
Sampling and Collecting Data Pretest and Modifying Scales
Designing Scenarios
Analyzing Data
Deciding Research Direction
Chapter 2 Literature Review
This research posits that the effects of brand equity on customers’ responses depend on
the attributions customers make about a firm’s control over failures.
First, we need to know that when services or products fail, people tend to engage in
causal attributions (Weiner, 2000). Typically, causal attributions can result in three types of
blame: customers think it was the service firm's fault, they don't know exactly who to blame,
or they become aware that they are partly to blame (Laufer, David, & Mayer, 2005). If the
failure is perceived to be partly attributable to the customer, or if the service firm's ability to
control the failure is ambiguous, the negative effect is lessened. Conversely, if the firm is seen
as having had control over the failure but did not prevent it, then customer reactions are
highly negative (Sunmee C & Mattila, 2006). Attributions about controllability are important
in this research because they are thought to increase the customers’ negative emotions and
dissatisfaction toward a firm after service failures (Folkes, 1988).
2.1. Brand equity
After the term “Brand Equity” appeared in the 1980s, it became more and more popular
in marketing theory and practice. Aaker (1991) noted that brand equity is a set of brand assets
and liabilities linked to a brand, its name and symbol, which add to or subtract from the value
provided by a product or service to a firm and to that firm’s customers.
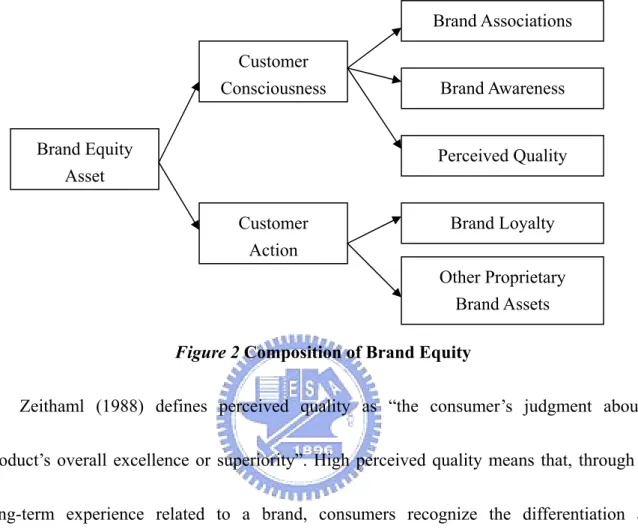
brand equity, including brand associations, brand awareness, perceived quality and loyalty
(Aaker, 1991). The concept of brand equity is shown in Figure 2.
Figure 2 Composition of Brand Equity
Zeithaml (1988) defines perceived quality as “the consumer’s judgment about a
product’s overall excellence or superiority”. High perceived quality means that, through the
long-term experience related to a brand, consumers recognize the differentiation and
superiority of the brand. They are confident that a brand is dependable and can be relied on to
serve them well. Therefore, high perceived quality would drive a consumer to choose a
particular brand rather than other, competing brands.
Brand loyalty makes consumers purchase a brand routinely and resist switching to
another brand. Loyal consumers show more favorable responses to a brand than non-loyal or
switching consumers do. They love to maintain their relationship with a firm.
Brand awareness can provide familiarity with a brand and a signal of substantiality and Brand Equity Asset Customer Consciousness Customer Action Brand Associations Brand Awareness Perceived Quality Brand Loyalty Other Proprietary Brand Assets
promise. If customers know the brand, they usually select familiar products when making
purchase decision.
Brand associations are complicated and connected to one another, and consist of multiple
ideas, episodes, instances and facts that establish a solid ground of brand knowledge. Brand
association can assist a customer to deal with or memorize information. The information
becomes the basis of product differentiation and product extension, and which will provide a
purchasing reason for customers, and give rise to positive feeling.
According to the literature, brand equity is a multidimensional concept. The appraisal of
brand equity can be assessed from the viewpoint of the manufacturer, distributor or customer.
This study focus on a “customer-based” conceptualization of brand equity to characterize
high-equity brands as those for which consumers have substantial knowledge structures that
often include associations that are both readily accessible and positive in valence (Aaker,
1991, 1996; Keller, 1993, 1998). By these criteria, Disney would constitute an example of a
brand with strong equity for many consumers, because favorable associations may be
available in long-term memory as a result of personal experience or exposure to heavy
advertising campaigns and other communications about the very prominent Disney brand.
Branding theory suggests that a cache of positive associations enjoyed by a high-equity brand
predisposes favorable responses to it (Keller, 1998).
access relatively few positive associations, may experience comparatively little change in the
wake of a performance failure. Knowing fairly little about a brand prior to interaction with it,
may suggest little in the way of performance expectations that could be mismatched by a
failure. Disappointment may thus be comparatively minimal, and evaluations of the brand
may change only negligibly as a result of the failed engagement.
2.2 Two rival explanations: “Love is blind” versus “Love becomes hate”
When customers are confronted with service failures of high-equity brands, two rival
explanations exist for the effects of brand equity on customers’ responses: the “love is blind”
versus the “love becomes hate” effect.
2.2.1 Love is blind
The “love is blind” effect argues that customers are more reluctant to hurt a valued
service partner or to terminate a meaningful relationship with high-equity brand (Lind & Tyler,
1988). These customers are more likely to forgive a service failure of a high-equity brand.
Hence, when the failed brand is a high-equity brand, the reduction of consumer satisfaction
will be smaller compared to that for a low-equity brand. It suggests that high-equity brands
provide an important buffer to service firms when service failures occur (Goodman et al.,
1995; Hess Jr et al., 2003; Kelley & Davis, 1994). This effect finds support in the literature on
assimilation bias (Herr, Sherman, & Fazio, 1983) and interpretation bias (Ahluwalia, 2000).
performance will be minimized or assimilated by the consumer adjusting his/her perception of
the product so as to be more consistent with the expectations. In an ambiguous situation, an
assimilation bias leads customers to overlook or underweigh information that is inconsistent
with their positive priors because of their strong connection and trust with the firm.
Consequently, customers of high-equity brands are less likely to feel unhappy by a service
failure. In order to maintain consistency between their positive priors and the current
perceptions of being involved in a service failure, customers may reduce the weight and the
spillover effects of the inconvenience occurred by high-equity brand. Because of these
cognitive biases, they are more likely to forgive a service failure by a high-equity brand.
In addition, customers of high-equity brands may feel reluctant to hurt a valued exchange
partner with whom they feel connected and whom they trust. For those customers, the
connections with high-equity brands are so important that they become reluctant to hurt the
firm because, by doing so, they create negative reflection of their self-esteem and how they
define themselves (Bhattacharya, Rao, & Glynn, 1995).
2.2.2 Love becomes hate
The “love becomes hate” effect posits that a high-equity brand’s favorable associations
lead customers to expect strong utilitarian benefits (Chandon, Wansink, & Laurent, 2000). A
failure by such a brand may engender particularly keen disappointment. When this occurs, a
performance disruption. This, in turn, may tarnish the consumer’s view of the formerly
admired brand. As such, a service failure by a high-equity brand represents a sharper contrast
with the customers’ expectations, and as result customers see a service failure as an act of
betrayal and result in more negative satisfactions and emotions (Robinson, 1996).
In this study, this explanation suggests that customers experience more dissatisfaction
from high-equity brand than low-equity brand in service failure contexts. This effect finds
support in the literatures on contrast effect (Herr et al., 1983). When expectations are not
matched by actual product performance, contrast theory suggests that the surprise effect or
contrast between expectations and outcome will cause the consumer to exaggerate the
difference between the what the product delivered and what was expected from the product,
i.e., if the objective performance of the product fails to meet a customer’s expectations, the
customer will evaluate the product less favorably than if he/she had no prior expectations of it.
Contrast is thus the opposite of assimilation. Since a high-equity brand’s favorable
associations lead customers to expect strong benefits, customers have higher expectations
about high-equity brand service than they believe they deserve. Being involved in a service
failure sharply contrasts with their expectations, and may result in more negative responses
(Brockner, Tyler, & Cooper-Schneider, 1992). A similar contrast effect has been observed in
the information processing literature, when individuals face extreme examples that conflict
In addition, customers of high-equity brands are more likely to feel betrayed than
customers of low-equity brands after service failure. Because of high-equity brand, customers
have more confidence in a firm, a service failure may generate feelings of broken trust and
will therefore be viewed as an act of betrayal (Robinson, 1996). A feeling of betrayal will lead
customers to be even more dissatisfied.
2.3 Firm’s controllability over failure
When services or products fail, people tend to engage in causal attribution (Weiner,
2000). Causal attribution theory suggests that consumers make inferences about the causes of
failure in the delivery of services (Heider 1958). These inferences have three dimensions
(Weiner 1985, 1986): locus of causality, stability and control. Locus of causality refers to
whether the consumer believes the cause of the service failure is related to the firm or to the
consumer. Stability is the extent to which a cause is viewed as temporary (expected to vary
over time), or predictable and permanent (expected to persist over time). Control attribution
involves the consumers’ belief about whether the firm could prevent a failure from occurring,
or alternatively it is the situation that forces the firm to follow a certain course of action.
Heider (1958) argued that consumers often use consistency principles to form attributions. An
excellent service organization should have less tolerance for stable failures. Thus, consumers
who have experienced excellent quality past service performance are less likely to make
less likely to attribute failures to stable causes, and they can be very beneficial for a firm
(Hess et al. 2003; Bagozzi et al. 2002). In this study the focus is restricted to control
attributions because they are thought to affect customer satisfaction toward a firm after
service failures (Folkes, 1984).
Control attribution deals with the perception that the firm could have controlled the
outcome (Hui, Tse, & Zhou, 2006; Weiner, 1985, 2000). If a failure is seen to be partly
attributable to a customer, or if a service firm's controllability over the failure is ambiguous,
the negative effect is lessened. Conversely, if a firm is seen as having had control over a
failure but did not prevent it, then customer reactions tend to be highly negative (Sunmee C &
Mattila, 2006). Formally, the attributions of a firm’s controlling ability are defined as
customer assessment of the degree to which the firm had control over a service failure and can
be blamed for its occurrence (Folkes, 1984).
The greater the perception of past service quality, the more likely consumers will
attribute high levels of competence and effort to avoid service failures to the service
organization (Narayandas 1998). As Hess et al. (2003) find, when a service failure occurs in
the context of high-quality past service performance, consumers are likely to infer that the
organization is highly competent and had little control over the failure, which would
2.4 Negative emotions
The literature on consumer behavior (Folkes 1988; Oliver & DeSarbo 1988; Spreng et al.
1996; Oliver 1997) suggests that individuals’ emotional responses to a service failure are
influenced by their causal explanation for the failure and that causal attributions about the
problem imply negative affective reactions. Specifically, it is argued that consumers express
more negative emotions (e.g. anger) after a service failure when the firm has control over the
problem.
This attribution–emotion relationship is also consistent with Bagozzi et al. (1999)
contribution from Cognitive Appraisal Theory. These authors point out that “emotions arise in
response to appraisals one makes for something of relevance to one’s wellbeing” (p. 185). In other words, it is not the service failure that creates the emotions, but rather the evaluations
that individuals make about the causes of the problems in the service. Additionally, several
empirical studies from other research areas, such as customer satisfaction (Mattila & Wirtz
2000; Oliver et al. 1997) and perceived justice with service recovery (Schoefer & Ennew
2005; Chebat & Slusarczyk 2005), provide support for the argument that cognitive elements
explain individuals’ emotions.
Therefore, the sequence of events after a service failure would be as follows: first the
customer makes attributions about the control of the causes of the service failure; then, the
subsequently will have a negative effect on satisfaction. In this study, customer negative
emotions are the first dependent variable.
2.5 Satisfaction Reduction
Consumer satisfaction has been discussed for several decades since Cardozo (1965) first
brought it up, and has various definitions in the literature. From a consumer’s perspective,
satisfaction represents a pleasurable consumption experience. It can influence a consumer’s
attitude towards a product and his intention to repurchase (R. L. Oliver, 1980). From a firm’s
perspective, satisfaction considerably contributes to the increase of its profitability. Research
has supported the existence of a positive relationship between customer satisfaction and
financial performance (Anderson, Fornell, 1997).
Customer satisfaction could be characterized as an evaluative judgment, with an
evaluation being made between expectation and product or service performance, after a
purchase has been completed (R. L. Oliver, 1980). Expectancy-disconfirmation theory is one
of the most influential topics in customer satisfaction studies (Zwick, Pieters, & Baumgartner,
1995), and in which consumer satisfaction can be specified as a function of initial standard
judgment which is compared to the level of perceived performance (Westbrook & Oliver,
1991). Consumers are assumed to assess a product before actually purchasing it. If
performance exceeds expectation, a positive disconfirmation will be expected and people will
disconfirmation when performance does not meet their expectations (Zwick et al., 1995).
Cognitive dissonance theory suggests that individuals will adopt a dissonance reduction
strategy if they experience disconfirmation consumption (Tse & Wilton, 1988). People may
distort their cognition of how the service is performed and assimilate their judgments into
their initial expectations if they don’t want to admit the difference between expected and
actual experience (Anderson, 1973). When consumers experience dissonance after
consumption, they will align their assessments with their expectations.
Maxham & Netemeyer (2002) examined overall firm satisfaction as a customer’s
cumulative satisfaction after multiple experiences, transactions and encounters with a service
organization (Maxham & Netemeyer, 2002; Smith & Bolton, 1998). Since some customers
may view a service failure as a single specific experience which may result in slight
differences in overall firm satisfaction, this study examines two kinds of satisfaction
constructs: overall satisfaction before a service failure, and satisfaction after service failure.
The difference between the satisfaction based on the past experience and the consumer
satisfaction after service failure as satisfaction reduction is used, to see the effect of a single
service failure. This is the dependent variable in this study.
2.6 Patronage Reduction
Satisfaction literature strongly supports the idea that increased satisfaction with a service
same service provider (Harris, Grewal, Mohr, & Bernhardt, 2006). After service failure,
customers dissatisfaction and negative emotions should influence customers’ intentions and
behavior (Fishbein & Ajzen, 1975; Perugini & Bagozzi, 2001), such as the intent to
repurchase from the firm.
In this section, we examine complaint behavior examined in service failure literature
(Singh, 1988). i.e. patronage reduction. Customers can remove the benefits that their future
patronage would have generated. More specifically, patronage reduction is defined as a
customer’s efforts to reduce the frequency of his or her visits, spend less per visit, and to
frequent competitors more intensively (Wulf et al., 2001). Customer could decide to avoid a
firm because he or she does not want to repeat a negative experience.
2.7 Hypotheses
In this research, it is hypothesized that the “love is blind” versus the “love becomes hate”
effects are contingent upon the attributions made by customers about a firm’s ability to
control the service failure. Controllability attributions reflect the customers' beliefs that the
service firm could have prevented the failure (Folkes, 1984; Hamilton, 1980; Hess Jr et al.,
2003; Weiner, 2000). Attributions about a firm’s controllability are defined as customers’
judgments of the degree to which the firm had control over a service failure and can be
blamed for its occurrence (Folkes, 1984).
effect explains the influence of brand equity on customer responses to service failures.
Consistent with the logic supporting this effect, customers of high-equity brands, compared to
low-equity brands, experience smaller satisfaction reductions for two reasons. First, their
perceptions of high-equity brands bias the way they assimilate and interpret information
related to the service failure. For high-equity brands, customers overlook or reduce the effect
of the inconvenience associated with an uncontrollable service failure. Second, dissatisfaction
and negative images seem contrary to maintaining a strong and positive psychological
connection, especially when the service failure is beyond the control of the firm. In this
context, customers of high-equity brands experienced smaller satisfaction reductions for a
firm they trust and with which they strongly identify. In addition, when customers believe that
the firm did not have the ability to do anything, or when external forces caused the failure
(Folkes et al., 1987), their negative emotions are less intense (Folkes, 1984). Last, patronage
reduction is defined as a customer’s efforts to reduce the frequency of his or her visits, spend
less per visit, and to frequent competitors more intensively (Wulf et al., 2001). However,
when attributions of low controllability are made, customers of high-equity brand may feel
reluctant to hurt a valued exchange partner to whom they feel connected and in whom they
trusted. Then:
Hypothesis 1a: When customers attribute a service failure to a low controllable
than toward low-equity brands (i.e., “love is blind” effect).
Hypothesis 1b: When customers attribute a service failure to a low controllable
cause, their satisfaction reductions after a service failure (compared to satisfaction before a service failure) will be smaller for high-equity brands than for low-equity brands (i.e., “love is blind” effect).
Hypothesis 1c: When customers attribute a service failure to a low controllable
cause, their patronage reductions will be significantly smaller for high-equity brands than for low-equity brands (i.e., “love is blind” effect).
On the other hand, when customers infer that a firm had control over the service failure;
the “love becomes hate” effect explains the effect of service failures by high-equity brands.
Compared to low-equity brands, customers of high-equity brands experience greater
satisfaction reduction for two reasons. First, customers of high-equity brands have higher
expectations about the service they believe they deserve, and therefore a controllable service
failure more sharply contrasts with their expectations. In addition, they are more likely to feel
betrayed by the actions of a high-equity brand than low-equity brand (Robinson, 1996). Also,
controllable service failures are likely to be viewed as grounds for anger because a deliberate
act is a more significant breach of trust for customers who have a strong belief in and
connections with the firm. When customers believe that the firm had the ability to do but
Formally:
Hypothesis 2a: When customers attribute a service failure to a high controllable
cause, their negative emotions toward high-equity brands will be significantly stronger than toward low-equity brands (i.e., “love becomes hate” effect).
Hypothesis 2b: When customers attribute a service failure to a high controllable
cause, their satisfaction reductions after a service failure (compared to satisfaction before a service failure) will be greater for high-equity brands than for low-equity brands (i.e., “love becomes hate” effect).
Hypothesis 2c: When customers attribute a service failure to a high controllable
cause, their patronage reductions will be significantly greater for high-equity brands than for low-equity brands (i.e., “love becomes hate” effect).
2.8 Research Framework
The major focuses of this study is to identify (1) the contingency effect of a firm’s
controllability and (2) the interaction between brand equity and firm’s controllability. The
Figure 3 Research Framework (1)
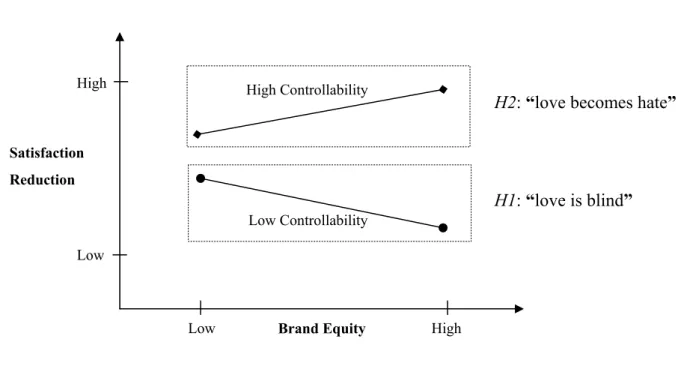
Depending on the attributions made about a firm’s controllability, this study posits that
customers experience a smaller or a greater reduction of satisfaction of high-equity brands
than do customers of low-equity brands. The two components of hypothesis 1 and 2 are
represented in Figure 4.
Figure 4 Research Framework (2)
Low Controllability High Controllability Satisfaction Reduction Low High
Low High Brand Equity
H1: “love is blind” H2: “love becomes hate”
Patronage Reduction Service
Failure Satisfaction Reduction
Negative emotions Firm’s Controllability over failure H1 H2 Brand Equity
Scenario design for service failure
Pre-test and modify Scales
Determine the sample size and analysis method
Execute the sampling process
Data collection
Design scenarios with the same service failure and different brand equity which combined with different firm’s
controllability.
Choose 10 participants for each scenario to make sure the efficiency of scenarios and scales.
Sample size would be 2 (brand equity: high and low) X 2 (firm’s controllability over failure: high and low). Participants of each cell are composed of nearly half male and half female.
Randomly assign each participant to a cell.
Collect 294 samples in two service industries.
Chapter 3 Methodology 3.1 Conceptual Research Framework
3.2 Experimental Design
This study set out to determine how the attributions customers make about a firm’s
control over failures influences the effects of brand equity on customers’ responses, when they
are confronted with service failures. To increase generalizability, this study conducted
research in two service industries: hair salons and restaurants. Hair salons and restaurants
were ideal for the study because both are commonly used by and familiar to a wide range of
consumers, which should provide a diverse group of respondents who could meaningfully
complete the survey. In addition, both service industries maintain a strong presence in
high-equity brand contexts
Testing the model in these two services therefore should have implications for existing
theories and for managers of high-equity brands.
3.2.1 Experiment Procedure
This study constructed scenarios to manipulate the brand equity and firm’s controllability
over service failure across the two service industries with a completely randomized full
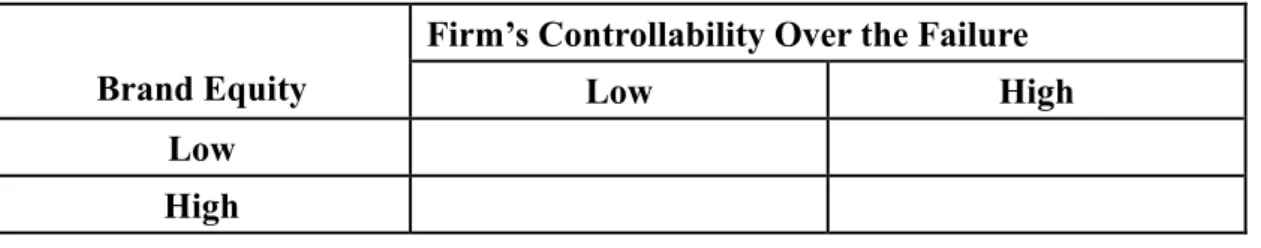
factorial design. The participants were randomly assigned to one of the four cells in a 2 × 2
(firm’s controllability over the failure: low or high × brand equity: high versus low)
Table 1 Experimental design
Firm’s Controllability Over the Failure
Brand Equity Low High Low
High
Low: partial blame to other customers or who to blame is unknown;
High: the firm is perceived to have had the ability to prevent the failure but did not.
Written scenarios were used to create the four experimental conditions in the two service
industries. A scenario methodology was chosen for the study, in which subjects were asked to
imagine themselves in the scenarios presented. Scenario methodology has been used in
previous studies of customer reaction to service failure. There is strong evidence that
individuals respond to an experimental scenario in the same manner as they would respond to
a similar, actual experience (Maxham & III, 2001).
Initially, respondents learned that they would participate in one study about the service
experiences. In the scenarios, participants were asked to recall an actual hair salon (restaurant)
where they received service before. In both service industries, participants were randomly
assigned to two brand equity conditions, to complete the brand equity scales and the customer
satisfaction scales depending on the quality of past experiences.
Respondents first read a short description of a firm. In the case of the hair salons,
respondents were told to imagine that they had already made an appointment to get their hair
cut. However, when they arrived on time, the respondents find out that they have to wait for
In the restaurant scenario, respondents were asked to imagine that they had already made
an appointment for dinner. Then the respondents subsequently learn that they have to wait for
35 minutes to become seated. Next, both groups of respondents read scenarios describing one
of two controllability manipulations. Last, respondents were asked to complete the customers’
satisfaction scales again after service failure in order to examine the intensity of their negative
emotions, and the degree of satisfaction reductions was analyzed. In addition, patronage
reduction was used to exam the customers’ response after service.
3.2.2 Stimulus Development
Manipulation of brand equity
To manipulate brand equity, the study selected some pictures for different brand equities.
There were three exclusive and luxurious hair salon pictures for a high-equity brand
manipulation and three pictures of university-affiliated haircut service for a low-equity brand
(Appendix A). In addition, this study provided a description about the service and the quality
of the hair salon corresponding to the pictures in order to induce customers to recall one hair
salon that he/she has been to (Appendix A). In this study, we used perceived quality, which is
one dimension of brand equity to do the manipulation check since it is the most obvious and
external concept to evaluate brand equity. Therefore, consistent with well-established
measures of brand equity (e.g., Aaker and Keller 1990; Smith and Park 1992), we considered
quality reflects a global brand evaluation (DelVecchio, Jarvis, Klink, & Dineen, 2007). For
the purpose of a manipulation check, participants were asked to report the name of the hair
salon he chooses and to complete the brand equity scale adapted from Yoo & Donthu (2001).
Examples included, “The likely quality of this hair salon is extremely high.” and “This hair
salon’s quality appears to be reliable.” (1 = “strongly disagree,” 7 = “strongly agree”). Results
supported the high- and low-equity brands’ intuitive designations. In addition, the pictures and
description that represents high equity was rated significantly higher on the brand-equity scale
than the low-equity hair salon brand. The results of the manipulation will be reported in
Chapter 4.
Manipulation of a firm’s controllability over failure
A service failure scenario was designed to stimulate participaants into an unsatisfactory
service experience due to an unnecessarily long wait. The respondents were randomly
assigned to two scenarios about the firm’s controllability over failure.
To manipulate the controllability variable, we depicted in two scenarios. Both scenarios
were that customers had to wait 35 minutes for their hair cuts even if they had already made
an appointment three days previously (occurrence of service failure). However, in a firm’s
high controllability over failure situation, the reason for making the customers wait was that
the salon forgot to make the appointment. In a low controllability scenario, failure happened
firm’s controllability over failure depends on how the participants attribute the service failure.
This study used the scale of attributions about the firm’s controllability developed by
Maxham and Netemeyer (2002). (e.g. “The service failure was entirely the organization’s
fault.”, on a scale from 1 = strongly disagree, to 7 = strongly agree)
3.3 Measurements
3.3.1 Brand Equity
The Scale of Brand equity adapted from Yoo & Donthu (2001) was used to check the
effect of the brand equity manipulation. It measures perceived quality of high- and low-equity
hair salon brands. The 7-point Likert scale was chosen. Seven points represents “strongly
agree”, and one point represents “strongly disagree.
Scale Items:
1. The likely service quality of this hair salon is extremely high. 2. The skill of hair stylist in this hair salon is extremely high. 3. The quality of this hair salon appears to be reliable.
3.3.2 Negative emotions
Respondents assessed the degree to which they would feel anger, shock, irritation
(Richins, 1997), regret, and betrayal. This scale has a reliability alpha of 0.883.
Scale Items:
1. I would feel very angry. 2. I would feel regret. 3. I would feel betrayed. 4. I would feel shocked. 5. I would feel irritated.
3.3.3 Satisfaction
The 7-points Likert scale was chosen. Seven points represents “strongly agree”, and one
point represents “strongly disagree. Following prior research we modified the words to fit this
study, and measured customer satisfaction after the service recovery on a three-item scale
(adapted from Maxham Ⅲ & Netemeyer (2002).
Scale Items:
1. On the whole, I am/was very satisfied with my experience with this/that service. 2. In general, I am/was happy with the service experience.
3. Overall, my positive experience outweighs/outweighed my negative experience with this/that service.
3.3.4 Patronage Reduction
Patronage Reduction was measured by a four-item, seven-point scale which was
used by Wulf et al.(2001).
Scale Items:
1. I spent less money at this business. 2. I stopped doing business with this firm.
3. I reduced frequency of interaction with the firm. 4. I took a significant part of my business to a competitor.
3.3.5 Firm’s Controllability Over Failure
Attributions about the firm’s controllability were measured with a three-item scale
developed by Maxham and Netemeyer (2002). This scale was based on semantic differential
items.
Scale Items:
1. This hair salon was entirely responsible for the problem that I experienced. 2. The problem that I encountered was solely this hair salon's fault.
3.4 Data Collection and Analysis Methods
First, an Independent-Sample T Test was employed to determine if brand equity (high vs.
low) and firm’s controllability over failure have significant differences under stimulus
manipulation. Then, ANOVA was used to determine the firm’s controllability over failure on
the effect of brand equity on the decline of satisfaction, and thus understand the influence of
moderator.
3.5 Pretest
A pilot study was conducted to test the validity and reliability of the questionnaire.
Researchers use this method to discover problems or misunderstandings in the design of the
experiment and then modify it before the official study. After our questionnaires failed and
were modified four times, the fifth edition of pilot study was successful.
The pretest was made by giving forty participants the experimental questionnaires,
telling them the research purpose was concerned with consumer behavior. There were twenty
male and twenty female participants. Twenty-two of the forty participants were students. The
reliability of customer satisfaction scales was 0.891, the reliability of the negative emotions
scales was 0.968, and the reliability of the patronage reduction scales was 0.924. All
reliabilities of scales were higher than 0.7. In addition, there was significant difference
between high-equity brand and low-equity brand (p<0.00). The difference between high and
Chapter 4 Research Analysis and Results
This chapter contains the analysis and the results of this study, including the background
of respondents, manipulation checks, reliability and validity of the results. A 2 (brand equity)
× 2 (firm’s controllability over failure) between-subjects experiment was conducted. Also, this
study conducted research in two service industries (hair salon and restaurant) to determine the
generalizability of our model. The type of service didn’t affect any dependent variables as we
expected. In other words, there was no significant difference between the service types.
However, since the scenarios are different in two service industries, this study discussed the
results separately, which has been used in previous studies of customer reaction to service
failure (DeWitt & Brady, 2003; Gremler & Gwinner, 2000 ). Therefore, this study first gave
the results of haircut scenario and then the results of restaurant scenario. Data analysis
techniques such as ANOVA, multi-comparison, and Independent-Sample T Test were
employed to test the hypotheses. The study used SPSS 12.0 to analyze the data.
4.1 Background of Participants
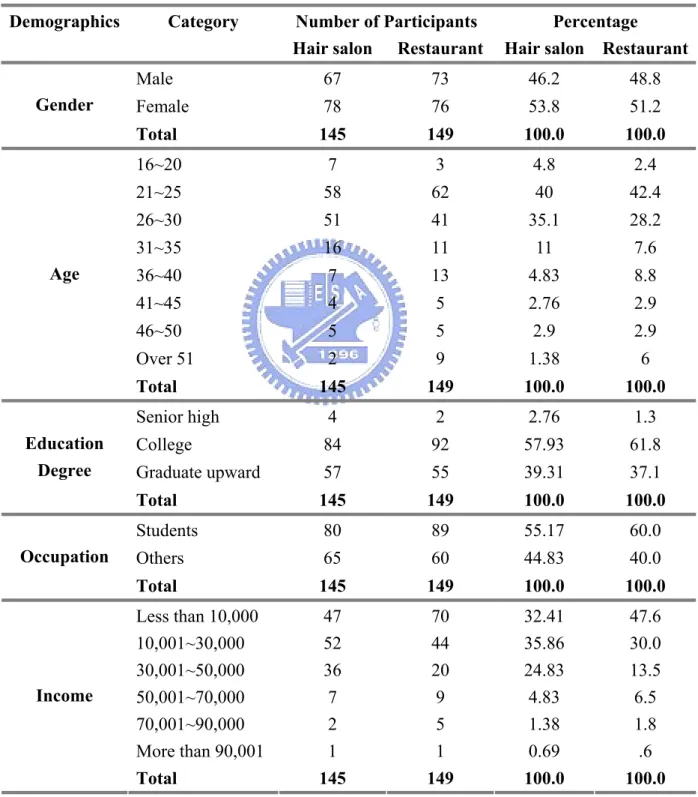
In the haircut scenario, from the total sample of 145 participants, 55.17% were students,
53.8% were female, 40% were between 21 and 25 years old, 57.93% have college degree,
39.31% have a graduate or higher degree, 35.86% have incomes between NT10,000 to
NT30,000.
51.2% were female, 42.4% were between 21and 25 years old, 61.8% have college degree,
37.1% have a graduate or higher degree, 47.6% have income less than NT10,000. The
demographics of all respondents are listed in Table 2.
Table 2 Demographics of Participants
Demographics Category Number of Participants Percentage Hair salon Restaurant Hair salon Restaurant
Male 67 73 46.2 48.8 Female 78 76 53.8 51.2 Gender Total 145 149 100.0 100.0 16~20 7 3 4.8 2.4 21~25 58 62 40 42.4 26~30 51 41 35.1 28.2 31~35 16 11 11 7.6 36~40 7 13 4.83 8.8 41~45 4 5 2.76 2.9 46~50 5 5 2.9 2.9 Over 51 2 9 1.38 6 Age Total 145 149 100.0 100.0 Senior high 4 2 2.76 1.3 College 84 92 57.93 61.8 Graduate upward 57 55 39.31 37.1 Education Degree Total 145 149 100.0 100.0 Students 80 89 55.17 60.0 Others 65 60 44.83 40.0 Occupation Total 145 149 100.0 100.0 Less than 10,000 47 70 32.41 47.6 10,001~30,000 52 44 35.86 30.0 30,001~50,000 36 20 24.83 13.5 50,001~70,000 7 9 4.83 6.5 70,001~90,000 2 5 1.38 1.8 More than 90,001 1 1 0.69 .6 Income Total 145 149 100.0 100.0
4.2 Reliabilities
In both service industries, the reliabilities of all constructs in this research were tested
with Cronbach’s alpha. Table 3 shows that reliabilities are all above 7 across all factors,
which indicate the high internal consistency of each item of the same factor.
Table 3 Reliability Statistics
Factors Cronbach's Alpha N of Items
Hair salon Restaurant
Brand equity .937 .946 3
Controllability .938 .940 3
Satisfaction .895 .927 3
Satisfaction after failure .924 .938 3
Negative emotions .883 .936 5
Patronage Reduction .918 .952 4
4.3 Manipulation Check
4.3.1 Manipulation Check of brand equity
In the haircut scenario, there were 73 participants in the high-equity brand and 72 in the
second group, with the low-equity brand. An Independent-Sample T Test was conducted to
investigate the differences of brand equity between the two groups. It is shown that the brand
equity of low-equity brand is significant lower than high-equity brand (t-statisitcs = -8.336, p
Table 4 Manipulation Check of Brand Equity
Brand Equity N Mean Std. Deviation T Sig.(2-tailed)
Low 72 4.0926 1.03797 Hair salon High 73 5.5525 1.07039 -8.336 .000* Low 72 3.7725 .99498 Restaurant High 77 6.0863 .76316 -17.011 .000*
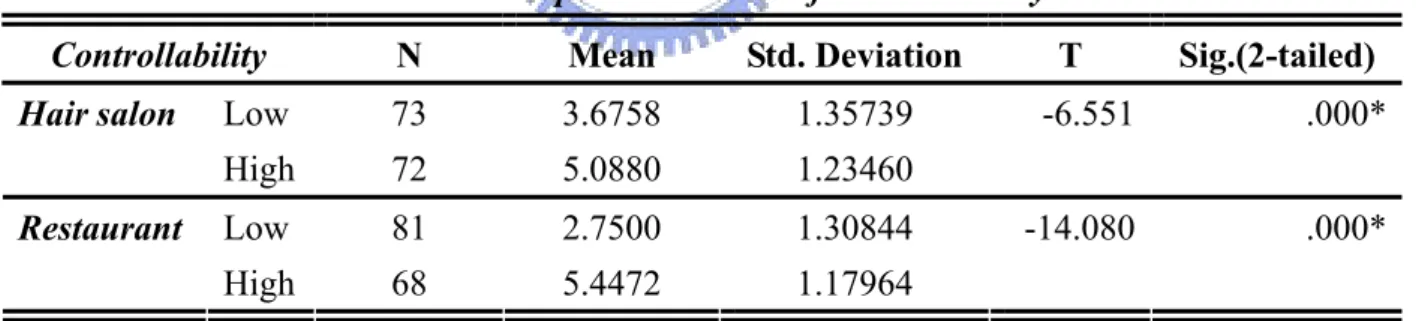
4.3.2 Manipulation Check of Controllability
There were 73 participants in the low controllability group, and 72 in the high
controllability group. An Independent-Sample T Test was conducted to investigate the
difference of brand equity between the two groups. It was shown that the brand equity of low
controllability is significantly lower than for high controllability (t-statisitcs = -6.551, p <
0.000). The results are showed in Table 5.
Table 5 Manipulation Check of Controllability
Controllability N Mean Std. Deviation T Sig.(2-tailed)
Low 73 3.6758 1.35739 Hair salon High 72 5.0880 1.23460 -6.551 .000* Low 81 2.7500 1.30844 Restaurant High 68 5.4472 1.17964 -14.080 .000* 4.4 Analysis of Results
After confirming all manipulation checks and the reliability of the scales, ANOVA was
applied to test the hypotheses.
4.4.1 Service Industries
was no significant difference between the service industries (p>0.05). See as Tables 6, 7 and 8.
However, since the scenarios in two service industries are different, this study discussed the
results separately, which has been used in previous studies of customer reaction to service
failure (DeWitt & Brady, 2003; Gremler & Gwinner, 2000 ).
Table 6 Tests of Between-Subjects Effects
Dependent Variable: negative emotions
Source
Type III Sum
of Squares df Mean Square F Sig. Corrected Model 258.068a 7 36.867 41.240 .000 Intercept 5472.628 1 5472.628 6121.723 .000 SI .143 1 .143 .160 .690 BE 1.376 1 1.376 1.539 .216 CON 203.763 1 203.763 227.931 .000 SI * BE .006 1 .006 .007 .935 SI * CON 13.027 1 13.027 14.572 .000 BE * CON 32.635 1 32.635 36.506 .000 SI * BE * CON .002 1 .002 .002 .965 Error 255.675 286 .894 Total 5891.480 294 Corrected Total 513.743 293 a. R Squared = .502 (Adjusted R Squared = .490)
Note: BE represents Brand Equity; CON represents Controllability; SI represents Service Industries.
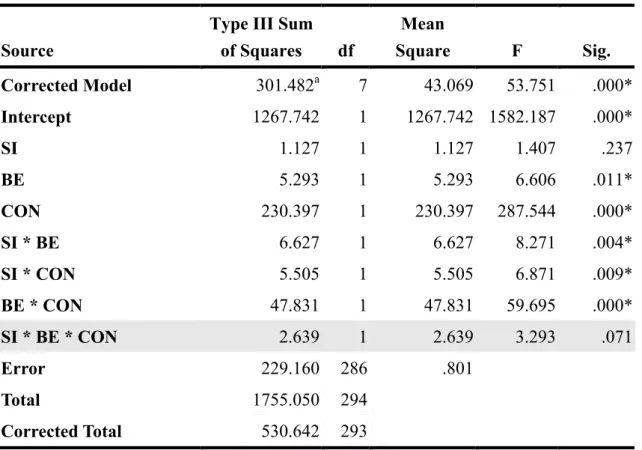
Table 7 Tests of Between-Subjects Effects Dependent Variable: Satisfaction Reduction
Source
Type III Sum of Squares df Mean Square F Sig. Corrected Model 301.482a 7 43.069 53.751 .000* Intercept 1267.742 1 1267.742 1582.187 .000* SI 1.127 1 1.127 1.407 .237 BE 5.293 1 5.293 6.606 .011* CON 230.397 1 230.397 287.544 .000* SI * BE 6.627 1 6.627 8.271 .004* SI * CON 5.505 1 5.505 6.871 .009* BE * CON 47.831 1 47.831 59.695 .000* SI * BE * CON 2.639 1 2.639 3.293 .071 Error 229.160 286 .801 Total 1755.050 294 Corrected Total 530.642 293 a. R Squared = .568 (Adjusted R Squared = .558)
Note: BE represents Brand Equity; CON represents Controllability; SI represents Service Industries.
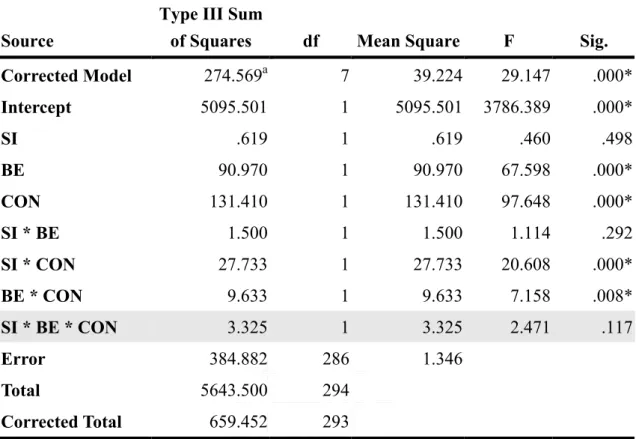
Table 8 Tests of Between-Subjects Effects
Dependent Variable: Patronage Reduction
Source
Type III Sum
of Squares df Mean Square F Sig. Corrected Model 274.569a 7 39.224 29.147 .000* Intercept 5095.501 1 5095.501 3786.389 .000* SI .619 1 .619 .460 .498 BE 90.970 1 90.970 67.598 .000* CON 131.410 1 131.410 97.648 .000* SI * BE 1.500 1 1.500 1.114 .292 SI * CON 27.733 1 27.733 20.608 .000* BE * CON 9.633 1 9.633 7.158 .008* SI * BE * CON 3.325 1 3.325 2.471 .117 Error 384.882 286 1.346 Total 5643.500 294 Corrected Total 659.452 293 a. R Squared = .416 (Adjusted R Squared = .402)
Note: BE represents Brand Equity; CON represents Controllability; SI represents Service Industries.
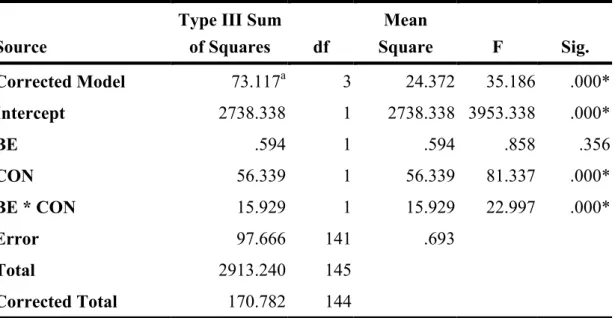
4.4.2 Brand Equity with Firm’s Controllability over failure and Negative Emotions
Hypothesis 1a indicated that when attributions of low controllability are made, customers
will experience weaker negative emotions with high-equity brands than with low-equity
brands. Hypothesis 2a speculated that when attributions of high controllability are made,
customers will experience stronger negative emotions with high-equity brands than with
low-equity brands.
contains the results of ANOVA and shows that a firm’s controllability could significantly
affect customers’ negative emotions (p <0.01). Further, the interaction between brand equity
and a firm’s controllability over failure is given in Table 10 (also see Figure 5). When
attributions of a firm’s low controllability over failure are made, there were significant
differences between high-equity and low-equity brands (p < 0.01); the same results happened
when attributions of a firm’s high controllability are made.
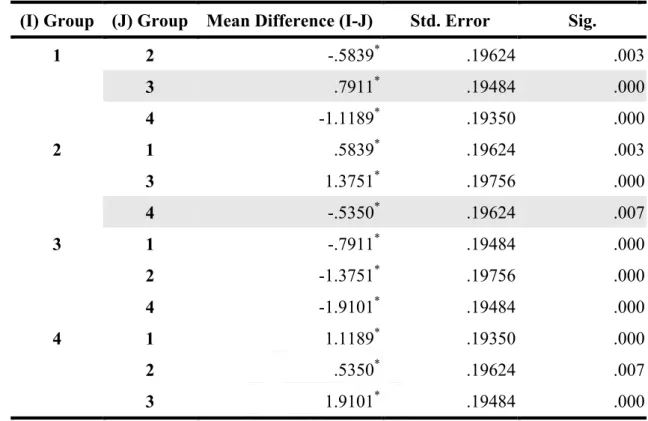
Table 11 shows that after a service failure, when attributions of low firm’s controllability
are made, customers’ negative emotions are significantly weaker with high-equity brands than
with low-equity brands. Hypothesis 1a is supported (p <0.05). It also confirms that when
attributions of a firm’s high controllability are made, customers’ negative emotions are
significantly stronger with high-equity brands than with low-equity brands. Hypothesis 2a
was supported (p <0.05). Both service industries support hypothesis 1a and hypothesis 2a.
‧ Hair salon
Table 9 Descriptive Statistics (Hair salon) Controllability
Low High
Mean (Std. Deviation) N Mean (Std. Deviation) N
Low-equity brand 4.12 (.699) 37 4.70 (.871) 35
Table 10 Tests of Between-Subjects Effects (Hair salon)
Dependent Variable: Negative Emotions
Source
Type III Sum of Squares df Mean Square F Sig. Corrected Model 73.117a 3 24.372 35.186 .000* Intercept 2738.338 1 2738.338 3953.338 .000* BE .594 1 .594 .858 .356 CON 56.339 1 56.339 81.337 .000* BE * CON 15.929 1 15.929 22.997 .000* Error 97.666 141 .693 Total 2913.240 145 Corrected Total 170.782 144 a. R Squared = .428 (Adjusted R Squared = .416)
Table 11 Multiple Comparisons of Brand Equity and Controllability (LSD)
Dependent Variable: Negative Emotions
(I) Group (J) Group Mean Difference (I-J) Std. Error Sig.
2 -.5839* .19624 .003 3 .7911* .19484 .000 1 4 -1.1189* .19350 .000 1 .5839* .19624 .003 3 1.3751* .19756 .000 2 4 -.5350* .19624 .007 1 -.7911* .19484 .000 2 -1.3751* .19756 .000 3 4 -1.9101* .19484 .000 1 1.1189* .19350 .000 2 .5350* .19624 .007 4 3 1.9101* .19484 .000
Based on observed means.
The error term is Mean Square (Error) = .693. *. The mean difference is significant at the 0.05 level. The mean difference is significant at the .05 level.
Note: 1 represents low brand equity and low controllability; 2 represents low brand equity and high controllability; 3 represents high brand equity and low controllability; and 4 represents high brand equity and high controllability.
Figure 5 Interactions between Brand Equity and Controllability (Hair salon)
5.24
4.70
4.12
‧ Restaurant
Table 12 Descriptive Statistics (Restaurant) Controllability
Low High
Mean (Std. Deviation) N Mean (Std. Deviation) N
Low-equity brand 3.67 (1.294) 39 5.08 (.995) 33
High-equity brand 2.85 (1.073) 42 5.61 (.673) 35
Table 13 Tests of Between-Subjects Effects (Restaurant)
Dependent Variable: Negative emotions
Source
Type III Sum
of Squares df Mean Square F Sig. Corrected Model 183.464a 3 61.155 56.120 .000* Intercept 2734.396 1 2734.396 2509.267 .000* BE .790 1 .790 .725 .396 CON 161.450 1 161.450 148.157 .000* BE * CON 16.716 1 16.716 15.339 .000* Error 158.009 145 1.090 Total 2978.240 149 Corrected Total 341.473 148 a. R Squared = .537 (Adjusted R Squared = .528)
Table 14 Multiple Comparisons of Brand Equity and Controllability (LSD)
Dependent Variable: Negative emotions
(I) Group (J) Group Mean Difference (I-J) Std. Error Sig.
2 -1.4182* .24691 .000 3 .8190* .23214 .001 1 4 -1.9448* .24306 .000 1 1.4182* .24691 .000 3 2.2372* .24283 .000 2 4 -.5266* .25329 .039 1 -.8190* .23214 .001 2 -2.2372* .24283 .000 3 4 -2.7638* .23892 .000 1 1.9448* .24306 .000 2 .5266* .25329 .039 4 3 2.7638* .23892 .000
Based on observed means.
The error term is Mean Square (Error) = 1.090. *. The mean difference is significant at the .05 level.
Note: 1 represents low brand equity and low controllability; 2 represents low brand equity and high controllability; 3 represents high brand equity and low controllability; and 4 represents high brand equity and high controllability.
Figure 6 Interactions between Brand Equity and Controllability (Restaurant) 4.4.3 Brand Equity with Firm’s Controllability over failure and Satisfaction reduction
This part of the project attempts to establish whether there is an interactive effect
between brand equity and firm’s controllability over failure on the satisfaction reduction.
Hypothesis 1b speculated that when attributions of low controllability are made,
customers will experience smaller satisfaction reductions with high-equity brands than with
low-equity brands (i.e. the “love is blind” effect). Hypothesis 2b showed that when
attributions of high controllability are made, customers will experience greater satisfaction
reductions with high-equity brands than with low-equity brands (i.e. the “love becomes hate”
effect).
Table 15 shows the descriptive statistics of brand equity and controllability. Table 16
5.08
3.67
5.61
shows the results of ANOVA and that firm’s controllability could significantly affect the
reduction of customers’ satisfaction (p <0.01). Table 16 also shows the interaction between
brand equity and firm’s controllability over failure (see Figure 7 also). When attributions of
low controllability are made, there were significant differences in the reduction of satisfaction
between high-equity and low-equity brands (p < 0.01); the same results were obtained when
attributions of high firm’s controllability over failure were made (p < 0.01).
Table 17 shows that after a service failure, when attributions of low firm’s controllability
are made, the reduction of customers’ satisfaction is significantly lower with high-equity
brands than with low-equity brands. Hypothesis 1b was supported (p <0.05). It also confirms
that when attributions of high firm’s controllability over failure are made, the reduction of
customers’ satisfaction is significantly higher with high-equity brands than with low-equity
brands. Hypothesis 2b was supported (p <0.05). Both service industries support hypothesis 1b
and hypothesis 2b.
‧ Haircut
Table 15 Descriptive Statistics (Hair salon) Controllability
Low High
Mean (Std. Deviation) N Mean (Std. Deviation) N
Low-equity brand 1.59 (.609) 37 2.48 (1.291) 35
Table 16 Tests of Brand Equity and Controllability (Hair salon)
Dependent Variable: Satisfaction Reduction
Source
Type III Sum of Squares df Mean Square F Sig. Corrected Model 95.880a 3 31.960 39.016 .000* Intercept 591.095 1 591.095 721.584 .000* BE .036 1 .036 .044 .834 CON 81.531 1 81.531 99.530 .000* BE * CON 13.860 1 13.860 16.920 .000* Error 115.502 141 .819 Total 803.444 145 Corrected Total 211.382 144 a. R Squared = .454 (Adjusted R Squared = .442)
Table 17 Multiple Comparisons of Brand Equity and Controllability (LSD)
Dependent Variable: Satisfaction Reduction
(I) Group (J) Group Mean Difference (I-J) Std. Error Sig.
2 -.8816* .21341 .000 3 .6502* .21188 .003 1 4 -1.4685* .21043 .000 1 .8816* .21341 .000 3 1.5317* .21485 .000 2 4 -.5869* .21341 .007 1 -.6502* .21188 .003 2 -1.5317* .21485 .000 3 4 -2.1186* .21188 .000 1 1.4685* .21043 .000 2 .5869* .21341 .007 4 3 2.1186* .21188 .000
Based on observed means.
The error term is Mean Square (Error) = .819. *. The mean difference is significant at the 0.05 level.
Note: 1 represents low brand equity and low controllability; 2 represents low brand equity and high controllability; 3 represents high brand equity and low controllability; and 4 represents high brand equity and high controllability.
Figure 7 Interactions between Brand Equity and Controllability (Haircut)
‧ Restaurant
Table 18 Descriptive Statistics (Restaurant) Controllability
Low High
Mean (Std. Deviation) N Mean (Std. Deviation) N
Low-equity brand 1.33 (.831) 39 2.38 (1.077) 33 High-equity brand 0.90 (.542) 42 3.95 (1.061) 35 1.59 0.94 2.48 3.06
Table 19 Tests of Brand Equity and Controllability (Restaurant)
Dependent Variable: Satisfaction Reduction
Source
Type III Sum
of Squares df Mean Square F Sig. Corrected Model 205.445a 3 68.482 87.351 .000* Intercept 678.688 1 678.688 865.691 .000* BE 11.997 1 11.997 15.302 .000* CON 155.039 1 155.039 197.758 .000* BE * CON 36.819 1 36.819 46.964 .000* Error 113.678 145 .784 Total 951.667 149 Corrected Total 319.123 148 a. R Squared = .644 (Adjusted R Squared = .636)
Table 20 Multiple Comparisons (LSD)(Restaurant)
Dependent Variable: Satisfaction Reduction
(I) Group (J) Group Mean Difference (I-J) Std. Error Sig.
2 -1.0505* .20943 .000 3 .4286* .19690 .031 1 4 -2.6190* .20616 .000 1 1.0505* .20943 .000 3 1.4791* .20597 .000 2 4 -1.5685* .21484 .000 1 -.4286* .19690 .031 2 -1.4791* .20597 .000 3 4 -3.0476* .20265 .000 1 2.6190* .20616 .000 2 1.5685* .21484 .000 4 3 3.0476* .20265 .000
Based on observed means.
The error term is Mean Square (Error) = .784. *. The mean difference is significant at the .05 level.
Note: 1 represents low brand equity and low controllability; 2 represents low brand equity and high controllability; 3 represents high brand equity and low controllability; and 4 represents high brand equity and high controllability.