Department of Business Administration
I-Shou University
Master Thesis
Research on the relationship between self-assessment
and job satisfaction In work Place For staff of tax
department Phu Nhuan district - Ho Chi Minh City
Advisor: Wen-Huei Yang, Ph.D.
Co-advisor: Ho Sy Tan, Ph.D.
Graduate Student: TuanAnh Pham
ACKNOWLEDGEMENTS
My thesis can’t finish if I don’t have the precious and enthusiastic guidance of two teachers: Dr. Wen-Huei Yang of I-Shou University in Taiwan and Dr. Ho Sy Tan of Electric Power University in Vietnam. I am very grateful for enthusiastic guidance, encouragement, mobilization of my teachers during my thesis guidance time.
I would be grateful to all teachers, professors, tutors, staffs of postgraduate training program linking between I-Shou University in Taiwan and Hong Bang International University in Vietnam.
My sincerely thanks to leaders of Ho Chi Min City Tax Department, leaders, officials, staffs of Phu Nhuan District Tax Branch. I sincerely thank to my colleagues supporting in data collection for this thesis.
Many thanks to my family members, parents, wife and children who always encourage me in learning process, especially my wife is always thoughtful caring, mobilization in order that I finish these course and thesis.
Sincerely thank you to HCM MBA Class 2 for helping me during 2 years study at the school.
ABSTRACT
Research purpose is to survey relationship between self-assessment and working satisfaction. Over the years, in Vietnam, people less focus on researching meticulously importance of self- assessment and its affect on working attitudes. Therefore, research samples are officials, staffs who are working at Phu Nhuan District Tax Branch, Ho Chi Minh City to survey, find out personal characteristics can make a big difference from self- assessment and job satisfaction in working or not, and the self-assessment significantly effects on working satisfaction or not.
The Samples are surveyed by questionnaires on total of 215 officials and staffs who are working at Phu Nhuan District Tax Department and other branch of Ho Chi Minh City Tax Department. The collected data in questionnaires is analyzed by SPSS software version 19.0. Three important hypotheses are tested by statistical methods such as descriptive statistic, reliability analysis, T-test, Pearson correlation analysis and regression analysis.
The research results show that both personal characteristics, such as education qualification and job position, significantly make a difference to self-assessment, and personal characteristics make no difference to job satisfaction. Besides, self-assessment significantly affects on working satisfaction. Research conclusions and recommendations are also mentioned for further research as a reference source.
Keywords: Personal characteristics, self-assessment, working satisfaction.
TABLE OF CONTENTS
ACKNOWLEDGEMENTS ... i
ABSTRACT ... ii
TABLE OF CONTENTS ... iii
LIST OF FIGURES ... viii
LIST OF TABLES ... x
CHAPTER 1 INTRODUCTION ... 1
1.1 BACKGROUND ... 1
1.2 THE PURPOSE OF THIS RESEARCH ... 2
1.3 SCOPE OF THIS RESEARCH ... 2
1.4 SIGNIFICANCE OF THIS RESEARCH... 2
1.5 STRUCTURE OF THIS RESEARCH ... 3
CHAPTER 2 LITERATURE REVIEW ... 4
2.1 INTRODUCTION OVERVIEW OF TAX DEPARTMENT PHU NHUAN DISTRICT, HO CHI MINH CITY ... 4
2.1.1 Management Organization structures ... 4
2.1.2 Duties and function... 5
2.2 A RESEARCH REVIEW IN TERMS OF SELF-ASSESSMENT ... 9
2.2.1 The definition of self-assessment ... 9
2.2.2 Literature review in terms of self-assessment ... 11
2.2.3 Measurement of Self-assessment ... 14
2.3 Job satisfaction ... 16
2.3.1 The definition of job satisfaction ... 16
2.3.2 A research review in terms of job satisfaction ... 18
2.3.3 Measurement of job satisfaction... 23
2.3.4 Factors that affect job satisfaction ... 24
2.4 THE RELATIONSHIP BETWEEN SELF-ASSESSMENT AND JOB SATISFACTION... 26
CHAPTER 3 RESEARCH METHODOLOGY ... 27
3.2 RESEARCH SUBJECTS ... 28
3.3 RESEARCH TOOLS ... 29
3.3.1 The measurement Scale of self assessment ... 29
3.3.2 The measurement Scale of Job satisfaction ... 30
3.3.3 The measurement Scale of Personal characteristics ... 30
3.3.4 Data collecting procedures ... 30 3.4.DATA ANALYSIS ... 31 3.4.1 Descriptive Statistics ... 31 3.4.2 Reliability analysis ... 31 3.4.3 T-test analysis ... 32 3.4.4 Regression Analysis ... 33
CHAPTER 4 RESEARCH RESULTS ... 34
4.1 DEMOGRAPHIC FACTOR ... 34
4.2 REDEFINE DEMOGRAPHIC FACTOR’S GROUPS ... 36
4.2.1 Gender information ... 37 4.2.2 Age ... 38 4.2.3 Education ... 39 4.2.4 Experience ... 40 4.2.5 Working position ... 41 4.2.6 Working department: ... 42
4.3 ANALYZING THE RELIABILITY OF THE SELF-ASSESSMENT SCALE AND JOB SATISFATION SCALE ... 44
4.4 ANALYZING DIFFERENCES ... 44
4.4.1 Gender ... 45
4.4.2 Age ... 46
4.4.3 Education ... 47
4.4.4 Experience/Number of working years ... 49
4.4.5 Working/ Position ... 51
4.4.6 Working department ... 53
4.5 CORRELATION AND REGRESSION ANALYSIS ... 55
4.6 SUMMARY ... 57
CHAPTER 5 CONCLUSIONS AND SUGGETIONS ... 59
5.1 RESEARCH CONCLUSION ... 59
5.2 RESEARCH SUGGESTIONS AND PROPOSALS ... 62
5.2.1 Self-assessment ... 62
5.2.2 Job Satisfaction ... 64
5.3 LIMITATION AND SUGGESTIONS FOR FURTHER RESEARCH ... 70
REFERENCES ... 72
APPENDIX ... 76
Appendix 1: English Questionnaire ... 76
Appendix 2: Vietnamese Questionnaire ... 80
Appendix 3: Independent samples t-test ... 84
Gender ... 84
Age ... 85
Education ... 85
Experience/Number of working years ... 85
Working Position ... 86
Working department ... 86
LIST OF FIGURES
Figure. 1 Taxation department structure ... 5
Figure. 2 Maslow's hierarchy of needs ... 19
Figure. 3 Frederick Herzberg's two-factor theory ... 20
Figure. 4 Victor Vroom’s expectancy theory ... 21
Figure. 5 Clayton Alderfer‘s ERG theory ... 22
Figure. 6 Research process ... 27
Figure. 7 Gender ... 38
Figure. 8 Age ... 39
Figure. 9 Education ... 40
Figure.10 Experience ... 41
Figure. 11 Job title/Working position ... 42
Figure.12 Working department ... 43
Figure.13 Graph of gender difference comparison ... 46
Figure. 14 Graph of age difference comparison ... 47
Figure. 15 Graph of education difference comparison ... 49
Figure. 16 Graph of working experience difference comparison ... 51
Figure. 17 Graph of job title/working position difference comparison ... 53
Figure. 18 Graph of working deparment difference comparison ... 54
LIST OF TABLES
Table 1 The statistics describe the demographic factors-frequency analysis ... 35
Table 2 The statistics describe the demographic factors-mean analysis ... 36
Table 3 The statistics describe gender ... 37
Table 4 Age Statistics ... 38
Table 5 Education Statistics ... 39
Table 6 Experience Statistics ... 40
Table 7 Working position Statistics ... 41
Table 8 Working department Statistics ... 42
Table 9 Analyzing the reliability of the self-assessment scale ... 44
Table 10 Analyzing the reliability of the job satisfaction scale ... 44
Table 11 T – Test gender ... 45
Table 12 T – Test Age ... 47
Table 13 T – Test Eduction ... 48
Table 14 T – Test Experience/Number of working years ... 50
Table 15 T – Test Postition ... 52
Table 16 T – Test Department ... 54
Table 17 : Mean self-assesment and satisffaction ... 55
Table 18 : Pearson correlation between the two variables ... 56
Table 19 : Regression analysis ... 56
Table 20 : ANOVA ... 56
Table 21 The statistical parameters of each variable in regression function ... 57
Table 22 : Summarize the research results ... 60
CHAPTER 1 INTRODUCTION
1.1.BACKGROUND
Vietnam is a developing country, oriented economic – social development. The vision to 2020, Vietnam aims to become an industrialized country. During that development process, one of priority fields will be focused investment is human resources, a key role in promoting the development and bring civilized, modern image of developed nation. This is an opportunity but also a challenge to the management of human resources in Vietnam. Finding the way to manage human resource to achieve the highest efficiency in the organization's activities has important meaning for the development of the organization in particular and the country in general.
People are the key to success. Maximize the human factor as the subject, key resource and goals for sustainable development; satisfy more complete about physical and spiritual needs of all people classes; prosperous nation building; independence economic building and proactive international integration for the country's sustainable development.
Human resource management is a particularly important field, because "every administrator is ultimately concerned with people". Indeed, Human resource Management is one of the basic functions of the management process, because people are always the most important element of an organization. Therefore, selection, arrangement, retain and attract qualified human consistent with the positions in the organizational structure is the first task of the managers.
The purpose of this thesis: Research on the relationship between self assessment and job satisfaction in work place for staff at Tax department Phu Nhuan district , Ho Chi Minh City.
1.2 THE PURPOSE OF THIS RESEARCH
The purpose is to research the impact of individual characteristics that affect self assessment and job satisfaction in work place of employees, verifying hypotheses about the relationship between the self assessment and job satisfaction in work place of the Tax department in Ho Chi Minh City and Phu Nhuan district in order to find out the nature of this relationship. Thereby, it is help managers in coordinating and assigning work reasonably and efficiently.
1.3.SCOPE OF THIS RESEARCH
This research conducted on 215 workers and employees in the Tax Department in Ho Chi Minh City and Phu Nhuan District.
This research only focused on the relationship between self assessment and job satisfaction in work place. Check to see: whether individual characteristics have made a significant difference to the self assessment; whether personal characteristics have made a significant difference in job satisfaction in work place; whether self assessment has a significant positive impact in job satisfaction in work place.
1.4 SIGNIFICANCE OF THIS RESEARCH
This research has the following senses:
The research results will have an overview of the impact of individual characteristics to the self assessment and job satisfaction in the job in factors, different aspects, such as gender, age, educational background, work experience, work position and department.
This research helps us identify the scale that used to measure the self-assessment and job satisfaction in work place. Factors affecting job satisfaction of the staffs , the impact relationship between self assessment and job satisfaction at work place, from which the tax industry managers, tax authorities all levels will build for their organization appropriate policies to promote efficiency in the work of the officers and employees in their organization.
This is discovery research, as a basis for further research on the self-assessment, job satisfaction in work place of employee in general and officers, staffs in Tax Department Phu Nhuan District in particular.
1.5 STRUCTURE OF THIS RESEARCH
The study is divided into five chapters with contents as follows:
Chapter 1: Introduction
Chapter 2: Literature Review
Chapter 3: Research Methodology
Chapter 4: Research Results and Analysis
Chapter 5: Conclusions and Recommendations
CHAPTER 2 LITERATURE REVIEW
This chapter will present an overview about Tax department Phu Nhuan district and the theory of self-assessment, job satisfaction in work place, the relationship between self-assessment and job satisfaction in work place.
2.1 INTRODUCTION OVERVIEW OF TAX DEPARTMENT
PHU NHUAN DISTRICT, HO CHI MINH CITY
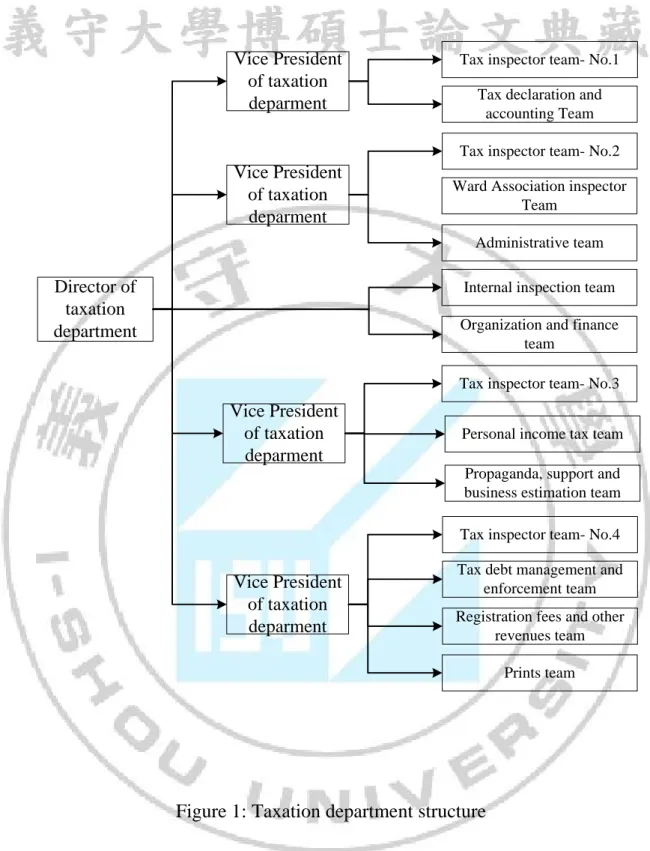
The department of taxation- Phu Nhuan is one of 24 ward taxation departments belonging to department of taxation- Ho Chi Minh City is a function as collection administrative agencies in order to mobilize the state budget revenues. According to the functions and duties of the taxation department and to do their assigned political tasks well, the taxation department organization- Phu Nhuan is formed, as below
2.1.1 Management Organization structures:
The structure and organization of the taxation department- Phu Nhuan has operated with 140 officials including: 01 department director, 4 vice directors, and 12 teams (number team average is 10-15 officials). With the organization structure, the taxation department- Phu Nhuan has operated well and flexibly that leads to a positive result in implementing the taxation political tasks.
Vice President of taxation deparment Vice President of taxation deparment Director of taxation department Director of taxation department Vice President of taxation deparment Vice President of taxation deparment Vice President of taxation deparment Vice President of taxation deparment
Tax inspector team- No.1 Tax inspector team- No.1
Tax declaration and accounting Team Tax declaration and
accounting Team
Tax inspector team- No.2 Tax inspector team- No.2
Ward Association inspector Team
Ward Association inspector Team
Administrative team Administrative team
Internal inspection team Internal inspection team
Organization and finance team
Organization and finance team
Tax inspector team- No.3 Tax inspector team- No.3
Tax inspector team- No.4 Tax inspector team- No.4
Tax debt management and enforcement team Tax debt management and
enforcement team Registration fees and other
revenues team Registration fees and other
revenues team Prints team Prints team Vice President of taxation deparment Vice President of taxation deparment
Personal income tax team Personal income tax team
Propaganda, support and business estimation team Propaganda, support and business estimation team
Figure 1: Taxation department structure
2.1.2 Duties and function
The taxation department –Phu Nhuan is organized following function model of taxation management laws and specific function tasks of each department. Director as a Chief Officer is responsible for directing and generally operating,
some vice directors who support to the director and operate the directed tasks according to assigning is called management board. To implement assigned tasks, taxation department also has some advisor team and direction implementation teams that organization structure is 12 teams. According to the general taxation
department decision No. 504/QĐ-TCT on 3/29/2010 [21] about functions, duties
of taxation team belonging to the taxation department and the management organization structure of taxation department director is functions and duties of each team as below:
1. Head of the department and a number of Deputy Head of the department.
The Head of the department is responsible to the Director Administration of Taxation and law for the entire operation of the Tax Office in the province.
Three Deputy Head of the department are responsible before the Head of the department and the law for the field work was assigned.
2. Team General - Business - Estimates - Propaganda – Support
As a team advising the Head of the department Tax Department conducted propaganda about tax policies and laws; assist taxpayers within management Tax ; building and implementing the budget revenue estimates assigned State of Tax Office.
Helping Director Tax Office guidance on tax administration operations, policy, tax law for officers and tax officials in the Tax Office; building and implementing the budget revenue estimates assigned State of Tax Office.
3. Declaring team - Tax accounting and information technology
Helping The Head Tax Office implementation of tax registration, tax return processing records, tax accountant, tax statistics as decentralized management; manage and operate the system informatics equipment; development, installation, manual and software applications serving the tax administration.
4. Tax inspection team
Helping the direction conducts the inspection and supervises tax declaration, solves the related denunciation of tax payers.
5. The debt management and tax debt enforcement
Helping the director implements tax debt administrations, collect enforcedly the owed tax, taxpayer fines under the tax department jurisdiction.
6. Management Team Administration - Human Resources - Finance - prints
Helping The Head Tax Office perform administrative workings, saving documents ; personnel management; financial management and administration; manage publications.
7. The tax administration and other receivables Prior registration
Helping the director manages the registration fees, fees of transferring land use rights, land use rights payments, land auction accounts, assets, land rents, asset taxes, charges, fees and other revenues (generally called as the land revenues including PIT for: transferring real estates, inheritances, gifts, registration fees and other revenues) arose in taxation department area.
8. The Management of the personal income tax
Helping the Head Tax Office perform the inspection, monitoring declare personal income tax; responsible for implementing revenue estimates of personal income tax under the jurisdiction of the Tax Office
9. The management of household and individual business tax
Helping the Head Tax Department tax collection management organizations (if any), taxpayers in communes, wards are assigned (including producers of commercial business and services, including households pay personal income tax, property tax, agricultural land use tax, royalties ...).
10. The Internal Audit
Helping The Head Tax Office conducted the inspection of compliance with the law, the integrity of the tax authorities and tax officers; resolving complaints (including complaint-handling decisions of tax authorities and tax claims related within the tax authorities and tax officers) and denunciations related to the execution of duties and security defend the integrity of the tax authorities and tax officers under the jurisdiction of The Head Tax Office.
With the above organization structure, excepting management board, the teams are divided into 2 departments:
- Indirect department: advise to help leaderships catching in time, accurating, completing information about status of task implementation and advise leaderships of solving some problem on laws. It includes: administrative- human resource- finance- Prints team, tax debt management and enforcement team, Tax declaration- accounting and computer science team, general- business- estimation- propaganda- support team, internal inspection team.
- Direct department: directly mining revenues, carrying out checking companies’ doubted in violation of tax law. It includes: inspection team, ward association team, personal income tax team, registration fees and other revenues team.
The organization structures are 12 teams, but in fact, taxation management is mainly 4 functions:
- Propaganda- Support
- Tax Declaration- Accounting.
- Debt management and enforcement.
- Checking observances of tax law.
2.2 A RESEARCH REVIEW IN TERMS OF
SELF-ASSESSMENT
2.2.1 The definition of self-assessment
A. The definition of assessment
Under usual Vietnamese definition, "assessment is aware of the value of a person or an animal clearly." With this content and meaning, so assessment is focused clarification the value of a person or an animal. From the perspective of psychology, assessment is "opinions, conclusions that drawn from the evidence, critics that have speculated about people and events."
There are many types of assessment such as employee assessment, results assessment, performance assessment, job assessment, differences assessment, program and impact of the program assessment, self-assessment..., therefore, can understand that the self-assessment is a form of assessment.
In summary, from the points of view above, assessment is value of a person, a phenomenon, a particular object.
B. The definition of self-assessment
In psychology, there are three main definition of self-assessment.
William James (1890) is an American psychologist and pioneering philosophy. He is a leader in “self-assessment as capacity” perspective. He said that :" The concept of self-assessment developed itself from social comparison. We compares himself with "important people" and used this information to develop our views. Thus, through their own experience, especially the influence of others that individuals found himself: Who am I? I will be like? They wish I was like? ..."
Morris Rosenberg (1965) is a professor of sociology at the Maryland University. He is a leader in “self-assessment as value” perspective.
Nathaniel Branden (1969), he is considered as the father of “self-assessment includes capacity and values“. According to him, the definition of self-assessment has two interrelated elements: a sense of self-made and a sense of personal value.
For the purposes and different fields of research, the different concepts from researchers were given in order to serve their research fields. We'll learn more about the concepts of self-assessment, which were given from researchers.
Dang Hoang Minh (2007) was given the understanding of the self-assessment process itself as individuals have the judgment and evaluation of myself, of the present, ability and his personality.
The definition stated by the psychologist, V.P. Levkovich (1973): "Self-assessment is an advanced stage of consciousness, it includes not only self-awareness but also appreciate the effort and ability properly, including the critical attitude for themselves".
In the dictionary of Vu Dung Psychology (2008): "Self-assessment is the value, meaning that individuals identify for themselves generally as well as the aspects of the personality, the operation and operating ".
In the scope of this research, we use self-assessment definition as follows: Self-assessment is opinions and attitudes of human with the capacity, ability, personality qualities and critical attitude to themselves.
2.2.2 Literature review in terms of self-assessment
When human were born, they are not aware of themselves as a separate individual and therefore, not really have the self-assessment. Gradually over the years they grew up, until the effects and interactions of people around them, they can aware of their existence. Through the process, human have self-assessment: physical, learning tasks, work, sports activities, relationships.
Although self-assessment is not have much research, but researchers also have high concern. Based on the different perspective, the researchers pointed out various features of the self-assessment.
A. The suitability attribute of Self-assessment
According to the perspective of some researchers, the internal elements in each individual are the foundation of self-assessment. Shower (1992) said that the consolidation between the positive and negative thoughts is the factors that affect self-assessment. Laurence Steinberg (1993) suggests that, for women, when reach puberty, body changes affecting their self-assessment. Self-assessment is an image of the actual objective assessment, is considered appropriate if that statement is accurate, close to actual assessment. Assessment must mention the accuracy or appropriateness of assessment. Therefore, the standard for considering the appropriateness of self-assessment is an objective reality.
According to several researchers notion, can be considered as the external-assessment are standards for self-external-assessment. However, external external-assessment must be consistent, like objective reality. Because the features of reflected activity are: Results of the reflected process can not be entirely true, diverse and wide as objective reality that is reflected. Charles Horton Cooley in 1902 (McIntyre 2006), said that the people themselves rose from the interaction between the individuals and awareness of others in social. As his opinion, self-assessment of each people about their value based on the assessment they think the other people think of them. Margaret Mead (1934) said that, people acquire ideas, attitudes of the important person they think to self-assessment.
However, it is unable to compared objective reality absolutely, just reach level nearly. Self-assessment correctly and accurately is an important sense and role for the development of personality. Assessment in general is a difficult task, self-assessment accurately more difficult.
People often face with many difficulties in self-assessment accurately due to many different reasons. In perspective of S.Franz(1982):”Personal self-assessment depends on the development awareness of each person. Awareness processes of each people is different, therefore, the level of awareness of things, phenomenon are also different. Standard assessment - the most important issue of self-assessment is very difficult to define a unified way. Standard assessment of each person depends on the society standard assessment through their subjective perception. In these groups, the different role of each person has its different standard. And different standard of group is also different. S. Franz emphasized, both external-assessment and self-assessment must ensure two conditions:
- The first one is, must be based on the standard assessment of the society.
- The Second is, assess statement, and in terms of content must be based on circumstances, a phenomenon to be evaluated only.”
B. The distinction and generalization attribute of Self-assessment.
If someone deduce arbitrarily about assessment from this reflecting scope to that reflecting scope, so that self-assessment is ungrounded.
If the reflecting ranges are different, the individuals can see the differences corresponding to the expression level of their qualities, so can be considered as self-assessment has the distinctive. In comparing self-assessment based on different activities and performance, self-assessment reflects the psychological phenomena or attitudes of different individuals respectively, so self-assessment has the distinctive.
Based on results in specific activities, people have overview or generalization about themselves, so self-assessment has the generalization.
C. The sustainability attribute of self-assessment
The sustainability attribute of self-assessment may change in accordance with age, can be identified in relation of different requirements in certain period, in relation of some different psychological characteristics. Leary and his colleagues (1995) suggest that self-assessment concern to the relationship status. Robins, Trzesniewski, Tracy, Gosling, and Potter (2001), self-assessment can be formed in a young age, but it continues to change and evolve throughout the life of human being. Brown and Mankowski (1993) said that a temporary change of spirit will make the equivalent changes in self-assessment. Kernis (1993): Self-assessment fluctuates around a sustainability line.
D. The degree of Self-assessment
Chris Mruk (2006) gave self-assessment chart and split the self-assessment into different categories: low assessment; high assessment; value-based self-assessment, competency-based self-assessment.
2.2.3 Measurement of Self-assessment
The self-assessment is measured and evaluated in multiple views and different ways. Previously, using the indirect method to measure the self-assessment, require the personal characteristics to perform the assessment. However, a direct method to measure self-assessment has been developed and proven to be very reliable and valuable. That is core self-evaluations Scale. Although some
researchers are still use personal characteristics to measure the self-assessment, using the direct method is still popular method up to now.
Up to now, there are many methods to measure self-assessment proposed by researchers:”Core self-evaluation (CSEs) by Judge, Erez, Bono, and Thoresen (2003); 12-item self-report measure of core self-evaluations (JH CSE) Judge and Hurst (2007)”.
The research used Core self-evaluation method (CSEs) by Judge, Erez, Bono, and Thoresen (2003) measures self-assessment by using 5 Likert scale from 1 "Completely disagree ", 2" disagree ", 3" Accept ", 4 " agree "t o 5" Completely agree ". A total of 12 questions, as follows (negative statements were scored reverse):
1. I believe I will achieve success in my life.
2. Sometimes I am feeling bored.
3. I am often success when I try.
4. When I failed I often feel myself worthless
5. I completed the task successfully.
6. Sometimes I feel I have no control over the work.
7. In general, I am satisfied with mysefl.
8. I doubt about my capacities.
9. I decide what will happen in my life.
10. I feel I cannot control the success of my career.
11. I have the ability to deal with almost my problems.
12. Sometimes, everything looks gloomy and hopeless to me.
2.3 Job satisfaction
2.3.1 The definition of job satisfaction
According to the usual perspective in Vietnam, "Job satisfaction is that workers meet their needs and desires when working".
Vroom (1964) said that, job satisfaction is a status in which the employee has a clearly work direction in the organization.
Weiss (1967) defines that, job satisfaction is an attitude about work that is represented by feelings, beliefs and behaviors of employees.
According to the usual perspective of Smith, Kendal and Hulin (1969), job satisfaction is satisfaction with components or aspects of the job, is the attitude of staff that influence and recorded on the various aspects of work (nature of work, training opportunities and advancement, leadership, co-workers, wages) of them.
Locke (1976) concept, job satisfaction is understood as workers really excited for their work.
According to Quinn and Staines perspective (1979), job satisfaction is a positive response to the work.
According to Kotler perspective (2001), the person feeling level originates in comparing the obtained results with the expectations.
In perspective of Dormann and Zapf (2001), job satisfaction is most interest attitude to leaders and leadership teams.
Kinicki and Kreitner (2006) showed that, job satisfaction defined in a simple way, it is reflect personal favorite at work.
Schemerhon 1993 (Luddy, 2005) defines that, job satisfaction as an emotional reaction and feelings towards different work aspects. The author give the reasons of job satisfaction include job position, the supervision of management, relationships with colleagues, work content, the incentives and rewards, including promotion, the physical conditions of the work environment and organizational structure.
In general, there are many definitions of job satisfaction, in many different angles with many definitions of job satisfaction. In this research, we used the definition of job satisfaction as the workers assessment on their attitudes to work. Reflected in two aspects:
Emotionally: job satisfaction reflects the degree of pleasure or happiness on job.
Awareness: job satisfaction include an assessment of the physical benefits, the level which the individual needs and desires met and felt the appreciation of other employees.
2.3.2 A research review in terms of job satisfaction
In the researches of job satisfaction, researchers often associated with theories of job encouragement and satisfaction. The following is a summary of the theory of job satisfaction.
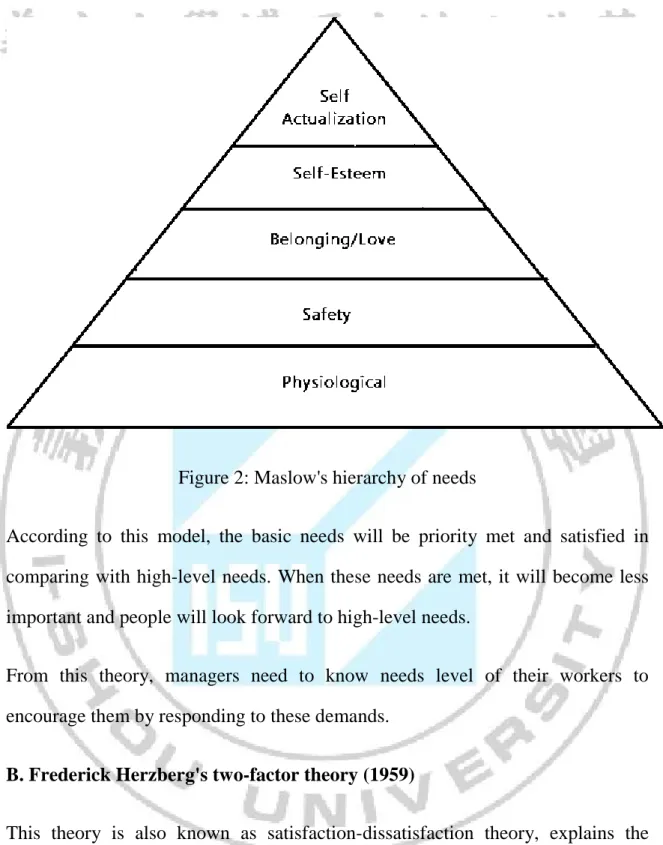
A. Abraham Maslow's Hierarchy of Needs (1943)
According to Maslow (1943), he suggested that having 2 main groups of human needs, which are basic needs and high-level needs.
Basic needs are factors related to human physiology such as food, water, sleep ... These needs are indispensable for humans, because without them, people would not survive, they will struggle to get and survive in everyday life.
The higher needs than basic needs is known as high-level needs, including a variety of spirit factors such as the justice demanding, assurance, fun, social status, self-respect, self-expression, Self-actualization... Group's basic needs are often have priority attention in comparing with higher demand. For someone, if they lack food, lack of drink ... they will not care about the needs of the beauty, respect…
According to him, two groups of human needs are classified into five levels according to a certain order from low to high, as follows:
Figure 2: Maslow's hierarchy of needs
According to this model, the basic needs will be priority met and satisfied in comparing with high-level needs. When these needs are met, it will become less important and people will look forward to high-level needs.
From this theory, managers need to know needs level of their workers to encourage them by responding to these demands.
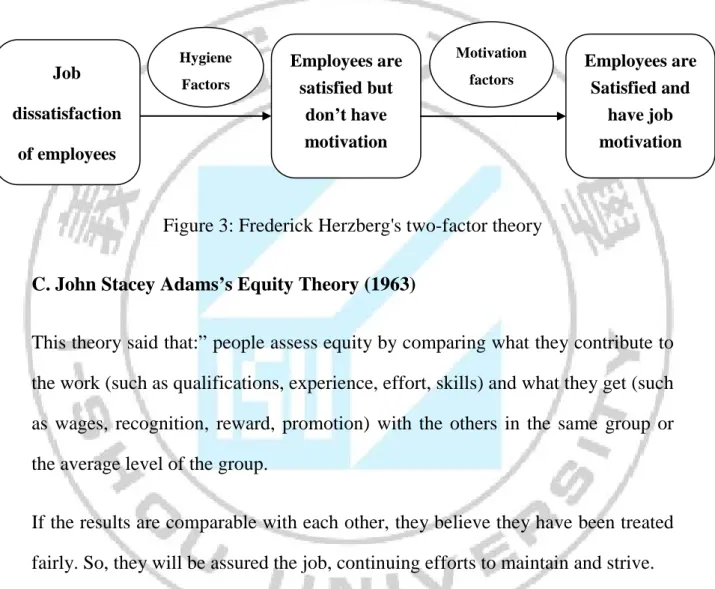
B. Frederick Herzberg's two-factor theory (1959)
This theory is also known as satisfaction-dissatisfaction theory, explains the factors leading to satisfaction, and dissatisfaction of employees at work. This theory is divided into two factors: hygiene factors and motivation factor. Hygiene factors including the level of supervision, company policies, working conditions, wages, safety, relationships with colleagues and superiors, personal life, the
assurance of job positions. Not satisfying these factors, employee will be dissatisfied. Motivation factor include recognition, achievement, advancement, development, signification and responsibility of the job. Satisfying these factors, employee will be satisfied
Figure 3: Frederick Herzberg's two-factor theory
C. John Stacey Adams’s Equity Theory (1963)
This theory said that:” people assess equity by comparing what they contribute to the work (such as qualifications, experience, effort, skills) and what they get (such as wages, recognition, reward, promotion) with the others in the same group or the average level of the group.
If the results are comparable with each other, they believe they have been treated fairly. So, they will be assured the job, continuing efforts to maintain and strive.
If the results are not comparable with each other, they believe they have not been treated fairly. Therefore, they will have a feeling of insecurity and stress at work. So they will take action: reducing their contributions to the work, reduced striving effort, reduced hours of working, resign”.
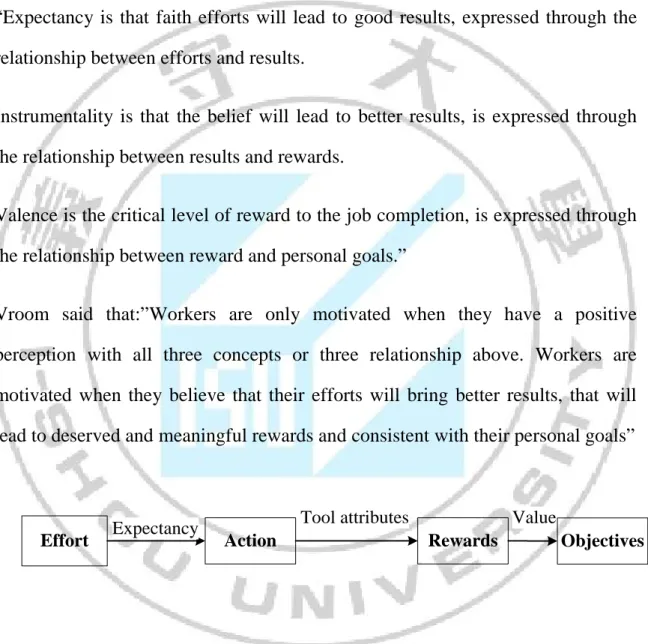
D. Victor Vroom’s expectancy theory (1964)
Job dissatisfaction of employees Employees are satisfied but don’t have motivation Employees are Satisfied and have job motivation Motivation factors Hygiene Factors 20
He said, the working engine of human is not determined by the reality, that it is determined by people's perceptions about their future. Unlike Maslow and Herzberg focused on human needs, Vroom is focused on results.
This theory relate to three basic concepts:
“Expectancy is that faith efforts will lead to good results, expressed through the relationship between efforts and results.
Instrumentality is that the belief will lead to better results, is expressed through the relationship between results and rewards.
Valence is the critical level of reward to the job completion, is expressed through the relationship between reward and personal goals.”
Vroom said that:”Workers are only motivated when they have a positive perception with all three concepts or three relationship above. Workers are motivated when they believe that their efforts will bring better results, that will lead to deserved and meaningful rewards and consistent with their personal goals”
Rewards
Rewards
Effort
Effort Expectancy ActionAction
Tool attributes
Objectives
Objectives
Value
Figure 4: Victor Vroom’s expectancy theory
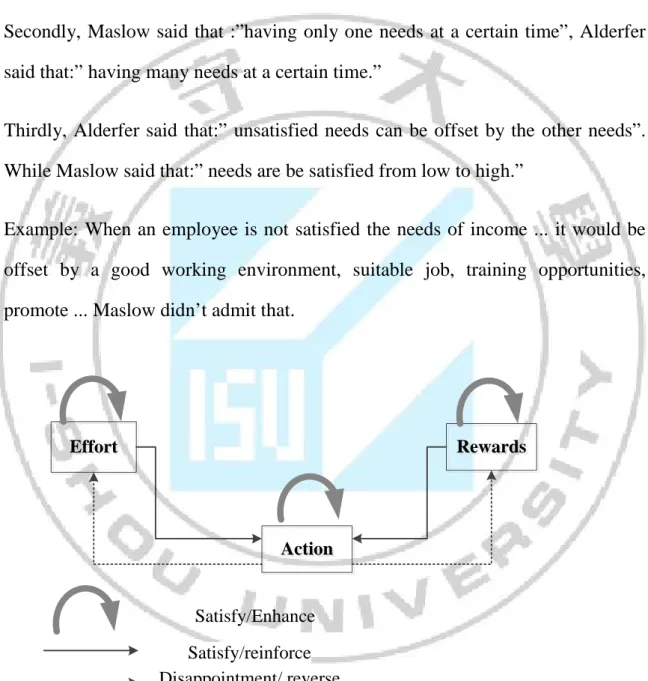
E. Clayton Alderfer‘s ERG theory (1969)
Generally, this theory is like Maslow's hierarchy of needs theory. However, there are some differences as follows:
Firstly, according to Maslow, have 5 needs of humans, but for this theory has 3 needs of humans. They are: Existence need, relatedness need and growth need.
Secondly, Maslow said that :”having only one needs at a certain time”, Alderfer said that:” having many needs at a certain time.”
Thirdly, Alderfer said that:” unsatisfied needs can be offset by the other needs”. While Maslow said that:” needs are be satisfied from low to high.”
Example: When an employee is not satisfied the needs of income ... it would be offset by a good working environment, suitable job, training opportunities, promote ... Maslow didn’t admit that.
Rewards Rewards Effort Effort Action Action Satisfy/reinforce Disappointment/ reverse Satisfy/Enhance
Figure 5: Clayton Alderfer‘s ERG theory
2.3.3 Measurement of job satisfaction.
Job satisfaction is the evaluation of workers on their work attitudes. This means that measuring work satisfaction of the employees is a complex composite of many separate work elements. Researchers around the world have submitted the valuable and widely using measurement tools.
JDI (Job Descriptive Index) by Smith, Kendal and Hulin (1969) from Cornell University devised to assess the level of job satisfaction. JDI Scale consists of 90 questions designed to measure the satisfaction of a factor through the nature of the job, salary, advancement and promotion opportunities, co-workers and the supervision of managers. The scale is simple, participants only answer yes, no, or cannot decide (indicated by symbol '?') to answer whether any statement describes their work accurately.
The survey of job satisfaction JSS (The Job Satisfaction Survey) was built by Paul E. Spector (1985, quoted by Best, 2000) to assess the attitude of employee about job aspects, JSS consists of 36 questions in nine distinct aspects of job satisfaction. Each aspect is assessed with four questions. These aspects include wages, promotion opportunities, benefits, supervision, management organization, colleague relationships, and the nature of work, recognition and responsibility. Each question is assessed from “completely disagree” to “completely agree”.
MSQ (Minnesota Satisfaction Questionnaire) by Weiss and his colleagues (1967) from the University of Minnesota. Three forms of MSQ were developed, two forms have 100-item (version 1977 and version 1967) and a remaining form has 20 short items. MSQ questionnaire designed to measure work satisfaction in each specific aspect.
BIAJS (Brief Index of Affective Job Satisfaction) by Thompson and Phua (2012) devised to measure the job satisfaction in jobs. Job satisfaction in emotional is pleasurable feeling level of individuals in general, other than Job satisfaction in awareness. Job satisfaction in awareness is the level of personal satisfaction with specific work aspects, such as wages, retirement preparation, hours of work, and other aspects. The reliability of consistency in the report ranged from .81 to .87. BIAJS using 5 Likert scale from 1 "completely disagree", 2 "Disagree", 3 "Accept", 4 "Agree", 5 "completely agree") with 04 questions, such as follows:
1. I find the real pleasure in my job.
2. I like my job better than others.
3. I am always enthusiastic in my job.
4. I feel quite satisfied with my job.
In this research, BIAJS scale is used to assess the job satisfaction of employees.
2.3.4 Factors that affect job satisfaction
According to Kreitner & Kinicki (2007) and Alam & Kamal (2006) said that there are five factors that lead to job satisfaction of employees.
The first factor is the response to needs. These needs do not only stop with the need of good job completion which must include the individual needs of employees and their families.
The second factor leading to job satisfaction is the level between the expectations of employees and what they receive. If the expectations are higher than they
received, they will feel frustrated. Conversely, if they get much higher than their expectations, it will lead to high satisfaction.
Personal awareness of the work value is the third factor that leads in job satisfaction. An employee will have the satisfaction if their work gives a critical personal value. To enhance employee satisfaction, managers need to develop a good working environment with treatment regimes and recognize their contributions.
Employees will compare their effort and their achievements with the other ‘effort and achievements around them. If they feel they were treated fairly, they will get satisfaction. Fairness is the fourth factor lead to job satisfaction of employees.
Genetic factors are considered the last factor leads to job satisfaction of employees. As if managers can impact to 4 factors above, for this factor, they can do that. In different people, even though having the same capacity and the same treatment, but due to different genetic or personality trait will lead to different levels of satisfaction.
In summary, each researcher will have different perspectives on factors that bring satisfaction of employees in their work. However, these theories also have some certain things in common. All researchers agree that, to have job satisfaction, the manager needs to satisfy certain needs of employees. Although Maslow and Alderfer have the difference opinion about group division and levels of needs, but these needs are similar. According to these researchers, these needs are living, eating, safety, make friends, respect and self-expression, etc. Herzberg give two factors are satisfaction and dissatisfaction but the ultimate goal is to satisfy the needs of the employees. Adam said that is the needs of treatment fairly of the
management to their employees. Vroom emphasis on the motivation of employees depends on their perception about effort, results that will lead to meaningful and consistent rewards.
2.4 THE RELATIONSHIP BETWEEN SELF-ASSESSMENT
AND JOB SATISFACTION
Judge and his colleague (1997, 1998) illustrate the direct link between self-assessment (CSE) and job satisfaction. Indeed, direct impact by Judge and his colleague (1997) has found that self-assessment (CSE) affects job satisfaction through a process of personal awareness using the thoughts and emotions. Cognitive processes can develop the positive experience for employees at work, in this way, maintaining the commitment and constraint of organizations. However, the relationship between self-assessment (CSE) and job satisfaction also has mediated impacts by job characteristics awareness (Judge et al, 1998, 2000). The relationship between self-assessment (CSE) and job satisfaction are well supported by previous research. Thus, the self-assessment (CSE) is said to have direct and positive relations with job satisfaction. However, on the basis of Judge and his colleagues (1998, 2000), also suggest that self-assessment (CSE) will indirectly related to job satisfaction through job characteristics awareness.
CHAPTER 3 RESEARCH
METHODOLOGY
Following two previous chapters, this chapter will introduce the research methodology consists of four sections as models and hypotheses, research subjects, research tools and data analysis.
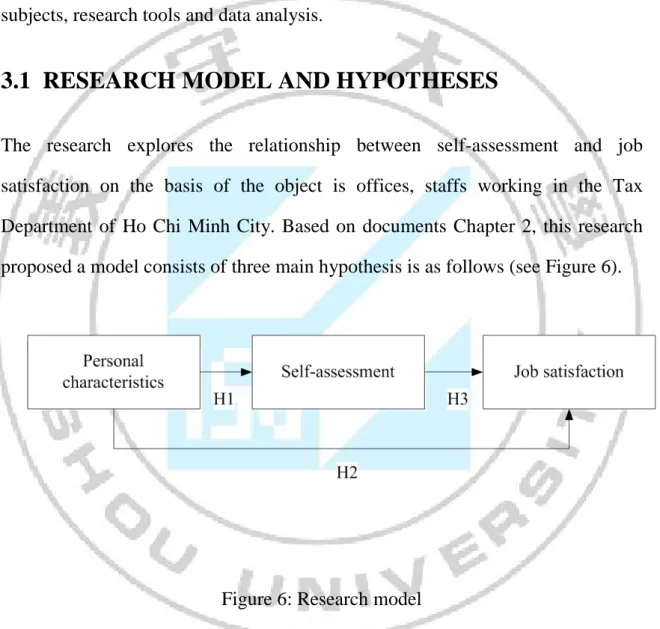
3.1 RESEARCH MODEL AND HYPOTHESES
The research explores the relationship between self-assessment and job satisfaction on the basis of the object is offices, staffs working in the Tax Department of Ho Chi Minh City. Based on documents Chapter 2, this research proposed a model consists of three main hypothesis is as follows (see Figure 6).
Figure 6: Research model
Hypothesis H1: personal characteristics make a difference to self-assessment.
1a: Gender makes a difference to self-assessment.
1b: Age make a difference to self-assessment.
1c: Education makes a difference to self-assessment.
1d: Work experience/working years make a difference to self-assessment.
1e: Position makes a difference to self-assessment.
1f: Division makes a difference to self-assessment.
Hypothesis H2: personal characteristics make a difference to job satisfaction.
2a: Gender makes a difference to job satisfaction.
2b: Age makes a difference to job satisfaction.
2c: Education makes a difference to job satisfaction.
2d: Work experience/working years make a difference to job satisfaction.
2e: Position makes a difference to job satisfaction.
2f: Working Section makes a difference to job satisfaction.
Hypothesis H3: The self-assessment has a significant positive impact to job satisfaction.
3.2 RESEARCH SUBJECTS
Staff working at the Tax Department in Ho Chi Minh City and Phu Nhuan district has been selected through the sampling survey by questionnaire and survey questionnaires were translation from English into Vietnamese. This is the Tax Department in Ho Chi Minh City under the Vietnam General Department of Taxation; the department allocated 24 Districts in the area. This research sampled
only from the officers and staffs working in the Tax Department of Ho Chi Minh
City. A total of 215 valid questionnaires were collected with a 100% rate
statistics.
Research Subjects include staff, employees in positions of management and not management, who are working in different specialized and personnel departments. Questionnaire survey of the research has been carried out and directly delivered to each subjects from June to October 2013.
3.3 RESEARCH TOOLS
On the basis of this research model is shown in Chart 3.1, three variables were examined, including personal characteristics, self-assessment and job satisfaction. The scales used to assess these three variables are described as follows.
3.3.1 The measurement Scale of self assessment
The self-assessment scale consists of 12 items by Judge, Erez, Bono, and Thoresen (2003) have been selected for evaluation in this research. The self-assessment described personal characteristics, related to the individual's subconscious, the basic assessment of their own, and the ability to control themselves.
5 level Likert scale was used to evaluate 12 questions in the self-assessment, score from 1 (completely disagree) to 5 (completely agree). Six questions 2, 4, 6, 8, 10, and 12 are scored reverse. The high scores or optimism for the self-assessment person will have positive thoughts and confident about their own abilities.
3.3.2 The measurement Scale of Job satisfaction
Brief Index of Affective Job Satisfaction (BIAJS) consists of 4 items by Thompson and Phua (2012) devised have been selected for evaluation in this research project. Brief Index of Affective Job Satisfaction (BIAJS) consists of 4 entries as how to evaluate the general feeling of job satisfaction on the current job. The reliability and consistency of Brief Index of Affective Job Satisfaction (BIAJS) consists of four items ranged from .81 to .87 (Thompson and Phua, 2012).
5 level Likert scale was used to assess four questions in the self-assessment, score from 1 (completely disagree) to 5 (completely agree). The high scores or optimism for the self-assessment person will have positive thoughts and satisfy with their job.
3.3.3 The measurement Scale of Personal characteristics
10 demographic factors were evaluated in order to collect information of personal characteristics such as gender, age, highest educational level, number of years on the current job, ministry name, working division / department, industry, location, industry, working time (full time / part time).
3.3.4 Data collecting procedures
Three scales on a set of a questionnaire to collect information and send it directly to the respondents, suggested recording time after completion. On the questionnaire, the author has shown a commitment to use the information for research purposes along with a commitment to confidentiality for respondents. To
achieve the objective, questionnaire information does not show the name of respondents.
After being introduced to the research objectives and methodology, questionnaire included three main categories: Self-assessment, job satisfaction and personal characteristics. Data collection is performed on all employees working at the headquarters of the Department of Taxation Ho Chi Minh City with the number of 215 questionnaires. Data collection was carried out from July to August 2014.
Once collecting 215 questionnaires, collected data are input into the computer and data processing SPSS software version 19.0 to statistics and analyze the data.
3.4 DATA ANALYSIS
The data collected were analyzed statistically using SPSS software version 19.0. To test the three main proposed hypotheses of this research, four different statistical methods were carried out to find out the results.
3.4.1 Descriptive Statistics
Descriptive statistics such as frequencies and percentages were used to collect a group of personal characteristics. And the average deviation is used to calculate different variables.
3.4.2 Reliability analysis
Cronbach's Alpha model is among of critical correlation method (also known as internal reliability assessment). General thoughts of this method are to find the absurdity of the answers if any have, for example if someone has an answer that
"X is a good policy and scores the highest point to X: but in questions B was asked about the benefits of X, admit that "X useless" data, so the correlation is inconsistent with logic. That leads to the discrepancies when data mining.
Reliability analysis is used for both self-assessment and job satisfaction scales to examine the items used to assess these variables are reliable. Reliability denotes difference quantity in case assessment, and the coefficient of reliability (Cronbach's alpha) can be calculated ranged from 0.0 (not reliability and high fluctuation) to 1.0 (completely reliable and consistent).
3.4.3 T-test analysis
.To assess the differences between the two groups, we often use the t-test method (or t-test). T-test is probably one of the simplest methods of statistical, as can be calculated manually, without computer or data analysis software.
Although simple, but t-test method is also very easy to make mistake. The most common mistake is to ignore the assumptions behind this method. T-test method is only appropriate if the data meets the following conditions or assumptions:
+ Two compared groups are completely independent;
+ Comparing variables must follow normal distribution (Gaussian distribution);
+ The object must be selected at random (random sample).
In this research, t-test analyzes were calculated to test whether the differences in attitudes and behavior between the two groups have different. Three different levels of p <.05, p <.01, and P <.001 was given for value t. To test the hypothesis H1 and H2 of this research, t-test analysis was used to find results.
3.4.4 Regression Analysis
Pearson correlation coefficient (ρ) was calculated to quantify the degree of linear relationship between two quantitative variables. In this research, it is the relationship between self-assessment and job satisfaction. Generally, ρ is used to examine the relationship between the quantitative variables. The correlation coefficient value is from -1 to 1. The correlation coefficient of 0 (or near 0) means that two variables are not related to each other, whereas if the coefficient of -1 or 1 means the two variables have an absolute relationship.
Pearson correlation analysis was calculated to research the relationship between assessment and job satisfaction. When the correlation between self-assessment and job satisfaction significantly (p <.05), it will conduct a linear regression analysis to examine. The hypothesis 3 of this research was examined by linear regression analysis to find out whether the self-assessment has a significant positive impact on job satisfaction.
CHAPTER 4 RESEARCH RESULTS
The research methodology was introduced in Chapter 3, this chapter will introduce the research results through the processing and analysis of data collected. As presented in the previous chapter, the research results introduced in this chapter consists of four parts that describe the statistics used to gather a group of individual characteristics demographic factors, analyze the reliability of the measurement scale encompassing two variables, self-assessment and job satisfaction at work, and the difference based on t-test method to test hypotheses H1 and H2, and finally execute correlation - regression analysis to test hypothesis H3.
4.1 DEMOGRAPHIC FACTORS
In this study, the research objects sampled are employees working at the Tax Department in Ho Chi Minh City and Phu Nhuan District. The research objects were selected through the sampling survey by survey questionnaires and the survey questionnaires were translated from English in Vietnamese. Tax Department in Ho Chi Minh City under the General Department of Taxation, Tax Departments are located around 24 Districts .For study participants including officials and employees in positions of management and administration management, working in the specialized departments and different personnel. Questionnaire survey of the research has been carried out and directly delivered to each object from July to August in 2014. There were 215 issued and received questionnaire surveys. During entering and cleaning data, there were 7 invalid responses. The invalid responses were excluded from the survey because the
research objects did not provide sufficient information or the responders only did check one kind of option through the entire questionnaire. Thus the valid survey sample size was 208 observations, which was presented in table form descriptive statistics.
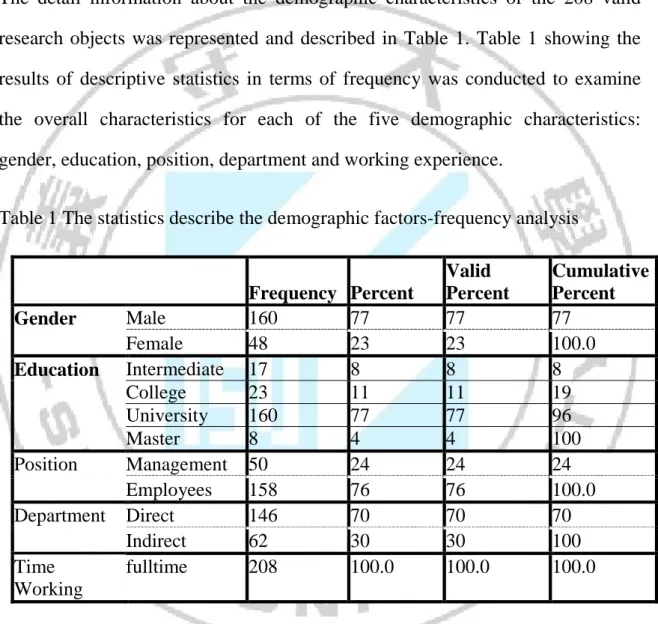
The detail information about the demographic characteristics of the 208 valid research objects was represented and described in Table 1. Table 1 showing the results of descriptive statistics in terms of frequency was conducted to examine the overall characteristics for each of the five demographic characteristics: gender, education, position, department and working experience.
Table 1 The statistics describe the demographic factors-frequency analysis
Frequency Percent Valid Percent Cumulative Percent Gender Male 160 77 77 77 Female 48 23 23 100.0 Education Intermediate 17 8 8 8 College 23 11 11 19 University 160 77 77 96 Master 8 4 4 100 Position Management 50 24 24 24 Employees 158 76 76 100.0 Department Direct 146 70 70 70 Indirect 62 30 30 100 Time Working fulltime 208 100.0 100.0 100.0
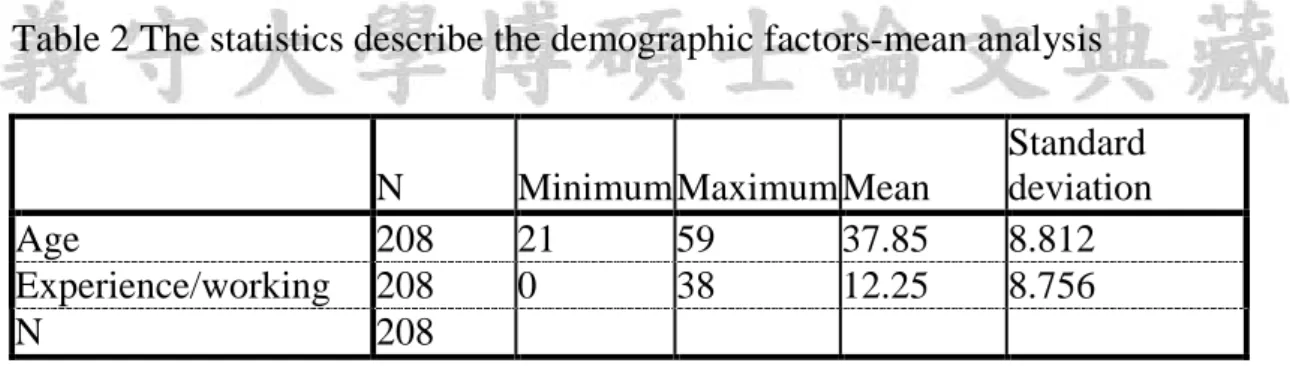
In addition, descriptive statistics resulting average value was also used to examine the average age and experience/working years for 208 valid research objects. The results were shown in Table 2. As Table 2 shows, the average age is 38; average experience/number of working years is 12.
Table 2 The statistics describe the demographic factors-mean analysis
N Minimum Maximum Mean
Standard deviation
Age 208 21 59 37.85 8.812
Experience/working 208 0 38 12.25 8.756
N 208
According to Table 1, the four demographic factors such as department, location, industry, and working time cannot be analyzed for each element which only a single group. Thus, six demographic characteristics (gender, age, education, experience/work year, position, and working department) were selected to test Hypothesis 1 and Hypothesis 2 in this study.
4.2 REDEFINE DEMOGRAPHIC FACTOR GROUPS
Because of statistical purposes, this study should be conducted to determine the groups to ensure that every demographic characteristic’s group must contain more than30 observations.
Two demographic characteristics, age and experience/years of service, were collected into two groups according to the average values shown in Table 2. For example, subjects aged 38 years and younger are collected into a group of children, while subjects over the age of 38 was collected on age group; experienced subjects/number of working years of 12 or less are collected into working groups have short time , while more than 12 are collected into Working groups have long time
Education was collected into two groups: high levels of education, including graduates, undergraduates, while low levels of education, including immediate education and colleges.
Departments and teams divided into two groups: direct and indirect.
Complete detail information about the redefined groups in terms of the personal characteristics of the samples used in this study, was shown from Table 3 to Table 8.
4.2.1 Gender information
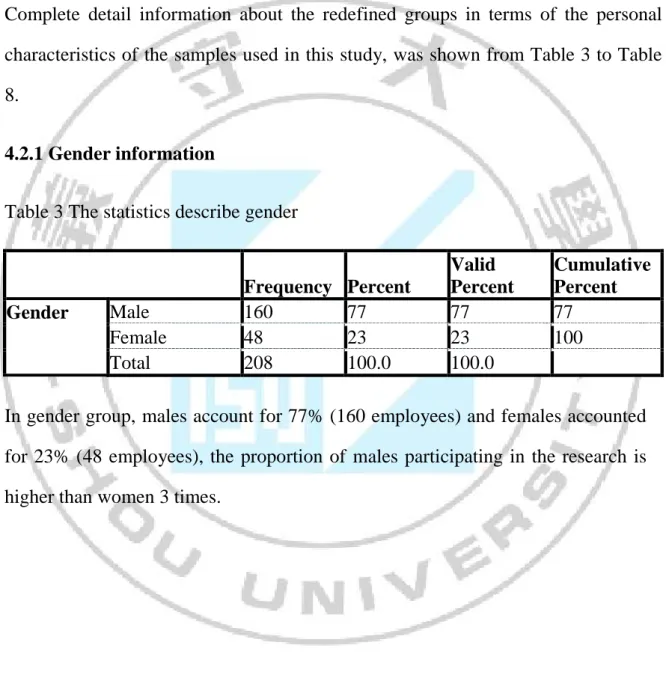
Table 3 The statistics describe gender
Frequency Percent Valid Percent Cumulative Percent Gender Male 160 77 77 77 Female 48 23 23 100 Total 208 100.0 100.0
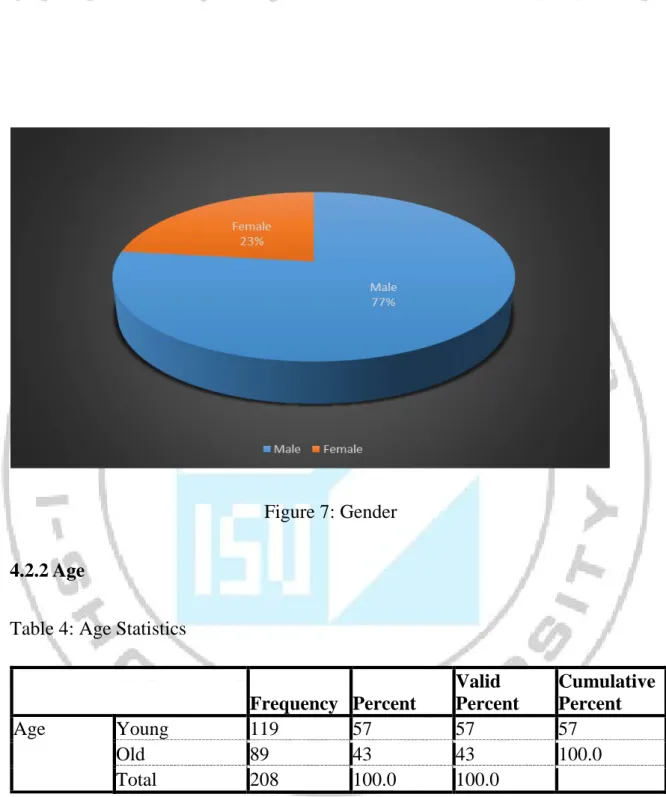
In gender group, males account for 77% (160 employees) and females accounted for 23% (48 employees), the proportion of males participating in the research is higher than women 3 times.
Figure 7: Gender
4.2.2 Age
Table 4: Age Statistics
Frequency Percent Valid Percent Cumulative Percent Age Young 119 57 57 57 Old 89 43 43 100.0 Total 208 100.0 100.0
The age of the study samples was divided into two groups, adult (from 38 years and younger) accounted for 57% (119 employees) and the middle-aged group (greater than 38 years) accounted for 43% (89 employees).
Figure 8Age
4.2.3 Education
Table 5: Education Statistics
Frequency Percent Valid Percent Cumulative Percent Education Low 40 19 19 19 High 168 81 81 100.0 Total 208 100.0 100.0 39
Education was also divided into two groups: group had lower levels (intermediate education and colleges) accounted for 19% (40 employees) and those with high levels (undergraduates and graduates) accounted for 81% (168 employees).
Figure 9: Education
4.2.4 Experience
Table 6: Experience Statistics
Frequency Percent Valid Percent Cumulative Percent Experience Short-time 129 62 62 62 Long-time 79 38 38 100.0 Total 208 100.0 100.0 40
The group having short-time in working (12 years or smaller) accounted for 62%, 129 employees, and the other group with long-time in working (over 12 years) accounted for 38%, 79 employees.
Figure 10: Experience
4.2.5 Working position
Table 7: Working position Statistics
Frequency Percent Valid Percent Cumulative Percent Working position Management 50 24 24 24 Employees 158 76 76 100.0 Total 208 100.0 100.0 41
The management group accounted 24% proportion with 50 employees and non-management group accounted 76% proportion with 158 employees.
Figure 11: Job title/Working position
4.2.6 Working department:
Table 8: Working department Statistics
Frequency Percent Valid Percent Cumulative Percent Department Direct 146 70 70 70.0 Indirect 62 30 30 100.0 42
Frequency Percent Valid Percent Cumulative Percent Department Direct 146 70 70 70.0 Indirect 62 30 30 100.0 Total 208 100.0 100.0
The group with employees working in direct department occupied 70%, 146 employees, and the group with employees working in indirect departments occupied 30%, 62 employees.
Figure 12: Working department
4.3 ANALYZING THE RELIABILITY OF THE
SELF-ASSESSMENT SCALE AND JOB SATISFATION SCALE
Reliability analysis was conducted to examine both the self-assessment scale and job satisfaction scale at work. The results are shown in Table 9 and Table 10.
According to Table 9, Cronbach's alpha (=0.705) for the self-assessment scale and Table 4.10 indicates Cronbach's alpha (=0.640) for job satisfaction is greater than 0.60, but closer 0.70. The results show that the self-assessment and job satisfaction scales are rather authentic and can be used to test the proposed hypothesis of the research.
In this study, the assessment is calculated on 12 items based on the self-assessment scale and job satisfaction is calculated 4 items based on the job satisfaction scale.
Table 9: Analyzing the reliability of the self-assessment scale
Cronbach's Alpha
Cronbach's Alpha based on
standardized items N
.705 .705 12
Table 10Analyzing the reliability of the job satisfation scale
Cronbach's Alpha
Cronbach's Alpha based on
standardized items N
.640 .649 4
4.4 ANALYZING DIFFERENCES
To test hypothesis 1 and 2, this study applies t-tests to examine differences between groups for self-assessment and job satisfaction. The groups are classified
by demographic characteristics, including gender, age, education, experience, job position, department, used to form the groups to analyze the differences based on Independent samples T-Test, Levene Test testing. Research results from t-test analysis are shown from table to table 11.
4.4.1 Gender
According to Table 11, Sig. (= 0.36) for self-assessment and Sig. (= 0.569) for job satisfaction, which means that the variance of the self-assessment and job satisfaction average follows normal distribution. Sig. of T-test (p) is calculated as 0.178 (t = 1,338, p> 0.05) in the self-assessment and Sig. of T-test (p) is calculated as 0.97 (t = -0.50, p> 0.05) in the job satisfaction. This shows that at 95% confidence level Gender factor does not create significant differences for self-assessment and job satisfaction. It means that male and female employees have the same attitude to the self-assessment and job satisfaction. In addition, both groups of male and female employees have positive self-assessment (men = 3.62 and women = 3.40), and their assessment of job satisfaction is high levels (male = 4.00, female = 4.00). Hypothesis 1a and 2a are removed.
Table 11: T – Test gender
Gender N Mean Standard deviatio n Average standard error T Sig. of Normality test Sig. self-assessment Male 160 3.6178 .51752 .04103 1.338 0.36 0.178 Female 48 3.3965 .46336 .06730 job satisfaction Male 160 3.9991 .57159 .04345 -.050 0.569 0.97 Female 48 4.0110 .61779 .08987 * p<.05, ** p<.01, *** p<.001 45
Figure 13: Graph of gender difference comparison
4.4.2 Age
Table 12 shows, Sig. (= 0.175) of self-assessment and Sig. (= 0.494) of job satisfaction, which means that the variance of the self-assessment and job satisfaction follows normal distribution. Sig. of T-test (p) is calculated as 0.059 (t = -1879, p> 0.05) in the self-assessment and Sig. of T-test (p) is calculated as 0.337 (t = 0.952, p> 0.05) in the job satisfaction. This shows that at 95% confidence level Age factor does not make a significant difference for self-assessment and job satisfaction. This means that adult employees and middle-aged employees have the attitude in terms of self-evaluation and job satisfaction. In addition, both groups have the positive self-assessment (adult = 3.53,
aged = 3.67), and their assessment of job satisfaction is high levels (young = 4.05, old = 3.96). Hypothesis 1b and Hypothesis 2b are removed.
Table 12: T – Test Age
Age N Mean Standard deviation Average standard error T Sig. of Normality test Sig. self-assessment Young 119 3.5314 0.47019 .04503 -1.879 0.175 0.059 Old 89 3.6738 0.54326 .05486 job satisfaction Young 119 4.0521 0.57645 .05541 0.952 0.494 0.337 Old 89 3.9643 .57915 .06176 * p<.05, ** p<.01, *** p<.001
Figure 14: Graph of age difference comparison
4.4.3 Education
To test whether the self-assessment and job satisfaction among high educated and low educated differently, Independent samples T-test was used. The
samples T - Test, and Levene Test was carried out (Table 13) with the following results:
• The assessment: Sig. is 0.54, which shows the variance of the self-assessment average should follow normal distribution. Sig. of T-test (p) is calculated as 0.034 (t = -2105, p <0.05). This suggests that the 95% confidence level, then we would conclude that Education factor has made a difference in the self-assessment. Hypothesis 1c is accepted.
• The job satisfaction: Sig. is 0.309, which shows that the variance of job satisfaction average should follow normal distribution. Sig. of T-test (p) is calculated as 0.216 (t = -1235, p> 0.05). This suggests that the 95% confidence level, then we would conclude that Education factor does not make a difference in job satisfaction. Hypothesis 2c is removed.
Comparing the average of the self-assessment between the low education and high education group, we found that employees having a high level of education have higher self-assessment (M = 3.69) than those with low education levels (M = 3.42). Employees having a high level of education seem to have more self-respect attitude, creating efficiency in them higher, little more irritable, and tend to become management staff more than those have the low levels of education.
Table 13: T – Test Eduction
Educatio n N Mean Standard deviatio n Average standard error T Sig. of Normality test Sig. self-assessment Low 40 3.4187 .51173 .04752 -2.105 0.540 0.034* High 168 3.6887 .46884 .05105 job Low 40 3.9336 .60425 .05610 -1.235 0.309 0.216 48
satisfaction High 168 4.1165 .55067 .06008 * p<.05, ** p<.01, *** p<.001
Figure 15: Graph of education difference comparison
4.4.4 Experience/Number of working years
Table 14 shows that both groups, short term and long term working years, have the variance of the self-assessment and job satisfaction average following normal distribution (Sig. of Self-assessment is 0.546 and Sig. of job satisfaction is 0.917), the Sig. of T-test (p) is calculated as 0.127 (t = -1519, p> 0.05) in the self-assessment and Sig. of T-test (p) is calculated as 0.564 (t = -0.561, p> 0.05) in job satisfaction. This showed that the experience / number of working years did not produce any significant differences in self-assessment and job satisfaction, which
means that employees having long or short term working years have the same attitude for self-assessment and job satisfaction. In addition, both these groups have self-assessment positive (short term= 3.55, long term = 3.67), and their assessment about job satisfaction is at high levels (short = 3.97, length = 4.02). Hypothesis 1d and 2d are removed.
Table 14: T – Test Experience/Number of working years
Number of working years N Mean Standard deviatio n Average standard error T Sig. of Normality test Sig. self-assessment Short-time 129 3.5493 .47525 .04365 -1.519 0.546 0.127 Long-time 79 3.6694 .51422 .05869 job satisfaction Short-time 129 3.9676 .58687 .05273 -.561 0.917 0.564 Long-time 79 4.0160 .58139 .06727 * p<.05, ** p<.01, *** p<.001 50