國立交通大學
材料科學與工程學系
碩 士 論 文
中空 Ag-Au、Ag-Pt 合金奈米粒子之合成
及其光學特性之研究
Hollow Ag-Au, Ag-Pt alloyed nanoparticles: synthesis,
and tunable optical properties.
研究生:陳建穎
指導教授:陳軍華 博士
中空 Ag-Au、Ag-Pt 合金奈米粒子之合成
及其光學特性之研究
Hollow Ag-Au, Ag-Pt alloyed nanoparticles: synthesis,
and tunable optical properties.
研 究 生:陳建穎
Student:Chan-Yin CHEN
指導教授:陳軍華 博士
Advisor:Chun-Hua CHEN, Ph.D.
國 立 交 通 大 學
材 料 科 學 與 工 程 學系
碩 士 論 文
A ThesisSubmitted to Department of Materials Science and Engineering College of Engineering
National Chiao Tung University in partial Fulfillment of the Requirements
for the Degree of Master
in
Materials Science and Engineering
Oct. 2009
Hsinchu, Taiwan, Republic of China
i 中空 Ag-Au、Ag-Pt 合金奈米粒子之合成及其光學特性之研究 學生:陳建穎 指導教授:陳軍華 博士 國立交通大學材料科學與工程學系﹙研究所﹚碩士班 摘 要 本論文研究主題包括:各式實心及中空 Ag-Au、Ag-Pt 奈米粒子之合成、結構 分析、光學特性及其理論模擬計算。 在實心奈米粒子合成方面,主要利用檸檬酸鈉還原法,成功製備出純 Au、Ag 奈米粒子,Ag/Au、Au/Ag 核殼奈米粒子,以及不同成分比例之 Ag-Au 合金奈米粒 子。藉由 HRTEM 形貌觀察顯示,這些奈米粒子之尺寸均小於 20 nm。此階段所形 成之奈米粒子,是作為製備空心奈米粒子之用,以及光學性質比較之用。在中空奈 米粒子合成方面,主要是利用伽凡尼取代反應,在先行合成之 Ag 奈米粒子(二種尺 寸)溶液中加入適當濃度之 Au3+前趨物(HAuCl 4),由於還原電位之差異,Au3+將取代 Ag0形成中空結構。藉由調控 Au3+前趨物之濃度,可以製備具有不同 Ag-Au 成分比 例之特殊形貌中空奈米粒子。根據 HRTEM 觀察,中空 Ag-Au 合金奈米粒子主要可 分為二類:其一是由較小尺寸 Ag 奈米粒子所合成之交聯型中空 Ag-Au 合金奈米粒 子,另一則是由較大尺寸(~15 nm)Ag 奈米粒子所合成之甜甜圈型中空 Ag-Au 合金奈 米粒子。此二種特殊結構有別於文獻中利用大尺寸 Ag 奈米粒子(~50 nm)所得之 Ag-Au 中空結構。利用此 Ag-Au 中空結構之合成技術,本研究亦另以 Pt4+前趨物 (H2PtCl6)來取代 Au3+前趨物進行中空 Ag-Pt 奈米粒子之合成。結果發現,合成所得 之 Ag-Pt 奈米粒子呈現球型中空結構,其表面具有多孔通道,深具應用之潛力。 從實心 Ag-Au 合金奈米粒子之 UV-vis 吸收光譜可以發現,吸收峰位於純 Au(520 nm)以及純 Ag(400 nm)奈米粒子的吸收峰間,其峰形單一且較為寬廣。有別於 Ag-Au
ii 合金奈米粒子,在實心 Ag/Au 核殼奈米粒子中,Au 殼層具有極大之屏蔽作用,當 Au 含量超過 Ag:Au=34.1/65.9 比例時,其吸收峰與純 Au 奈米粒子相仿。而實心 Au/Ag 核殼奈米粒子則呈現 Au 與 Ag 雙重吸收峰。在中空 Ag-Au 合金奈米粒子方面,若 使用較小尺寸 Ag 奈米粒子,當 Au 添加量較少時(Ag:Au=2:1, 3:1, 4:1),由於尚有許 多 Ag 仍未被 Au 取代,故 UV-vis 吸收光譜主要呈現純 Ag 奈米粒子之吸收峰,此 外,由於初始 Ag 奈米粒子之團聚造成取代反應後之交聯形貌中空 Ag-Au 奈米粒子, 在 UV 吸收光譜後段(1000 nm)之揚起猜測與此特殊結構相關。而當 Au 添加量較多 (Ag:Au=1:1)時,由於取代反應較為完全,故其吸收峰與純 Au 相仿,且由於此較完 全之取代反應,使得原本相團聚之 Ag 奈米粒子得以切斷,而形成較為獨立之中空 Ag-Au 奈米粒子,故不呈現特殊結構之吸收峰。若使用較大尺寸之 Ag 奈米粒子, 則 UV-vis 吸收光譜將產生極大之紅位移,吸收峰位於 600 nm~1000 nm,隨著表層 Au 比例增加而逐漸產生藍位移現象,與合金以及核殼結構大不相同。而在中空 Ag-Pt 結構的奈米粒子中,吸收峰則是隨著 Pt 含量增加而逐漸消失。在理論計算方面,利 用古典 Mie Theory,配合 Drude Model 理論,模擬出合金、核殼以及中空結構之奈 米粒子,並且與實驗數據相互參照,藉以掌握影響 UV-vis 吸收光譜之奈米粒子結構 參數,同時提昇實驗之可信度。
iii
Hollow Ag-Au, Ag-Pt alloyed nanoparticles: synthesis, and tunable optical properties.
student:Chan-Yin CHEN Advisor:Chun-Hua CHEN,
Ph.D.
Department of Materials Science and Engineering National Chiao Tung University
ABSTRACT
The thesis contains three main topics: synthesis of various solid and hollow Ag-Au as well as Ag-Pt nanoparticles, structural characterization, and optical properties with theoretical simulations.
Solid nanoparticles including Ag, Au, Au/Ag and Ag/Au core-shell, and Ag-Au alloyed nanoparticles with various compositions were synthesized by means of a chemical reduction method. According to HRTEM images, the mean sizes of the nanoparticles prepared were found to be smaller than 20 nm with a narrow size distribution. Those solid nanoparticles were used as the templates for the further synthesis of hollow nanoparticles and were used as the references of structural and optical observations. For the synthesis of hollow nanoparticles, Galvanic replace reactions with designed compositions were carried out at various temperatures. With different Ag template sizes, and HAuCl4 concentrations, a serious of hollow Ag-Au nanoparticles was
synthesized. From HRTEM images, two distinct nanostructures observed fully depends on the size of Ag template. With smaller and larger Ag nanoparticles, a cross-link nanostructure and a donut-like hollow nanostructures was obtained, respectively. These two special nanostructures are quite different from those using much larger Ag nanoparticles (~50 nm) in some previous studies. In addition, another hollow sphere Ag-Pt nanostructure with many open channels was newly synthesized by using H2PtCl6
as the precursor.
iv
the absorption peaks of Ag-Au alloyed nanoparticles just located between that of pure Ag and Au nanoparticles as our expectancy. Different with the Ag-Au alloyed nanoparticles, Au shell showed strong sheltered effect in the Ag/Au core-shell nanoparticles. As the atomic ratio of Au shell is higher 65.9% (Ag:Au=34.1:65.9), the absorption peak exhibits features as pure Au nanoparticles. In contrast, the UV-vis spectra of Au/Ag core-shell nanoparticles demonstrated features of both pure Au and Ag nanoparticles. The UV-Vis absorption of the hollow Ag-Au alloyed nanostructures mainly depends on their nanostructures, i.e. the cross-link structures and the donut-like hollow structures. In the case of cross-link hollow Ag-Au alloyed nanoparticles, as the concentration of addition of Au3+ is lower (Ag:Au=2:1, 3:1, 4:1), a strong absorption peaks was observed at 400 nm (pure Ag nanoparticles) due to the incomplete replacement of residual Ag template. It is interesting that a much broadening absorption peak around 1000 nm might result from the special cross-link nanostructures. Whereas, the donut-like hollow Ag-Au alloyed nanoparticles showed a clear red shit at 600 nm~1000 nm indicating the similar effect as the perfect hollow nanoparticles. By using the classic Mie theory with Drude modification, theoretical spectra of Ag, Au, Au/Ag and Ag/Au core-shell, and Ag-Au alloyed nanoparticles were calculated for the comparing with our experiment data and for the understanding of effective structural factors for the design of functional nanostructures.
v
誌謝
首先,感謝陳軍華老師兩年來的指導還有所有的研究室夥伴。七百多個日子的 研究室生活,因為有你們而豐富許多;感謝曾經幫忙過我的大家:學長相孙、修誠、 景筌、澤偉、宗漢還有學弟峰哥、坤翰,學妹怡真。在交大的這兩年,實驗室從本 來的麻雀雖小五臟俱全,到現在逐漸壯大,每一個人都扮演不可或缺的角色,祝福 大家在往後的日子一切順利,也希望研究室的規模可以日益茁壯,最後,感謝一路 支持我的家人,在兩年來不斷給我適時的鼓勵,如果沒有你們,也沒有今天的我! 謝謝!vi
目錄
中文摘要 i 英文摘要 iii 誌謝 v 目錄 vi 圖表目錄 ix 第一章 緒論 1 第二章 文獻回顧與實驗原理 2 2-1 金屬奈米粒子之製備 ... 2 2-2 二元實心金屬奈米粒子 ... 3 2-2-1 合金結構之奈米粒子 ... 3 2-2-2 核殼結構之奈米粒子 ... 5 2-3 二元中空結構之奈米粒子 ... 6 2-4 製備原理 ... 11 2-4-1 伽凡尼取代反應 ... 11 2-4-2 Kirkendall effect ... 12 2-4-3 取代機制 ... 12 2-4-3-1 Alloy process ... 12 2-4-3-2 Dealloy process ... 14 第三章 實驗方法與步驟 15 3-1 實驗藥品 ... 15 3-2 實驗設備 ... 15 3-3 實驗方法 ... 16 3-3-1 Ag-Au 合金奈米粒子的製備方法 ... 16 3-3-2 Au/Ag 核殼奈米粒子的製備方法 ... 17 3-3-3 Ag/Au 核殼奈米粒子的製備方法 ... 18 3-3-4 中空 Ag-Au 合金奈米粒子的製備方法 ... 19vii
3-3-5 中空 Ag-Pt 合金奈米粒子的製備方法 ... 21
3-4 奈米粒子的光學性質測量 ... 22
3-4-1 紫外光-可見光吸收光譜(UV-vis absorption spectra) ... 22
3-4-2 X 光繞射分析(XRD) ... 22
3-4-3 場發射穿透式電子顯微鏡(Field Emission Transmission Electron Microscope, FETEM) ... 22 第四章 奈米粒子之結構及光學特性分析 23 4-1 Ag-Au 合金奈米粒子 ... 23 4-1-1 結構特性分析 ... 23 TEM 分析 ... 23 SEM 分析 ... 25 XRD 分析 ... 25 4-1-2 光學特性分析 ... 26 UV-Vis 光譜分析 ... 26 4-2 Au/Ag 核殼奈米粒子 ... 27 4-2-1 結構特性分析 ... 27 TEM 分析 ... 27 SEM 分析 ... 29 XRD 分析 ... 30 4-2-2 光學特性分析 ... 31 UV-Vis 光譜分析 ... 31 4-3 Ag/Au 核殼奈米粒子 ... 34 4-3-1 結構特性分析 ... 34 TEM 分析 ... 34 SEM 分析 ... 38 XRD 分析 ... 38 4-3-2 光學特性分析 ... 39
viii UV-Vis 光譜分析 ... 39 4-4 中空 Ag-Au 合金奈米粒子 ... 41 4-4-1 結構特性分析 ... 41 Ag 奈米粒子的 XRD 分析... 41 TEM 分析 ... 41 XRD 分析 ... 55 4-4-2 光學特性分析 ... 55 Ag 奈米粒子生長之 Ex-situ UV 分析 ... 55 中空 Ag-Au 合金奈米粒子生長之 Ex-situ UV 分析 ... 58 4-5 中空 Ag-Pt 合金奈米粒子 ... 62 4-5-1 結構特性分析 ... 62 TEM 分析 ... 63 XRD 分析 ... 68 4-5-2 光學特性分析 ... 69 中空 Ag-Pt 合金奈米粒子之 Ex-situ UV 分析 ... 69 第五章 奈米粒子之 UV-Vis 光譜模擬 72 5-1 理論推導 ... 72 5-2 傳統理論計算 ... 77 5-2-1 Classical Mie 的模型 ... 77 5-2-2 Quasi-static 的假設 ... 79 5-3 Drude Model 的假設 ... 82 第六章 結論 88 6-1 實驗結果 ... 88 6-2 未來展望 ... 89 參考文獻 90
ix
圖表目錄
Table 2-1 Physical reduction process of nanoparticles. ... 2 Table 2-2 Chemical reduction process of nanoparticles. ... 2 Fig. 2-1 UV-vis spectra of Ag core (black) and Ag/Au core-shell with a shell thickness of
one monolayer (red) and two monolayers (blue). The inset shows Ag/Au core-shell with a shell thickness of one monolayer (red) and Ag/Au alloy nanoparticles.[60] ... 5 Fig. 2-2 Core (Rc =3 nm): Ag; Shell (variable thickness): Au. Bulk dielectrical data are
deduced from Drude model. [52] ... 6 Fig. 2-3 Absorption cross-section versus wavelength for AgcoreAushell nanospheres with
different relative Au composition. With the increasing Au content, the absorption peak decreases and red-shifts.[47] ... 6 Fig. 2-4 Schematic illustration of the experimental procedure that generates nanoscale
shells of gold from silver templates with various morphologies. The reaction is illustrated in the schematic as follows: (A) Addition of HAuCl4 to a dispersion of
silver nanoparticles and initiation of the replacement reaction;(B) The continued replacement reaction of HAuCl4 with the silver nanoparticles; (C) Depletion of
silver and annealing of the resultant shells to generate smooth hollow structures. Note that the shape of each silver nanoparticle is essentially preserved in this template-engaged reaction. [56] ... 7 Fig. 2-5 UV-Vis absorption spectra of an aqueous dispersion of silver nanoparticles (~50
nm in diameter) before and after various volumes of 1 mM HAuCl4 aqueous solution
had been added. There existed an isosbestic point at ~530 nm.[56] ... 8 Fig. 2-6 (A) TEM image of silver nanoparticles synthesized using the polyol process. (B,
C) TEM and SEM images of gold nanoshells formed by reacting these silver nanoparticles with an aqueous HAuCl4 solution. [56] ... 8
Fig. 2-7 (A) UV-visible extinction spectra of solid colloids made of pure silver, pure gold, and silver/gold alloys with various molar fractions of gold.All spectra were normalized against their peak extinctions. (B) A plot showing the linear dependence between the extinction peak position (λmax) and the molar fraction (xAu) of gold in the nanoparticles: λmax = 412 +1.13xAu.[57] ... 9 Fig. 2-8 TEM images of (A) gold nanoshells obtained by reacting 25 nm silver
nanoparticles with HAuCl4 and (B) gold solid colloids with diameter of ~ 30 nm.[57]
... 9 (C) UV-visible extinction spectra and (D) photographs of aqueous dispersions of gold
nanoshells (e, ~ 25 nm in core diameter) after their surfaces had been electrolessly plated with gold of various thicknesses (b–d). As a comparison, the spectrum and photograph of a dispersion of gold solid colloids ( ~ 30 nm in diameter) were also
x
shown (a). [57] ... 10 Fig. 2-9 Plots of the dependence of peak shift (Δλmax, relative to the peak position
calculated for water with n = 1.33) on the refractive index of surrounding medium. The sensitivity factors, Δλmax/n, were 328.5 and 66.5 nm RIU21 for gold nanoshell (with a core diameter of 25 nm and a wall thickness of 2 nm) and solid colloid (with diameter of 25 nm),respectively. [57] ... 10 Fig. 2-10 Schematic of the Kirkendall effect. ... 12 Fig. 2-11 The schematic illustration the proposed mechanism for the formation of gold
truncated octahedra. A truncated cuboctahedron is used to represent the starting spherical silver nanocrystal. A replacement reaction between gold and silver removes silver atoms preferentially from (111) facets, while depositing gold atoms selectively to higher energy facets such as (100) and (110).[58] ... 13 Fig. 2-12 (A) HRTEM image of a silver nanocrystal, confirming spherical morphology
and single crystalline structure. (B-D) HRTEM images of gold hollow nanocrystals, showing a faceted morphology and a single crystalline domain within each particle: (B) imaged along the <100> direction and (D) imaged along the <110> direction. Various views of the faceted nanocrystals are consistent with a truncated octahedron as the dominant particle shape, as illustrated schematically.[58] ... 13 Fig. 2-13 Simulated evolution of an artificial pit in Au10%Ag90% (atom%), Φ=1.8 eV.
Cross sections along the (111) plane defined by the yellow line in a are shown below each plan view. (a), The initial condition is a surface fully passivated with gold except within a circular region (the “artificial pit”). (b), After 1 s, the pit has penetrated a few monolayers into the bulk. We note how there are fewer gold clusters near the side wall than at the centre of the pit. (c), After 10 s, a gold cluster has nucleated in the centre of the pit. (d), At 100 s, the pit has split into multiple pits.[59] ... 14 Table 3-1 The chemicals used for preparing the experimetanl nanoparticles. ... 15 Fig. 3-1 Process of synthesizing Ag-Au alloy nanoparticles by aqueous process. ... 16 Fig. 3-2 Process of synthesizing pure Au and Au/Ag core-shell nanoparticles by
aqueous process. ... 17 Fig. 3-3 Process of synthesizing pure Ag and Ag/Au core-shell nanoparticles by
aqueous process. ... 18 Fig. 3-4 Process of synthesizing 1hr reaction time at 60°C Ag nanoparticles by aqueous
process. ... 19 Fig. 3-5 Process of synthesizing hollow Ag-Au alloyed nanoparticles by aqueous
process. 20
Fig. 3-6 Process of synthesizing hollow Ag-Pt alloyed nanoparticles by aqueous process. .... 21 Fig. 4-1 HRTEM images of Ag-Au alloyed nanoparticles (Ag:Au=1:1). ... 24
xi
Fig. 4-2 HRTEM/EDX results of (a) inner part and (b) outer part of Ag-Au alloyed
nanoparticles (Ag:Au=1:1). ... 24
Table 4-1 HRTEM/EDX results of (a) inner part and (b) outer part of Ag-Au alloyed nanoparticles (Ag:Au=1:1). ... 24
Fig. 4-3 SEM images of Ag-Au alloyed nanoparticles ((1) Ag:Au=1:1,(2) Ag:Au=3:1). ... 25
Table 4-2 SEM/EDX results of Ag-Au alloyed nanoparticles. ... 25
Fig. 4-4 XRD of Ag-Au alloyed nanoparticles (Ag/Au=1:1)... 26
Table 4-3 The XRD fitting result of Ag-Au alloyed nanopaticles (Ag/Au=1:1). ... 26
Fig. 4-5UV-Vis absorption spectra of Ag, Au and Ag-Au alloyed nanoparticles... 27
Fig. 4-6 HRTEM images of Au/Ag core-shell nanoparticles (Ag/Au=29/71). ... 28
Fig. 4-7 HRTEM/EDX results of (a) inner part and (b) outer part of Au/Ag core-shell nanoparticles (Ag/Au=29/71). ... 28
Table 4-4 HRTEM/EDX results of (a) inner part and (b) outer part of Au/Ag core-shell nanoparticles (Ag/Au=29/71). ... 28
Fig. 4-8 HRTEM images of Au/Ag core-shell nanoparticles (Ag/Au=29/71). ... 29
Fig. 4-9 HRTEM/EDX results of (a) inner part and (b) outer part of Au/Ag core-shell nanoparticles (Ag/Au=29/71). ... 29
Table 4-5 HRTEM/EDX results of (a) inner part and (b) outer part of Au/Ag core-shell nanoparticles (Ag/Au=29/71). ... 29
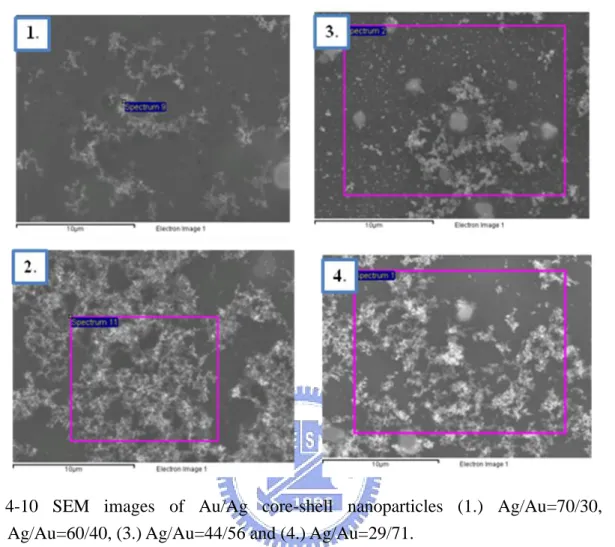
Fig. 4-10 SEM images of Au/Ag core-shell nanoparticles (1.) Ag/Au=70/30, (2.) Ag/Au=60/40, (3.) Ag/Au=44/56 and (4.) Ag/Au=29/71. ... 30
Table 4-5 SEM/EDX results of Au/Ag core-shell nanoparticles (1.) Ag/Au=70/30, (2.) Ag/Au=60/40, (3.) Ag/Au=44/56 and (4.) Ag/Au=29/71. ... 30
Fig. 4-11 XRD of Au/Ag core-shell nanoparticles. ... 31
Table 4-6 The XRD fitting result of Au/Ag core-shell nanopaticles with different Au seed volumes. ... 31
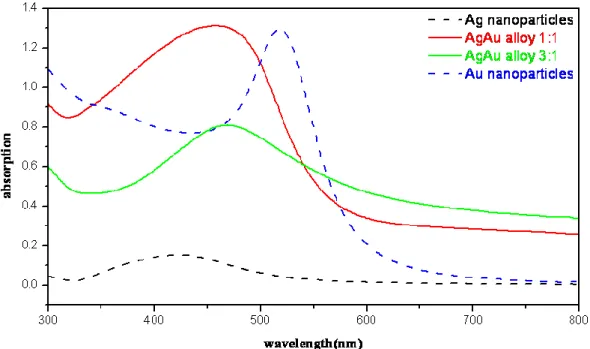
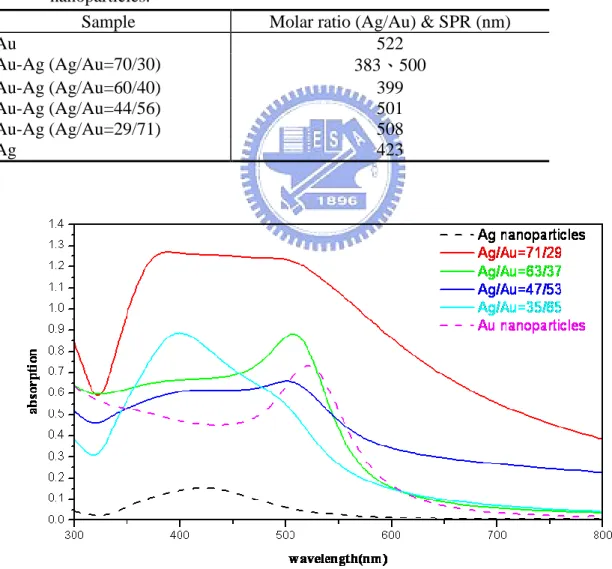
Table 4-7 The molar ratios and their SPR band positions of Au, Ag and Au/Ag core-shell nanoparticles. ... 32
Fig. 4-12 UV-Vis absorption spectra of of Au, Ag and Au/Ag core-shell nanoparticles (the compositions showed here were the real compositions obtained from SEM/EDX). ... 32
Fig. 4-13 Calculated optical extinction spectra for Au/Ag core-shell nanoparticles .We use Quasi-static theory with Drude model coefficients for the calculation. The Au core radii are 5 nm, 10 nm, 15 nm, and 20 nm with the same Ag shell thickness (3 nm).It can be found that the sheltered effect from Ag shell is very obvious. ... 33
Fig. 4-14 Calculated optical extinction spectra for Au/Ag core-shell nanoparticles. The Au core radii are 3 nm, 5 nm, and 7 nm, with the same Ag shell thickness (0.5 nm). It can be found that the sheltered effect from Ag shell isn’t very obvious. ... 33
xii
Fig. 4-16 HRTEM/EDX results of (a) inner part and (b) outer part of Ag/Au core-shell nanoparticles (Ag:Au=25:75). ... 35 Table 4-8 HRTEM/EDX results of (a) inner part and (b) outer part of Ag/Au core-shell
nanoparticles (Ag:Au=25:75). ... 35 Fig. 4-17 HRTEM images of Ag/Au core-shell nanoparticles (Ag:Au=25:75). ... 36 Fig. 4-18 HRTEM/EDX results of (a) inner part and (b) outer part of Ag/Au core-shell
nanoparticles (Ag:Au=25:75). ... 36 Table 4-9 HRTEM/EDX results of (a) inner part and (b) outer part of Ag/Au core-shell
nanoparticles (Ag:Au=25:75). ... 36 Fig. 4-19 HRTEM images of Ag/Au core-shell nanoparticles (Ag:Au=6:94). ... 37 Fig. 4-20 HRTEM/EDX results of (a) inner part and (b) outer part of Ag/Au core-shell
nanoparticles (Ag:Au=6:94). ... 37 Table 4-10 HRTEM/EDX results of (a) inner part and (b) outer part of Ag/Au core-shell
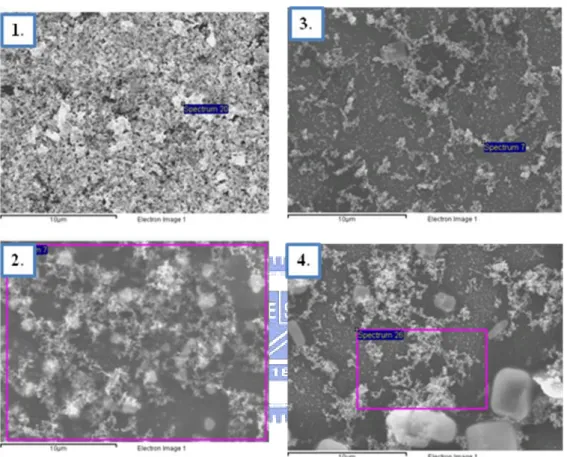
nanoparticles (Ag:Au=6:94). ... 37 Fig. 4-21 SEM images of Ag/Au core-shell nanoparticles (1.) Ag/Au=6/94, (2.)
Ag/Au=8/92, (3.) Ag/Au=13/87 and (4.) Ag/Au=25/75. ... 38 Table 4-11 SEM/EDX results of Ag/Au core-shell nanoparticles (1.) Ag/Au=6/94, (2.)
Ag/Au=8/92, (3.) Ag/Au=13/87 and (4.) Ag/Au=25/75. ... 38 Fig. 4-22 X-ray diffraction of Ag/Au core-shell nanoparticles. ... 39 Table 4-19 The XRD fitting result of Ag/Au core-shell nanopaticles with different Au
seed volumes . ... 39 Table 4-20 The molar ratios and their SPR band positions of Au, Ag,Ag/Au core-shell
nanoparticles. ... 40 Fig. 4-23 UV-Vis absorption spectra of of Au, Ag and Ag/Au core-shell nanoparticles (the
compositions showed here were the real compositions obtained from SEM/EDX). ... 40 Fig. 4-24 X-ray diffraction of Ag nanoparticles for 1 hr reaction time at 60oC. ... 41 Table 4-21 The XRD fitting result of Ag nanopaticles with 1 hr reaction time at 60oC. ... 41 Fig. 4-25 HRTEM images of hollow Ag-Au alloyed nanoparticles with smaller initial Ag
NPs. The atomic ratio of Ag:Au is 1:1. ... 42 Table 4-22 HRTEM/EDX results of hollow Ag-Au alloyed nanoparticles with smaller
initial Ag NPs .The atomic ratio of Ag/Au=15/85. ... 42 Fig. 4-26 HRTEM images of hollow Ag-Au alloyed nanoparticles with smaller initial Ag
NPs. The atomic ratio of Ag:Au is 1:1. ... 43 Table 4-23 HRTEM/EDX results of hollow Ag-Au alloyed nanoparticles with smaller
initial Ag NPs . The atomic ratio of Ag/Au=9/91. ... 43 Fig. 4-27 HRTEM images of hollow Ag-Au alloyed nanoparticles with smaller initial Ag
xiii
Table 4-24 HRTEM/EDX results of hollow Ag-Au alloyed nanoparticles with smaller initial Ag NPs . The atomic ratio of Ag/Au=23/77. ... 43 Fig. 4-28 HRTEM images of hollow Ag-Au alloyed nanoparticles with smaller initial Ag
NPs. The atomic ratio of Ag:Au is 2:1. ... 44 Table 4-25 HRTEM/EDX results of hollow Ag-Au alloyed nanoparticles with smaller
initial Ag NPs . The atomic ratio of Ag/Au=21/79. ... 44 Fig. 4-29 HRTEM images of hollow Ag-Au alloyed nanoparticles with smaller initial Ag
NPs. The atomic ratio of Ag:Au is 3:1. ... 45 Table 4-26 HRTEM/EDX results of hollow Ag-Au alloyed nanoparticles with smaller
initial Ag NPs . The atomic ratio of Ag/Au=82/18. ... 45 Fig. 4-30 HRTEM images of hollow Ag-Au alloyed nanoparticles with smaller initial Ag
NPs. The atomic ratio of Ag:Au is 3:1. ... 45 Table 4-27 HRTEM/EDX results of hollow Ag-Au alloyed nanoparticles with smaller
initial Ag NPs . The atomic ratio of Ag/Au=56/44. ... 45 Fig. 4-31 HRTEM images of hollow Ag-Au alloyed nanoparticles with smaller initial Ag
NPs. The atomic ratio of Ag:Au is 4:1. ... 46 Table 4-28 HRTEM/EDX results of hollow Ag-Au alloyed nanoparticles with smaller
initial Ag NPs . The atomic ratio of Ag/Au=42/58. ... 46 Fig. 4-32 HRTEM images of hollow Ag-Au alloyed nanoparticles with smaller initial Ag
NPs. The atomic ratio of Ag:Au is 4:1. ... 46 Table 4-29 HRTEM/EDX results of hollow Ag-Au alloyed nanoparticles with smaller
initial Ag NPs . The atomic ratio of Ag/Au=39/61. ... 47 Fig. 4-33 HRTEM images of hollow Ag-Au alloyed nanoparticles with larger initial Ag
NPs. The atomic ratio of Ag:Au is 1:1. ... 49 Fig. 4-34 HRTEM/EDX results (inner part) of hollow Ag-Au nanoparticles with larger
initial Ag NPs. The atomic ratio of Ag:Au is 1:1. ... 49 Table 4-30 HRTEM/EDX results (inner part) of hollow Ag-Au alloyed nanoparticles with
larger initial Ag NPs. The atomic ratio of Ag:Au is 1:1. ... 49 Fig. 4-35 HRTEM/EDX results (outer part) of hollow Ag-Au alloyed nanoparticles with
larger initial Ag NPs. The atomic ratio of Ag:Au is 1:1. ... 50 Table 4-31 HRTEM/EDX results(outer part) of hollow Ag-Au alloyed nanoparticles with
larger initial Ag NPs. The atomic ratio of Ag:Au is 1:1. ... 50 Fig. 4-36 HRTEM images of hollow Ag-Au alloyed nanoparticles with larger initial Ag
NPs. The atomic ratio of Ag:Au is 2:1. ... 50 Fig. 4-37 HRTEM/EDX results of hollow Ag-Au alloyed nanoparticles with larger initial
Ag NPs. The atomic ratio of Ag:Au is 2:1. ... 51 Table 4-32 HRTEM/EDX results of hollow Ag-Au alloyed nanoparticles with larger
xiv
Fig. 4-38 HRTEM images of hollow Ag-Au alloyed nanoparticles with larger initial Ag NPs. The atomic ratio of Ag:Au is 3:1. ... 51 Fig. 4-39 HRTEM/EDX results of hollow Ag-Au alloyed nanoparticles with larger initial
Ag NPs. The atomic ratio of Ag:Au is 3:1. ... 52 Table 4-33 HRTEM/EDX results of hollow Ag-Au alloyed nanoparticles with larger
initial Ag NPs. The atomic ratio of Ag:Au is 3:1. ... 52 Fig. 4-40 HRTEM images of hollow Ag-Au alloyed nanoparticles with larger initial Ag
NPs. The atomic ratio of Ag:Au is 3:1. ... 52 Fig. 4-41 HRTEM/EDX results of hollow Ag-Au alloyed nanoparticles with larger initial
Ag NPs. The atomic ratio of Ag:Au is 3:1. ... 53 Table 4-34 HRTEM/EDX results of hollow Ag-Au alloyed nanoparticles with larger
initial Ag NPs. The atomic ratio of Ag:Au is 3:1. ... 53 Fig. 4-42 HRTEM images of hollow Ag-Au alloyed nanoparticles with larger initial Ag
NPs. The atomic ratio of Ag:Au is 4:1. ... 53 Fig. 4-43 HRTEM/EDX results(inner part) of hollow Ag-Au alloyed nanoparticles with
larger initial Ag NPs. The atomic ratio of Ag:Au is 4:1. ... 54 Table 4-35 HRTEM/EDX results(inner part) of hollow Ag-Au alloyed nanoparticles with
larger initial Ag NPs. The atomic ratio of Ag:Au is 4:1. ... 54 Fig. 4-44 HRTEM/EDX results(outer part) of hollow Ag-Au alloyed nanoparticles with
larger initial Ag NPs. The atomic ratio of Ag:Au is 4:1. ... 54 Table 4-36 HRTEM/EDX results(outer part) of hollow Ag-Au alloyed nanoparticles with
larger initial Ag NPs. The atomic ratio of Ag:Au is 4:1. ... 54 Fig. 4-45 X-ray diffraction of hollow Ag-Au alloyed nanoparticles. ... 55 Table 4-37 The XRD fitting result of hollow Ag-Au nanopaticles with different atomic
ratio. ... 55 Fig. 4-46 Ex-situ UV-Vis absorption spectra of Ag nanoparticles with 1hr reaction time at
60oC . ... 56 Fig. 4-47 UV-Vis absorption spectra of Ag nanoparticles with 10 min reaction time at
60oC . ... 57 Fig. 4-48 Photographs of aqueous dispersions of Ag nanoparticles after reacted with
NaBH4 (bottle No.3~5) and the colors began to change dramatically from light
orange to brown (bottle No.10~15). ... 58 Fig. 4-49 Photographs of aqueous dispersions of Ag nanoparticles after 1 hr reaction time
at 60oC, the samples have less change in color. ... 58 Fig. 4-50 Exsitu-UV-Vis absorption spectra of Ag NPs with 1 hr reaction time at 60oC
before and after they had reacted with different volumes of 1mM HAuCl4 aqueous
solution . The composition of Ag : Au is 3:1 ... 60 Fig. 4-51 UV-Vis absorption spectra of Ag NPs with 10 min reaction time at 60oC after
xv
reacted with different volumes of 1mM HAuCl4 aqueous solution. ... 60
Table 4-38 The molar ratios and their SPR band positions of 10 min reaction time at 60oC hollow Ag/Au nanoparticles. ... 60 Fig. 4-52 UV-Visabsorption spectra of Ag NPs with 1 hr reaction time at 60oC after
reacted with different volumes of 1mM HAuCl4 aqueous solution. ... 61
Table 4-39 The molar ratios and their SPR band positions of 1 hr reaction time at 60oC hollow Ag/Au nanoparticles. ... 61 Fig. 4-53 Photographs of aqueous dispersions of hollow Ag-Au nanoparticles after they
have been reacted with increasing volumes of HAuCl4 and the colors began to
change dramatically from brown to dark blue (bottle No.5~46). After adding NH4OH, the color began to change from dark blue to light blue. ... 62 Fig. 4-54 HRTEM images of hollow Ag-Pt alloyed nanoparticles with larger initial Ag
NPs. The atomic ratio of Ag:Pt is 2:1. ... 63 Fig. 4-55 HRTEM/EDX results(inner part) of hollow Ag-Pt alloyed nanoparticles with
larger initial Ag NPs. The atomic ratio of Ag:Pt is 2:1. ... 64 Table 4-40 HRTEM/EDX results(inner part) of hollow Ag-Pt alloyed nanoparticles with
larger initial Ag NPs. The atomic ratio of Ag:Pt is 2:1. ... 64 Fig. 4-56 HRTEM/EDX results(outer part) of hollow Ag-Pt alloyed nanoparticles with
larger initial Ag NPs. The atomic ratio of Ag:Pt is 2:1. ... 64 Table 4-41 HRTEM/EDX results(outer part) of hollow Ag-Pt alloyed nanoparticles with
larger initial Ag NPs. The atomic ratio of Ag:Pt is 2:1. ... 64 Fig. 4-57 HRTEM images of hollow Ag-Pt alloyed nanoparticles with larger initial Ag
NPs. The atomic ratio of Ag:Pt is 4:1. ... 65 Fig. 4-58 HRTEM/EDX results(inner part) of hollow Ag-Pt alloyed nanoparticles with
larger initial Ag NPs. The atomic ratio of Ag:Pt is 4:1. ... 65 Table 4-42 HRTEM/EDX results(outer part) of hollow Ag-Pt alloyed nanoparticles with
larger initial Ag NPs. The atomic ratio of Ag:Pt is 4:1. ... 65 Fig. 4-59 HRTEM/EDX results(outer part) of hollow Ag-Pt alloyed nanoparticles with
larger initial Ag NPs. The atomic ratio of Ag:Pt is 4:1. ... 66 Table 4-43 HRTEM/EDX results(outer part) of hollow Ag-Pt alloyed nanoparticles with
larger initial Ag NPs. The atomic ratio of Ag:Pt is 4:1. ... 66 Fig. 4-60 HRTEM images of hollow Ag-Pt alloyed nanoparticles with larger initial Ag
NPs. The atomic ratio of Ag:Pt is 8:1. ... 66 Fig. 4-61 HRTEM/EDX results(inner part) of hollow Ag-Pt alloyed nanoparticles with
larger initial Ag NPs. The atomic ratio of Ag:Pt is 8:1. ... 67 Table 4-44 HRTEM/EDX results(inner part) of hollow Ag-Pt alloyed nanoparticles with
larger initial Ag NPs. The atomic ratio of Ag:Pt is 8:1. ... 67 Fig. 4-62 HRTEM/EDX results(outer part) of hollow Ag/Pt alloyed nanoparticles with
xvi
larger initial Ag NPs. The atomic ratio of Ag:Pt is 8:1. ... 67
Table 4-45 HRTEM/EDX results(outer part) of hollow Ag-Pt alloyed nanoparticles with larger initial Ag NPs. The atomic ratio of Ag:Pt is 8:1. ... 67
Fig. 4-63 X-ray diffraction of hollow Ag-Pt alloyed nanoparticles. ... 68
Table 4-46 The XRD fitting result of hollow Ag-Pt alloyed nanopaticles. ... 68
Fig.4-64 X-ray diffraction of hollow Ag-Pt alloyed nanoparticles. ... 69
Table 4-47 The XRD fitting result of hollow Ag-Pt alloyed nanopaticles . ... 69
Fig. 4-65 UV-Vis absorption spectra of Ag NPs (1hr reaction time) reacted with different volumes of 1mM H2PtCl6 aqueous solution. ... 70
Fig. 4-66 Exsitu UV-Vis absorption spectra of Ag NPs (1hr reaction time) reacted with different volumes of 1mM H2PtCl6 aqueous solution. ... 71
Fig. 4-67 Photographs of aqueous dispersions of hollow Ag-Pt nanoparticles after they have been reacted with increasing volumes of H2PtCl6 and the colors changed dramatically from dark brown to light brown (bottle No.1~31). After adding of NH4OH, the color changed from light brown to light yellow. ... 71
Fig. 5-1 Calculated optical extinction spectra of Au nanoparticles with different sizes by classical Mie model. ... 78
Fig. 5-2 Calculated optical extinction spectra of Ag nanoparticles by classical Mie model. ... 78
Fig. 5-3 Calculated optical extinction spectra of Ag-Au alloy nanoparticles by classical Mie model. ... 79
Fig. 5-4 Schematic of the Quasi-static theory. ... 79
Fig. 5-5 Calculated optical extinction spectra of Au nanoparticles by Quasi-static model... 80
Fig. 5-6 Calculated optical extinction spectra of Ag nanoparticles by Quasi-static model... 80
Fig. 5-7 Calculated optical extinction spectra of Ag-Au alloy nanoparticles by Quasi-static model. ... 81
Fig. 5-8 Calculated optical extinction spectra of Ag/Au core-shell nanoparticles by Quasi-static model. The core radii are (a)5 nm (b)10 nm (c)15 nm (d)20nm and with different shell thickness. ... 81
Fig. 5-9 Calculated optical extinction spectra of Au/Ag core-shell nanoparticles by Quasi-static model. The core radii are (a)5 nm (b)10 nm (c)15 nm (d)20nm and with different shell thickness. ... 82
Fig. 5-10 Calculated optical extinction spectra of hollow Au nanoparticles by Quasi-static model. The hollow part radii are (a)5 nm (b)10 nm and with different shell thickness. .. 82
Fig. 5-11 Calculated optical extinction spectra of Au nanoparticles .We use Drude model coefficient and calculate by classical Mie theory. ... 83
Fig. 5-12 Calculated optical extinction spectra of Ag nanoparticles .We use Drude model coefficient and calculate by classical Mie theory. ... 83 Fig. 5-13 Calculated optical extinction spectra of Ag-Au alloy nanoparticles .We use
xvii
Drude model coefficient and calculate by classical Mie theory. ... 84 Fig. 5-14 Calculated optical extinction spectra of Au nanoparticles .We use Drude model
coefficient and calculate by Quasi-static theory. ... 84 Fig. 5-15 Calculated optical extinction spectra of Ag nanoparticles .We use Drude model
coefficient and calculate by Quasi-static theory. ... 85 Fig. 5-16 Calculated optical extinction spectra of Ag-Au alloy nanoparticles .We use
Drude model coefficient and calculate by Quasi-static theory. ... 85 Fig. 5-17 Calculated optical extinction spectra of Au/Ag core-shell nanoparticles .We use
Drude model coefficient and calculate by Quasi-static theory. The core radii are (a)5 nm (b)10 nm (c)15 nm (d)20nm and with different shell thickness. ... 86 Fig. 5-18 Calculated optical extinction spectra of Ag/Au core-shell nanoparticles .We use
Drude model coefficient and calculate by Quasi-static theory. The core radii are (a)5 nm (b)10 nm (c)15 nm (d)20nm and with different shell thickness. ... 86 Fig. 5-19 Calculated optical extinction spectra of hollow Au nanoparticles .We use Drude
model coefficient and calculate by Quasi-static theory. The hollow part radii are (a)5 nm (b)10 nm and with different shell thickness. ... 87
1
第一章 緒論
奈米材料由於量子尺度效應,使其展現出各種異於傳統薄膜或是塊材之獨特物理及 化學特性。以「中空(hollow)」Au 與 Ag 奈米粒子為例,所形成的 Shell、Box 或是 Cage 等結構,在近年來受到相當之注目。從其中空結構上之特點來看,其較實心(solid)奈米 粒子,具有更大之比表面積、更低之密度、使用更少之原料(成本),再加上立體框架結 構等特性,均能符合未來對奈米粒子應用發展之期望。另外,從中空奈米粒子的特性來 看,由於表面電漿子所造成的特性以及觸媒活性,與實心奈米粒子截然不同,因此本研 究希望能藉由控制奈米粒子的結構以及組成成分,來獲得不同特性之各式奈米粒子,期 待能在電學、光學以及觸媒上有所應用。另外值得一提的是,在生醫方面的研究中指出, 中空結構的奈米粒子由於內層和外層金屬會彼此產生交互作用,鍵結與未鍵結電子的能 階差異大,所以在 UV-Vis 吸收光譜上可以呈現較大之位移,使其易於觀察,在未來後 續的應用方面,提供極大的可能性。由此可知,中空結構奈米粒子較實心奈米粒子具有 更大的應用潛力,然而,有關中空奈米粒子的相關研究,從合成到性質分析,至今仍屬 少數,為此,本論文研究方向將主要分成兩個部分: 1. 製程與結構之關係探討: a. Ag 奈米粒子的尺寸對中空 Ag-Au 合金奈米粒子結構合成之影響。 b. 形成過程的 Ex-situ 觀察。 c. 不同合金系統(Ag-Pt)特殊中空結構之合成。 2. 結構與光學之關係探討:
a. 利用 Mie Theory 計算實心及空心奈米粒子之 UV-Vis absorbance 光譜。 b. 藉由理論值與實驗值之比較,得到最佳的光學參數結果。
2
第二章 文獻回顧與實驗原理
2-1 金屬奈米粒子之製備
奈米粒子的製備方法可分為(1)物理製備方法與(2)化學製備方法,其優缺點如下表 所示:
Table 2-1 Physical reduction process of nanoparticles.
物理方法 內容 特點 氣相冷凝法 用真空蒸發、加熱、高頻感應等方 法使原料氣化或形成等粒子體,然 後驟冷。 純度高、結晶組織好、粒度可控制。 物理粉碎法 通過機械粉碎、電火花爆炸等方法 得到奈米粒子。 操作簡單、成本低,但產品純度低, 粒子分佈不均勻。 機械球磨法 採用球磨方法,控制適當的條件到 純元素、合金或複合材料的奈米粒 子。 操作簡單、成本低,但產品純度低, 粒子分佈不均勻。 熱分解法 利用加熱到高溫的方式將複合物 分解以製備奈米複合材料,如在真 空狀態下,以約 300 度 C 的高溫 熱 分 解 複 合 物 Si8O12H6 〃 (CoCCo4)2可得到包含有 Co2C 奈 米微粒的非晶體矽複合材料 有機金屬前驅物的熱穩定性不佳, 且在高溫下分解時易產生 CO 等有 毒氣體,影響製程上之品質。
Table 2-2 Chemical reduction process of nanoparticles.
化學方法 內容 特點 檸檬酸鈉 還原法 配置金屬奈米粒子的溶液,到達 溶 液 的 沸 點 時 (Ex: 水 溶 液 =100 ℃),再加入還原劑檸檬酸鈉與其 反應,生成奈米粒子。 方法簡單且較容易控制粒子尺寸, 形成的奈米粒子穩定,可應用的範 圍廣泛。 沈澱法 把 沈 澱 劑 加 入 到 鹽 溶 液 中 反 應 後,將沈澱熱處理得到奈米材料。 簡單易行,但純度低,粒子半徑大, 適合制備氧化物。 水熱法 高溫高壓下在溶液或蒸汽等流體 中合成,再經分離和熱處理得奈 米粒子。 純度高,分散性好、粒度易控制。 溶膠凝膠法 金屬化合物經溶液、溶膠、凝膠 而固化,再經低溫熱處理而生成 奈米粒子。 反應物種多,產物粒子均一,過程 易控制,適於氧化物和 II~VI 族化 合物的制備。
3 微乳液法 兩種互不相溶的溶劑在表面活性 的作用下形成乳液,在微泡中經 成核、聚結、團聚、熱處理後得 奈米粒子。其特點粒子的單分散 和介面性好,II~VI 族半導體奈米 粒子多用此法制備。 在水系中,濃度控制需相當嚴謹, 才能有效合成出粒徑分布均ㄧ的奈 米金屬粒子。 化學氣相 沈積法 利用金屬化合物蒸氣的化學反應 合成奈米材料。 產品純度高,粒度分佈窄。
2-2 二元實心金屬奈米粒子
金屬奈米粒子因為具有獨特的光學性質而廣為被人們所研究,貴金屬像是 Au、 Ag、Cu 等在可見光波段具有吸收峰,因此其水溶液相之顏色與塊材型態截然不同。而 此些吸收峰之位置受到電場引起之導電電子震盪,以及表面電漿子之共振的影響甚鉅。 G.Mie[1,2]首先以古典的電磁學理論解釋了此現象,其理論是建立在球形粒子之上,並 且以適當的邊界條件解出 Maxwell 方程式,用以計算小尺寸金屬粒子之 UV-Vis 吸收光 譜。 關於奈米粒子的研究,早在 1857[3]年,Faraday 發現將溶於二硫化碳(Carbon disulfide, CS2)的磷與溶有四氯金酸(Gold(III) chloride hydrate, HAuCl4〃xH2O)的水溶液劇烈混合,可將 Au 離子還原形成深紅色溶液,乾燥後可得緻密的薄膜。Faraday 對此 Au 粒子溶液所形成的薄膜進行光學特性的探討,發現隨著外加壓力的改變,薄膜的顏色也 會由亮紫色到綠色產生可逆的變化。但是,由於當時鑑定儀器尚未成熟,所以無法解釋 上述現象。直到 1980 年代,電子顯微鏡的發展逐漸成熟,才發現其實是由於這些小於 100 nm 的微小分子團(colloids)因為量子效應的影響,使其具備不同於塊材的特殊性 質。1951[4]年由 Turkevitch 所發展出使用檸檬酸(Citrate),同時作為保護劑與還原劑還 原四氯金酸的水溶液,並且形成穩定的水相懸浮液,為合成 Au 奈米粒子的先驅。
2-2-1 合金結構之奈米粒子
二元金屬或三元金屬奈米粒子,如果依照奈米粒子中金屬分佈的情況來分類,主要 可分為兩種形式,一為合金型(alloy)奈米粒子,另一則是核-殼型(core-shell)奈米粒子。 所謂合金型奈米粒子,指的是兩種或多種金屬原子以均勻的方式分佈於整個粒子之中,4 而核-殼型(core-shell),指的則是以其中一個金屬為核心,而另一種金屬則成長於核外而 形成一殼層,稱為核-殼型奈米粒子。 關於合金奈米粒子方面的應用研究,主要是由於合金奈米粒子具有獨特的觸媒、電 學、光學、結構以及熱力學的性質[5-9],舉例來說,Au-Ag 奈米粒子對低溫的 CO 氧化 以及酒精的需氧性氧化皆有良好的觸媒效果[10,11]。此外二元合金也能應用於觸媒、感 測器、奈米電子元件[12-18]和生物感測器[19],而此些性質往往與奈米粒子之形貌、尺 寸,以及組成相關。二元金屬合金的奈米粒子諸如 Pt-Ru、Cu-Pd、Pt-Mo、Pt-W、Pt-Ni、 Au-Ag 的組成和結構對觸媒性質,乃至於光學特性的影響已經被廣泛的研究[20-23]。 另一方面,Au-Ag 二元金屬,由於結構上的差異(合金結構或是核殼結構),在光學 性質上有著完全不同的表現,即便組成相同亦有完全不同的結果。例如,Au-Ag 合金奈 米粒子在表面電漿共振光譜(SPR)中呈現單一吸收峰,吸收峰介於純 Au、Ag 奈米粒子, 而核殼奈米粒子則隨核殼之尺寸,而呈現完全相異之特質。 關於 Au-Ag 奈米合金奈米粒子的合成,首先是由 Papavassiliou[24]等人以 2-丁醇為 溶劑,使用氣相法(vapor condensation)製造出粒徑 10 nm 之 Au-Ag 合金奈米粒子。同時
發現其電漿子吸收之最大值與合金的組成呈線性關係。Liz-Marzan[25]等人利用 NaBH4
還原法在水溶液中還原 Au、Ag 奈米粒子,並利用無機纖維當作穩定劑,來得到半徑 2-3 nm 之 Au-Ag 奈米粒子。Teo[26]等人合成 Au18Ag20之 Au-Ag cluster,其在 495 nm 有單
一吸收峰。Perng[27]等人製備出 Ag-Pd 合金奈米粒子,發現其於氫氣的純化與分離上具 有良好效果,可應用於薄膜反應器。Toshima[28,29]等人則以醇還原法製得 Cu-Pd、 Cu-Pt、Au-Pd 二元金屬奈米粒子。El-Sayed[30]利用檸檬酸鈉同時還原 Au 與 Ag 離子,
藉以產生 Au-Ag 合金奈米粒子。Shi[31]等人則發現,隨著 Ag 濃度的增加,AgxAu1-x合
金奈米粒子之 SPR 吸收峰的最大值會從原本的 524 nm 朝 400 nm 移動。Chen[32]利用微 乳化法來製備 Au-Ag 二元金屬,而 Chan[27]利用微乳化法製備出的 Pt-Ru 二元金屬奈米 粒子,其在甲醇氧化的催化應用上,具有良好的催化效果。Nuzzo[33,34,35]等人將 PtRu(CO)5 以還原冷凝法(reductive condensation)成功製備 PtRu/C 二元金屬奈米粒子。
Yeh[36,37,38]則利用高能脈衝雷射照射 Au 與 Ag 奈米粒子前趨物混合溶液中,成功製得 Au-Ag 合金奈米粒子,其後,再以相同方法成功製備出 Au-Pd、Ag-Pd 及 Au-Ag-Pd 合 金奈米粒子。Kim[39]等人則直接使用 Au-Ag 合金金屬片,於水溶液中,以高能脈衝雷 射光打擊金屬片,也得到 Au-Ag 合金奈米粒子。Delcourt[40]則以光化學法製備出團聚 的 Au-Pt、Ag-Pt 二元金屬奈米粒子。Han[41]等人提出 dodecanethiol-derivatized 形式的
5
Ag-Au 合金。Link[42]等人將 AgNO3和 HAuCl4以共還原的方式加入檸檬酸鈉還原得到
Ag-Au 的合金。Hostetler[43]等人所做出的 Ag-Au 合金的 cluster 可在溶液形式中分離, 並且不會再混合。Esumi[44]等人在乙醇溶液中 coating PVP 之後再以 laponite suspensions 的方式製備 Au-Ag 合金的奈米粒子。Toshima[45,46]等人製備出 Cu-Pd 合金奈米粒子, 發現其對於丙烯腈催化成丙烯醯胺具有極高的轉化率,且更具高穩定性。
2-2-2 核殼結構之奈米粒子
關於二元金屬奈米粒子的核殼結構研究,較為重要的事件如下:
Mizukoshi[8]等人以超音波共振法製備出 Au/Pd 的核殼奈米粒子,並探討其對 4-戊 烯酸氫化的催化效果,發現 Au:Pd 比例為 1:4 時,催化效果約為 Pd 奈米粒子的 3 倍。 Mulvaney[47]和 Sinzig[48,49]製備了 Ag/Au 核殼結構奈米粒子,並發現隨著殼層厚度的 不同,而存在有兩個吸收峰。Natan[50]先製備出 Au 奈米粒子,再將 Ag 鹽加入 Au 奈米 粒子的溶液中,並使其還原於 Au 奈米粒子表面上,藉以形成 Au 核 Ag 殼的二元金屬核 殼奈米粒子。Bruzzone[51]等人則指出在 Ag/Au 核殼奈米粒子結構中,組成與線性光學 性質的關係,並提出 Drude 和 Quantum-mechanical (DFT theory)模型來說明二元金屬粒 子的介電性質。而 Jian[52]則提出,無論是合金結構或是核殼結構,隨著 Au 濃度的增加, 吸收光譜的最大值都會朝向長波長的部分偏移。
Fig. 2-1 UV-vis spectra of Ag core (black) and Ag/Au core-shell with a shell thickness of one monolayer (red) and two monolayers (blue). The inset shows Ag/Au core-shell with a shell thickness of one monolayer (red) and Ag/Au alloy nanoparticles.[60]
6
Fig. 2-2 Core (Rc =3 nm): Ag; Shell (variable thickness): Au. Bulk dielectrical data are deduced from Drude model. [52]
Fig. 2-3 Absorption cross-section versus wavelength for AgcoreAushell nanospheres with
different relative Au composition. With the increasing Au content, the absorption peak decreases and red-shifts.[47]
2-3 二元中空結構之奈米粒子
Halas[53]等人做出 Au 的奈米殼層,說明在 1~2 nm 的 Au 奈米粒子可以吸附在 Si 的表面,並且會自聚合成 monolayer,並且證明表面電漿效應的影響,而且能應用在全 身血液的快速檢驗上,並且說明 Au 的奈米殼層會受殼層的厚度以及核的尺寸影響,從 600 nm 位移到 1200 nm;Xia[54]等人以 Ag(基板)以及四氯金酸,用化學取代的方法做 出不同成分的中空殼層結構,並提出中空結構的奈米 Au 粒子對於表面電漿共振的影響7
比實心的 Au 粒子更靈敏。表面電漿共振的頻率受粒子大小、形狀、以及表面官能基的 影響,而對中空結構來說,頻率則受核殼元素的厚度影響,而近年來結構朝向中空形式 發展的原因,主要是因為相對於實心的結構來說,它們密度較低、表面積較大,舉例來 說 Yin [55]等人提出奈米 Pd 殼層的結構對 Suzuki coupling 反應能有較佳的反應性,並且 可以取代實心的 Pd 結構。
Younan Xia 與 Yugang Sun[56]首先以 Ag 奈米粒子做為反應的基板,之後加入
HAuCl4進行取代反應,理論上,所使用的 Ag 奈米粒子的形狀,和最後所合成出來的中
空 Au 奈米粒子的形狀會是相同的,反應的示意圖如 Fig. 2-4.
Fig. 2-4 Schematic illustration of the experimental procedure that generates nanoscale shells of gold from silver templates with various morphologies. The reaction is illustrated in the schematic as follows: (A) Addition of HAuCl4 to a dispersion of silver
nanoparticles and initiation of the replacement reaction;(B) The continued replacement reaction of HAuCl4 with the silver nanoparticles; (C) Depletion of silver
and annealing of the resultant shells to generate smooth hollow structures. Note that the shape of each silver nanoparticle is essentially preserved in this template-engaged reaction. [56]
而從 Fig. 2-5 的 UV-Vis 光譜圖可以看到,反應前的 Ag 奈米粒子在 422 nm 有一個
明顯的吸收峰,隨著 HAuCl4的加入,422 nm 的吸收峰值逐漸下降,另外一個明顯的吸
8
Fig. 2-5 UV-Vis absorption spectra of an aqueous dispersion of silver nanoparticles (~50 nm in diameter) before and after various volumes of 1 mM HAuCl4 aqueous solution had
been added. There existed an isosbestic point at ~530 nm.[56]
而由 TEM 影像可以觀察到合成所得之 Au 奈米粒子確實產生中空結構,Fig.2-6(A) 為實心的 Ag 奈米粒子,Fig.2-6(B,C)則為所合成之中空 Au 奈米粒子。
Fig. 2-6 (A) TEM image of silver nanoparticles synthesized using the polyol process. (B, C) TEM and SEM images of gold nanoshells formed by reacting these silver nanoparticles with an aqueous HAuCl4 solution. [56]
9
在之後的文獻中[57],該團隊再度對 UV-Vis 光譜提出討論,首先是 Ag-Au alloy 的 討論,從光譜中可以得知,隨著 Au 的莫耳比例逐漸增加,光譜將會產生紅位移的現象, 最後將只呈現 Au 奈米粒子的吸收峰。
Fig. 2-7 (A) UV-visible extinction spectra of solid colloids made of pure silver, pure gold, and silver/gold alloys with various molar fractions of gold.All spectra were normalized against their peak extinctions. (B) A plot showing the linear dependence between the extinction peak position (λmax) and the molar fraction (xAu) of gold in the nanoparticles: λmax = 412 +1.13xAu.[57]
可以將吸收峰的最高值隨著 Au 奈米粒子的含量作圖,得到兩者呈現線性的關係, 並且得到關係式 :
而吸收峰的最大值則會介在實心的 Au、Ag 奈米粒子中間,大約是 410 nm~510 nm 之間;另外文獻中也提出實心的 Au 奈米粒子以及中空 Au 奈米粒子的比較:
10
with HAuCl4 and (B) gold solid colloids with diameter of ~ 30 nm.[57]
圖 A 為中空 Au 奈米粒子,圖 B 為實心 Au 奈米粒子的 TEM 圖,可以明顯的由圖 中觀察到兩者在形貌上有明顯的差異;
(C) UV-visible extinction spectra and (D) photographs of aqueous dispersions of gold nanoshells (e, ~ 25 nm in core diameter) after their surfaces had been electrolessly plated with gold of various thicknesses (b–d). As a comparison, the spectrum and photograph of a dispersion of gold solid colloids ( ~ 30 nm in diameter) were also shown (a). [57] 而從 Fig. 2-8(C)的 UV-Vis 的光譜中也可以發現,實心的 Au 奈米粒子吸收峰大約位 於 520 nm 左右,而中空的 Au 奈米粒子隨著殼層厚度的增加,光譜呈現明顯的藍位移, 約略是從 760 nm 位移到 560 nm,因此我們可以由 UV-Vis 光譜中以及溶液的顏色,簡 易的判別所合成出來的 Au 奈米粒子的結構,以及其殼層的厚度,進而搭配其他儀器的 檢測加以判定。 另外,文獻中也根據以理論計算的方式,比較在不同折射率的介質當中,相同尺寸 之下,實心的 Au 奈米粒子以及中空 Au 奈米粒子的吸收峰變化情形,以水的折射係數 (n=1.33)為基準,和其他介質做比較,可以發現在相同奈米粒子大小之下,中空 Au 奈米 粒子受到介質的影響比實心 Au 奈米粒子來的大,兩者的斜率分別是 328.5 以及 66.5 (nm/refractive index unit),可以說明中空 Au 奈米粒子對於環境變化的靈敏度比實心 Au 奈米粒子來的好(大約是五倍左右),此外由於中空奈米粒子具有低密度、低材料使用量、 較大的表面積、並且在 SPR 光譜上有特殊且明顯的吸收峰,因此成為日後廣為被科學家 研究。而發展的趨勢也朝向(1)殼層的厚度(2)中空結構尺寸的大小,兩方面探討。
11
Fig. 2-9 Plots of the dependence of peak shift (Δλmax, relative to the peak position calculated for water with n = 1.33) on the refractive index of surrounding medium. The sensitivity factors, Δλmax/n, were 328.5 and 66.5 nm RIU21 for gold nanoshell (with a core diameter of 25 nm and a wall thickness of 2 nm) and solid colloid (with diameter of 25 nm),respectively. [57]
2-4 製備原理
2-4-1 伽凡尼取代反應
氧化(oxidation)原始的定義為物質與氧化合生成氧化物的反應;而還原(reduction) 則為氧化物失去氧的反應。例如:煤焦的燃燒(氧化反應): 2C(s) + O2(g) → 2CO(g)鐵礦 的煉製(還原反應): Fe2O3(s) + 3C(s) → 2Fe(l) + 3CO(g)但此種以物質和氧化合生成氧化 物或從氧化物中失去氧的觀點,來定義氧化還原反應(redox reaction)過於狹隘,常無法 說明某些化學反應。例如:把 Cu 片放入 AgNO3溶液中,則 Cu 片溶解而析出 Ag,該反應並無氧的參與,故無法以狹義的定義來說明。Cu(s) + 2Ag+(aq) → Cu2+
(aq) + 2Ag(s)若 以電子的觀點而言,有電子轉移的化學反應,稱為氧化還原反應,即為氧化半反應與還 原半反應組合而成,而且兩半反應必須同時發生而且同時結束。失去電子的半反應稱為 氧化半反應;而得到電子的半反應則稱為還原半反應,兩個半反應中電子的得失數目相 等,所以整個反應系統維持電性孚恆的狀態。另外也能以氧化數(oxidation number)的觀 點來說明,原子在反應後,氧化數增大的反應,稱為氧化;氧化數減少的反應,稱為還 原。
12
而所謂的伽凡尼取代反應,就是一種氧化還原反應,以 Xie 等人所合成的 Au-Ag
奈米殼層為例子來說:將四氯金酸(HAuCl4)加入前驅物 AgNO3中,反應方程式如下:
3Ag(s) + AuCl4-(aq) Au(s) + 3Ag+(aq) + 4Cl-(aq)
其中,Ag 失去電子發生氧化反應,而 Au 得到電子發生還原反應。不同物質間氧 化還原的角色,則是取決於彼此之間,何者較易失去電子,何者較易得到電子,即還原 電位的高低,還原電位較低者,較易失去電子,發生氧化反應。
2-4-2 Kirkendall effect
當二元溶體中不同組成原子具有不同的擴散速率時,高擴散率元素的右邊區域會有 質量損失,因它得到的原子少於失去的;反之,低擴散率元素的左邊會有質量的增加, 使得試片右邊及左邊分別會造成收縮及膨脹的現象。依上述效應,當二種原子之擴散速 率相差甚大的時候會產生另一情況,即損失質量之擴散區域會形成孔隙。即每當原子躍 遷一次,一空孔就會往反方向移動一步,二種原子之不相等量流量時,會產生一淨流量 的空孔往反向流動。最後,二種不同成分組合而成的擴散偶合機構,導致原始界面有移 動的現象發生。Fig. 2-10 Schematic of the Kirkendall effect.
2-4-3 取代機制
2-4-3-1 Alloy process
根據文獻,由於 AuCl4-/Au 的標準氧化還原電位(0.99V)比 Ag+/Ag(0.8V)來的大,所
13 Fig. 2-13、Fig. 2-14),反應式如下:
3Ag(s) + AuCl4-(aq) Au(s) + 3Ag+(aq) + 4Cl-(aq)
Fig. 2-11 The schematic illustration the proposed mechanism for the formation of gold truncated octahedra. A truncated cuboctahedron is used to represent the starting spherical silver nanocrystal. A replacement reaction between gold and silver removes silver atoms preferentially from (111) facets, while depositing gold atoms selectively to higher energy facets such as (100) and (110).[58]
Fig. 2-12 (A) HRTEM image of a silver nanocrystal, confirming spherical morphology and single crystalline structure. (B-D) HRTEM images of gold hollow nanocrystals, showing a faceted morphology and a single crystalline domain within each particle: (B) imaged along the <100> direction and (D) imaged along the <110> direction. Various views of the faceted nanocrystals are consistent with a truncated octahedron as the dominant particle shape, as illustrated schematically.[58]
14 加入四氯金酸的時候,Au 會先不規則的吸附在 Ag 奈米粒子的{110}面上,此外,由於 一個 Au 奈米粒子可置換三個 Ag 奈米粒子,所以在{110}面上會形成微小的孔洞(如 Fig. 2-13);由於 Au 奈米粒子置換 Ag 奈米粒子的速度較快,且兩者皆為 FCC 結構,所以會 形成內部是中空結構,而外部則是合金(Au rich)的殼層結構;當加入的 Au 奈米粒子達 到一定的程度的時候,孔洞會被表層的 Au 奈米粒子所形成的殼層阻擋,使得在內部的 Ag 奈米粒子無法再被置換出來,此過程我們稱為 Alloy process。
2-4-3-2 Dealloy process
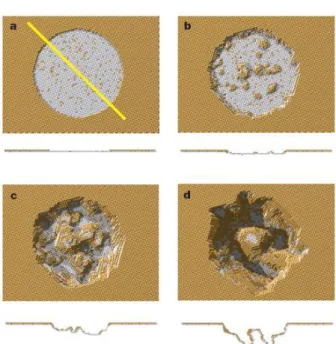
當加入過量的 Au 的時候,在合金殼層結構中,位於殼層外部 Ag 奈米粒子會被置 換出來,但少部分存在於內部的 Ag 奈米粒子則無法擴散出來,而相鄰的 Ag 奈米粒子 會傾向團聚在一起的現象,形成少部分 Ag 奈米粒子和 Au 奈米粒子(rich)的殼層結構, 此過程我們稱為去合金化(dealloy)(如 Fig. 2-15)。Fig. 2-13 Simulated evolution of an artificial pit in Au10%Ag90% (atomic%), Φ=1.8 eV. Cross sections along the (111) plane defined by the yellow line in a are shown below each plan view. (a), The initial condition is a surface fully passivated with gold except within a circular region (the “artificial pit”). (b), After 1 s, the pit has penetrated a few monolayers into the bulk. We note how there are fewer gold clusters near the side wall than at the centre of the pit. (c), After 10 s, a gold cluster has nucleated in the centre of the pit. (d), At 100 s, the pit has split into multiple pits.[59]
15
第三章 實驗方法與步驟
3-1 實驗藥品
Table 3-1 The chemicals used for preparing the experimetanl nanoparticles.
藥品名稱 廠牌
AgNO3 (silver nitrate) Mallinckrodt
HAuCl4(hydrogen tetrachloroaurate hexahydrate) STREM CHEMICALS
H2PtCl6(Dihydrogen hexachloroplatinate hydrate) ACROS
NH4OH (Ammonia solution) SHOWA
NaBH4(Sodium borohydride)檸檬酸鈉 Riedel-de Haen
C6H5Na3O7‧2H2O (Sodium Citrate) J.T.Baker
Polyvinylpyrrolidone (PVP Mw 58000) ACROS C6H8O6 (L(+)ascorbic acid) 維他命 C 酸 Panreac
3-2 實驗設備
儀器名稱 廠牌及型號
X 光繞射儀 SIEMENS , D5000
UV-Vis 紫外光/可見光吸收光譜儀 (UV-Vis spectroscope)
Thermo Scientific /Evolution 300 BB 場發射高分辨穿透式電子顯微鏡
(Field Emission HRTEM)
JEOL /JEM-2100F
高速離心機 HITACHI , CF15RXII
真空烘箱 電子天秤
能譜分析儀(TEM/EDS) Oxford Instruments
16
3-3 實驗方法
3-3-1 Ag-Au 合金奈米粒子的製備方法
1. 配製 25ml 濃度 1mM 的 AgNO3水溶液。 2. 加入 25ml 濃度 1.0mM 的 HAuCl4。 3. 加入 2ml 濃度 0.007mM 的 Sodium citrate。 4. 將溶液加熱到 100℃,並且持溫一小時。Fig. 3-1 Process of synthesizing Ag-Au alloy nanoparticles by aqueous process. 加熱到 100℃,並且持溫一小時
配製 25ml 濃度 1mM 的 AgNO3水溶液
加入 25ml 濃度 1.0mM 的 HAuCl4
17
3-3-2 Au/Ag 核殼奈米粒子的製備方法
製備 Au 奈米粒子 1. 取 33ml 濃度 1.0mM 的 HAuCl4加熱至 100℃。 2. 加入 5ml 濃度 1%的 Sodium citrate 並且持溫一小時。 製備 Au/Ag 核殼奈米粒子 1. 取上述步驟合成的 Au 奈米粒子溶液 5ml 加入 30ml 去離子水。2. 之後依序加入 1ml 濃度 38.8mM 的 Sodium citrate、1.2ml 濃度 10mM 的 AgNO3、
0.4ml 濃度 100mM 的 ascorbic acid。 3. 將溶液加熱到 100℃,並且持溫一小時。
冷卻至室溫
Fig. 3-2 Process of synthesizing pure Au and Au/Ag core-shell nanoparticles by aqueous process. 依序加入 1ml 濃度 38.8mM 的 Sodium citrate、 1.2ml 濃度 10mM 的 AgNO3、0.4ml 濃度 100mM 的 ascorbic acid 加熱到 100℃,並且持溫一小時 加入 5ml 濃度 1%的 Sodium citrate,持溫一小時 取上述溶液 5ml 並且加入 30ml 去離子水 取 33ml 濃度 1.0mM 的 HAuCl4溶液加熱至 100℃
18
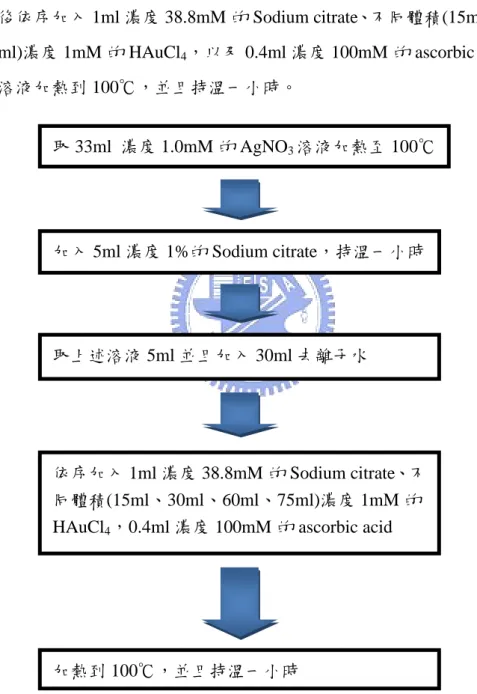
3-3-3 Ag/Au 核殼奈米粒子的製備方法
製備 Ag 奈米粒子 1. 配製 33ml 濃度 1mM 的 AgNO3水溶液並加熱至 100℃。 2. 加入 5ml 濃度 1%的 Sodium citrate 並且持溫一小時。 製備 Ag/Au 核殼奈米粒子 1. 取上述步驟合成的 Ag 奈米粒子溶液 5ml 加入 30ml 去離子水。 2. 之後依序加入 1ml 濃度 38.8mM 的 Sodium citrate、不同體積(15ml、30ml、60ml、 75ml)濃度 1mM 的 HAuCl4,以及 0.4ml 濃度 100mM 的 ascorbic acid。3. 將溶液加熱到 100℃,並且持溫一小時。
Fig. 3-3 Process of synthesizing pure Ag and Ag/Au core-shell nanoparticles by aqueous process.
依序加入 1ml 濃度 38.8mM 的 Sodium citrate、不 同體積(15ml、30ml、60ml、75ml)濃度 1mM 的 HAuCl4,0.4ml 濃度 100mM 的 ascorbic acid
加熱到 100℃,並且持溫一小時
加入 5ml 濃度 1%的 Sodium citrate,持溫一小時
取上述溶液 5ml 並且加入 30ml 去離子水
19
3-3-4 中空 Ag-Au 合金奈米粒子的製備方法
製備 Ag 奈米粒子 1. 配製 20ml 濃度 4.0 mM 的 AgNO3 : 取所需的 AgNO3溶入 20 ml 去離子水可得 20ml 濃度 4.0mM 的 AgNO3。 2. 將步驟 1 所配置的溶液,加入 10 倍重量的 PVP(Mw=58000),隨後加熱到 60°C, 並且持溫 10 分鐘。 3. 配製 4.0 ml 濃度 2.64 mM 的 NaBH4:取所需的 NaBH4溶入 4ml 去離子水可得 4 ml 濃度 2.64 mM 的 NaBH4。 4. 將步驟 3 所配製的溶液加入步驟 2 的溶液當中,持溫一小時,等到反應完全之 後,即可得到黃褐色的 Ag 奈米粒子之溶液。 加熱到 60°C 並且持溫 10 分鐘 持溫一小時 等到反應完全之後再冷卻到室溫Fig. 3-4 Process of synthesizing 1hr reaction time at 60°C Ag nanoparticles by aqueous process. 配製前驅物 AgNO3溶液加入,並且加入前驅物 AgNO310 倍重量的 PVP(Mw=58000) 配製還原劑 NaBH4溶液 將還原劑加到前驅物溶液中 黃褐色 Ag 奈米顆粒的溶液
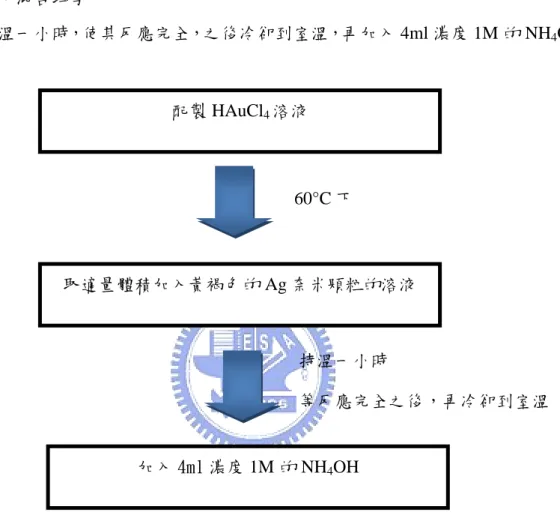
20 製備中空 Ag-Au 合金奈米粒子 1. 配製 500ml 濃度 1.0mM 的 HAuCl4 : 取所需的 HAuCl4溶入 500ml 去離子水可得 500ml 濃度 1.0mM 的 HAuCl4。 2. 在 60°C 下,將步驟 1 所配製的溶液取適量的體積加入之前所製備的 Ag 溶液當 中,混合均勻。 3. 持溫一小時,使其反應完全,之後冷卻到室溫,再加入 4ml 濃度 1M 的 NH4OH。 60°C 下 持溫一小時 等反應完全之後,再冷卻到室溫
Fig. 3-5 Process of synthesizing hollow Ag-Au alloyed nanoparticles by aqueous process. 配製 HAuCl4溶液
取適量體積加入黃褐色的 Ag 奈米顆粒的溶液
21
3-3-5 中空 Ag-Pt 合金奈米粒子的製備方法
1. 配製 500ml 濃度 1.0mM 的 H2PtCl6 : 取所需的 H2PtCl6溶入 500ml 去離子水可得 500ml 濃度 1.0mM 的 H2PtCl6。 2. 在 60°C 下,將步驟 1 所配製的溶液取適量的體積加入之前所製備的 Ag 溶液當 中,混合均勻。 3. 持溫一小時,使其反應完全,之後冷卻到室溫,再加入 4ml 濃度 1M 的 NH4OH。 60°C 下 持溫一小時 等反應完全之後,再冷卻到室溫Fig. 3-6 Process of synthesizing hollow Ag-Pt alloyed nanoparticles by aqueous process. 取適量體積加入黃褐色的 Ag 奈米顆粒的溶液
加入 4ml 濃度 1M 的 NH4OH
22
3-4 奈米粒子的光學性質測量
3-4-1 紫外光-可見光吸收光譜(UV-vis absorption spectra)
(1) 進行參數設定:Photometric Mode選擇Absorbance,Band Width 調整為0.5nm, Scanning Speed設定成600 nm/min,掃描起點波長為200 nm,掃描終點波長為 1100 nm,Data Interval為1 nm。 (2) 將兩個注滿溶劑的石英比色槽(cell)分別放置於參考槽與樣本槽兩個槽內,測量 baseline。 (3) 將樣本槽換上欲測樣品,開始樣品的測量。
3-4-2 X 光繞射分析(XRD)
(1) 奈米粒子洗淨步驟:將去離子水加入奈米粒子的溶液中,體積比為水:奈米粒 子溶液=5:1,接著使用高速離心機,使奈米粒子與溶液分離,轉速為15,000 r.p.m.,離心時間為30分鐘。將離心後上層澄清溶液取出。此清洗步驟重複3~6 次。 (2) 試片製作方法:將清洗過的奈米粒子膠體溶液滴在矽基板上,使其乾燥,重覆 此乾燥步驟直到全部溶液使用完畢。(3) 掃描模式為Detector Scan (2-theta scan),操作電壓為40 kV,電流為40 mA,掃描 方式為step mode,掃描速度為0.02°/sec,掃描範圍為30°至80°。
3-4-3 場 發 射 穿 透 式 電 子 顯 微 鏡 (Field Emission Transmission Electron
Microscope, FETEM)
(1) 重複奈米粒子洗淨步驟。 (2) 試片製作方法:將200 mesh之鍍碳Cu網浸入清洗過重新散佈的奈米粒子之溶液 中約一分鐘。 (3) 將浸泡過之鍍碳Cu網取出,並置於室溫下待其自然乾燥。 (4) 放入穿透式電子顯微鏡內拍照。23
第四章 奈米粒子之結構及光學特性分析
4-1 Ag-Au 合金奈米粒子
4-1-1 結構特性分析
TEM 分析
從 Fig. 4-1 HRTEM 觀察我們可以發現所合成之奈米粒子(Ag:Au=1:1),具有不規則 實心球型樣貌,但由於 Ag(a=0.4077 nm)、Au(a=0.4079 nm)晶格常數相當接近,雖然由 此晶格像可以得知面間距為 0.239 nm,確實極為接近 Ag 或 Au(111),卻不足以得知是 否為 Ag-Au 合金。藉由 TEM/EDX 分析(Fig. 4-2, Table 4-1),可以發現中心部之 Ag:Au 比例接近 1:1,顯示確實已形成 Ag-Au 合金,而不是個別形成 Au 或 Ag 奈米粒子。但需 注意的是,粒子外部成份卻與中心部相異,是富 Ag 之 Ag-Au 合金,推測此現象是由於 在相同還原條件之下,Au 前趨物較 Ag 前趨物具有更快之還原速率,故還原較慢的 Ag 附著於粒子表面,形成此表面富 Ag 之 Ag-Au 合金奈米粒子。
24
Fig. 4-1 HRTEM images of Ag-Au alloyed nanoparticles (Ag:Au=1:1).
(a) (b)
Fig. 4-2 HRTEM/EDX results of (a) inner part and (b) outer part of Ag-Au alloyed nanoparticles (Ag:Au=1:1).
Table 4-1 HRTEM/EDX results of (a) inner part and (b) outer part of Ag-Au alloyed nanoparticles (Ag:Au=1:1).
Element Weight% Atomic%
Ag L Inner 34.46 48.98
Outer 62.92 75.60
Au L Inner 65.54 51.02
25
SEM 分析
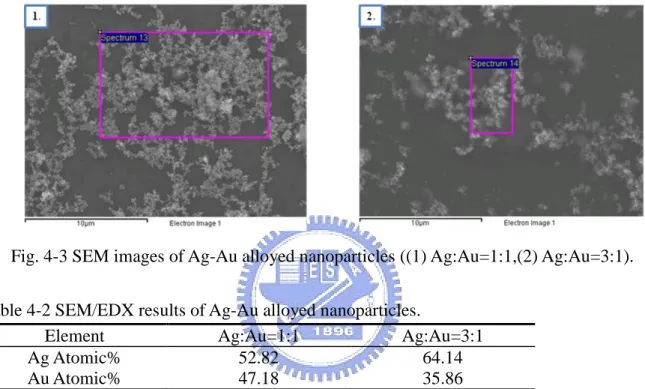
利用 SEM/EDX 分析(Fig. 4-3, Table 4-3)發現與 TEM/EDX 的成份比十分接近 (Ag:Au=1:1),與實驗所設計之成份比例接近,但反觀 Ag:Au=3:1 之試樣,與實驗所設 計之成份比例並非完全吻合,提高 Ag 前趨物的濃度至三倍,並無法成為 Ag:Au=3:1 之 成份,而僅獲得接近 Ag:Au=2:1 之比例。
Fig. 4-3 SEM images of Ag-Au alloyed nanoparticles ((1) Ag:Au=1:1,(2) Ag:Au=3:1).
Table 4-2 SEM/EDX results of Ag-Au alloyed nanoparticles.
Element Ag:Au=1:1 Ag:Au=3:1
Ag Atomic% 52.82 64.14 Au Atomic% 47.18 35.86
XRD 分析
Fig. 4-4 為 Ag-Au 合金奈米粒子之 XRD 繞射圖,由於 Ag 與 Au 晶格常數相當接近, 故兩者繞射峰幾乎重疊,無法從繞射峰位置來判定是否為 Ag-Au 合金。比對 JCPDS 可 以得到 Ag(111)/Au(111)、Ag(200)/Au(200)、Ag(220)/Au(220)及 Ag(311)/Au(311)四個繞 射峰。從 Ag(111)/Au(111)繞射峰半高寬(FWHM)分析,推算奈米粒子的大小為 7 nm,如 Table 4-3 所示。26
Fig. 4-4 XRD of Ag-Au alloyed nanoparticles (Ag/Au=1:1).
Table 4-3 The XRD fitting result of Ag-Au alloyed nanopaticles (Ag/Au=1:1).
Composition Ag:Au=1:1
FWHM(111) 1.20
Estimated size / nm 6.95
4-1-2 光學特性分析
UV-Vis 光譜分析
Fig.4-5 為 Ag、Au 奈米粒子以及 Ag:Au 分別為 3:1、1:1 之 Ag-Au 合金奈米粒子之 UV-Vis 吸收光譜。由圖可知,Ag、Au 奈米粒子的吸收峰分別於 420 及 520 nm,而所合 成之合金奈米粒子,其吸收峰則介於 420 及 520 nm 間,約為 470 nm。
在 Ag:Au=1:1 的樣品中,從上述 TEM/EDX 的分析(Fig. 4-2, Table 4-1),我們得知所 形成的合金奈米粒子為內部 Ag:Au 約為 1:1,而外部則是 Ag 含量較高,亦即單顆奈米 粒子中有成份上之差異,所以在 UV-Vis 吸收光譜上將呈現兩個吸收峰相疊合的情況。 在 Ag:Au=3:1 的樣品中,呈現較為單一吸收峰,但仍難以排除為兩個吸收峰以上相疊合 之結果。從此結果可以了解,合金的結構在 UV-Vis 吸收光譜上,會呈現一個介於 Ag(420 nm)、Au(520 nm)奈米粒子之間的單一吸收峰或因為表層的組成成份不同,而呈現兩者 疊合的吸收峰,不似核殼結構會產生個別成份之吸收峰。關於 Ag-Au 合金奈米粒子的
27
UV-Vis 吸收光譜模擬,請參見第五章 Fig. 5-3、Fig. 5-7、Fig. 5-13 以及 Fig. 5-16。
Fig. 4-5UV-Vis absorption spectra of Ag, Au and Ag-Au alloyed nanoparticles.
4-2 Au/Ag 核殼奈米粒子
4-2-1 結構特性分析
TEM 分析
由於 Au、Ag 奈米粒子的結構十分相似,晶格常數也很接近,所以 Ag 奈米粒子較 容易在表層形成「磊晶」核殼的結構。為了使 Au 奈米粒子的表面較容易吸附 Ag 奈米
粒子,所以我們先加入少許檸檬酸納(sodium citrate),在加入 AgNO3之後,會與 sodium
citrate 反應,溶液顏色瞬間由酒紅色轉換為紅棕色(混濁),而後立刻加入維他命 C 酸 (ascorbic acid),由於 ascorbic acid 是弱還原劑,可以讓未反應完全的 Ag 奈米粒子完全 吸附在粒子表面,使得殼層結構更加完整,較不易形成其他副產物。由 HRTEM 影像(Fig. 4-6)可以發現,所合成之奈米粒子(Ag/Au=29/71)發現為十面體(Decahedron)核殼結構。 藉由 TEM/EDX 成份分析(Fig. 4-7, Fig. 4-9, Table 4-4, Table 4-5),可以發現外層之 Ag 成 份均較中心部為高,証明此為 Au/Ag 核殼結構。且排除 Au 與 Ag 個別形成的可能性。