科技部補助專題研究計畫成果報告
期末報告
上課出席、同儕效果與課業表現
計 畫 類 別 : 個別型計畫 計 畫 編 號 : MOST 102-2410-H-004-007- 執 行 期 間 : 102 年 08 月 01 日至 103 年 11 月 30 日 執 行 單 位 : 國立政治大學經濟學系 計 畫 主 持 人 : 陳鎮洲 計畫參與人員: 碩士級-專任助理人員:莊晋祥 碩士班研究生-兼任助理人員:郭詩妤 處 理 方 式 : 1.公開資訊:本計畫涉及專利或其他智慧財產權,2 年後可公開查詢 2.「本研究」是否已有嚴重損及公共利益之發現:否 3.「本報告」是否建議提供政府單位施政參考:否中 華 民 國 104 年 01 月 08 日
中 文 摘 要 : 本研究計畫主要的目的在於收集與整理有關大學生上課出席 與其課業表現的文獻,特別是與經濟學的教學有關的研究文 獻,並且建立適當的理論與假說,進行分析與預測大學生上 課出席與否,如何影響學生學業學習成效。同時透過收集詳 盡的學生個人特性、同儕關係、學習型態、以及課業表現等 資料,從事嚴謹的統計分析,以探討個人特性、同儕關係、 以及學習型態對學生課業表現的影響,並驗證相關理論模型 的假說與預測的結果。最後根據相關的理論模型分析以及實 證的估計結果,提供未來其他國內外學校規劃相關課程教學 之參考。 中文關鍵詞: 上課出席、同儕效果、考試成績 英 文 摘 要 :
科技部補助專題研究計畫成果報告
(□期中進度報告/期末報告)
(影響學生上課出席的因素、同儕效果以及對考試成績的影響)
計畫類別:個別型計畫 □整合型計畫
計畫編號:NSC102-2410-H-004 -007)
執行期間:102 年 8 月 1 日至 103 年 11 月 30 日
執行機構及系所:政治大學經濟學系
計畫主持人:陳鎮洲
共同主持人:
計畫參與人員:莊晋祥、郭詩妤
本計畫除繳交成果報告外,另含下列出國報告,共 _0_ 份:
□執行國際合作與移地研究心得報告
□出席國際學術會議心得報告
期末報告處理方式:
1. 公開方式:
□非列管計畫亦不具下列情形,立即公開查詢
涉及專利或其他智慧財產權,□一年二年後可公開查詢
2.「本研究」是否已有嚴重損及公共利益之發現:否 □是
3.「本報告」是否建議提供政府單位施政參考 否 □是, (請列舉提供
之單位;本部不經審議,依勾選逕予轉送)
中 華 民 國 104 年 1 月 8 日
科技部補助專題研究計畫成果報告自評表
請就研究內容與原計畫相符程度、達成預期目標情況、研究成果之學術或應用價
值(簡要敘述成果所代表之意義、價值、影響或進一步發展之可能性)
、是否適
合在學術期刊發表或申請專利、主要發現(簡要敘述成果是否有嚴重損及公共利
益之發現)或其他有關價值等,作一綜合評估。
1. 請就研究內容與原計畫相符程度、達成預期目標情況作一綜合評估
達成目標
□ 未達成目標(請說明,以 100 字為限)
□ 實驗失敗
□ 因故實驗中斷
□ 其他原因
說明:
2. 研究成果在學術期刊發表或申請專利等情形:
論文:□已發表 未發表之文稿 □撰寫中 □無
專利:□已獲得 □申請中 □無
技轉:□已技轉 □洽談中 □無
其他:(以 100 字為限)
3. 請依學術成就、技術創新、社會影響等方面,評估研究成果之學術或應用價
值(簡要敘述成果所代表之意義、價值、影響或進一步發展之可能性)
,如已
有嚴重損及公共利益之發現,請簡述可能損及之相關程度(以 500 字為限)
The main purpose of this project is to examine whether peer presence, measured
by overall class attendance rate, has any significant effect on college students’
academic performance. We use a rich data set from an Intermediate
Microeconomics course from the Fall of 2008 to the Spring of 2013 at a public
university in Taiwan. The estimation results reveal a significant and negative effect
of peer attendance on individual students’ examination performances. However,
for the less motivated students who attended less than 50% of the lectures, the
negative peer effects disappear. As a result, the beneficial effects of a typical
mandatory attendance policy considered in prior literature needs to be reassessed.
Effect of Peer Attendance on College Students’ Learning
Outcomes in a Microeconomics Course*
Jennjou Chen Department of Economics National Chengchi University
And
Tsui-Fang Lin
Department of Public Finance National Taipei University
Abstract
The main purpose of this paper is to examine whether peer presence, measured by overall class attendance rate, has any significant effect on college students’ academic performance. We use a rich data set from an Intermediate Microeconomics course from the Fall of 2008 to the Spring of 2013 at a public university in Taiwan. The estimation results reveal a significant and negative effect of peer attendance on individual students’ examination performances. On average, a student’s performance drops by 4.04% when overall class attendance increases by 1 standard deviation (12.8%). This result suggests that potential distraction from peers dominates the beneficial effect of peer attendance. In addition, the subsample estimation shows that the presence of peers produces a negative effect on better motivated students’ examination performance. However, for the less motivated students who attended less than 50% of the lectures, the negative peer effects disappear. As a result, the beneficial effects of a typical mandatory attendance policy considered in prior literature needs to be reassessed.
Key words: attendance, peer effect, mandatory attendance policy JEL code: A2, I21
*Part of this paper was completed when both authors visited Georgetown University. Financial support provided by Taiwan's National Science Council (NSC102-2410-H-004 -007) is gratefully acknowledged. All errors are our own.
I. Introduction
College students’ academic performance is a key indicator of quality of higher education. In
light of the fact that a great amount of public and private resources are invested in higher
education, it is important to study determinants of college students’ academic performance.
Various factors including attendance, student effort, teaching style, characteristics of students and
instructors, characteristics of peers and adoption of technology affect college students’ learning
outcomes. The main purpose of this paper is to explore whether peer presence has any significant
effect on college students’ examination performance.
It is widely believed that peer quality and behavior have a nontrivial effect on students’
learning outcomes. Some studies of peer effects literature have shown that peers such as
randomly assigned roommates have an impact on college students’ learning outcomes and
decisions to join social groups (Sacerdote, 2001; Zimmerman, 2003). Less is known about
whether peer presence has any impact on college students’ academic performance. Peer presence
in terms of overall class attendance rate may impact students’ examination performance through
a variety of channels. For instance, peer presence may enhance students’ morale and learning
motivation. Students may also gain from interactions among peers and instructors. However, a
higher overall attendance rate may produce negative effects on learning outcomes due to
by poor sitting arrangement and worse class management in a large class. As a result, it is
imperative to empirically test the role peer attendance plays in determinants of college students’
learning outcomes.
Employing a unique 5-year panel data set from an Intermediate Microeconomics course,
this paper estimates peer attendance effect and adds value to the peer effects literature. The
organization of this paper is as described below. The next section reviews literature; Section III
describes data and the statistical model; Section IV discusses empirical results and Section V
presents the conclusions.
II. Literature Review
Class attendance, one type of effort input, plays an important role in the production of
academic performance. Many researchers have investigated the relationship between class
attendance and college students’ learning outcomes. Most of the prior research in this line of
literature has reached the conclusion that college students’ learning outcomes are positively
associated with their attendance rate. College students score higher in examinations if they attend
lectures more frequently (Romer, 1993; Stanca, 2006; Chen & Lin, 2008; Arulampalam et al.,
2012; Andrietti, 2014).
The above studies support the argument that college students learn better if they attend
provides a rationale to promote a mandatory attendance policy. A mandatory attendance policy
increases students’ attendance rate and can thereby improve learning outcomes also. Marburger
(2006), Dobkin et al. (2010) and Self (2012) have shown that mandatory attendance policies help
students do better in examinations.
In addition to students’ own attendance and effort, peers may also affect their academic
performance. Peers like roommates might have important impact on college students’ learning
outcomes. For instance, Sacerdote (2001) found that randomly assigned roommates have
produced significant impact on college students’ academic performance and decisions to join
social organizations but not on choice of college major. Zimmerman (2003) investigated the role
roommates play as determinants of college students’ learning outcomes and found that students
in the middle of the SAT distribution do worse in grades if their roommates’ verbal SAT is in the
bottom 15%.
None of prior studies have examined the peer attendance effect. The presence of peers, i.e.
the overall attendance rate, may play a role in students’ academic performance. On the one hand,
students’ morale and motivations might be enhanced if there are more students involved in the
learning process. Students discuss and work with their peers and learn better. Good questions
raised by peers can produce a positive externality to other students in the classroom. As a result,
On the other hand, a higher overall attendance rate may also produce negative effects on
learning outcomes. For instance, better motivated students might be distracted by less motivated
students sitting in the classroom. Also, sitting arrangement and class management might be poor
in a rather large class. Hence, peer presence may have a negative impact on students’ academic
performance. In conclusion, the effect of peer presence on learning outcomes is indeterminate
and needs to be tested empirically. To fill this gap in the literature,this paper empirically tests the
peer attendance effect in higher education. The estimation results of this paper are expected to
enhance the understating of the peer attendance effect on examination performance.
III. Data and Statistical Model
We used a rich data set from an Intermediate Microeconomics course from the Fall of 2008
to the Spring of 2013 at a public university in Taiwan. The sample course was a two semester
economics major required course. Students met three hours per week. Most enrolled students
were sophomores. The sample course was taught by the same instructor for 10 consecutive
semesters. This provides us with a great opportunity to investigate the peer presence effect by
controlling factors including characteristics of instructors. The average class size was 132
students per semester during the sample period. The attendance patterns were similar across all
semesters. For illustration purpose, we use the spring semester of 2013 as an example.
progresses. The overall attendance rate increases slightly before each examination. The first
examination was usually held in the fifth or sixth week. The second examination was held in the
tenth or eleventh week. The final examination was held in the final week. For this course,
students were required to do a project and an oral presentation. The presentation week was
usually between the second and the final examination. Students were required to attend lectures
during the presentation week in which 1.5 hours were used for regular lecture while the other 1.5
hours were used for student presentation. The overall attendance rate was the highest during the
presentation week.
In this analysis, the main dependent variable is an individual student’s examination
performance. For each examination question, the percentage of correctness is computed and used
as an index for students’ learning outcomes. Students’ individual class attendance records and
overall class attendance rate are linked to performance. We use the following linear regression
model to depict the relationship between a student’s examination performance and a variety of
attendance variables.
yij = Aij + aij +Dij +ci + εij, i = 1, 2, …, I, j = 1, 2, 3, …, J (1)
I denotes total number of students and J denotes total number of examination questions. yij
corresponds to student i’s observed examination performance on question j. Aij refers to the
indicates the correlation between overall class attendance and individual students’ grades, which
is the key parameter of interest in this paper. aij refers to student i’s attendance record of the
corresponding lecture in which question j was covered. represents individual students’ class attendance effect. ci represents student i’s time-invariant individual effect, and εij is a random
disturbance term.
Since the timing and topics of lectures may correlate with students’ class attendance
behavior and their examination performance, a set of dummy variables, i.e. Dij, are included in
the regression in order to obtain unbiased estimates of peer attendance effect. The timing related
dummy variables include whether the lecture was delivered in the first week of the semester, the
week right before an examination or the week right after an examination. Additionally, Dij
contain second examination, final examination and spring semester dummy variables. To further
take into account the fact that topics of lectures might also influence the lecture attending
behavior and examination performance of students, textbook chapter dummies are also included
as control variables.
We estimate the peer attendance effect using a linear model where the dependent variable is
the correctness of answer to each question. We identify the peer attendance effect by using the
variations in overall attendance rate across and within semesters. As described above, an array of
semester dummies are included in our empirical model. Moreover, we control for student fixed
effects in our empirical model.
IV. Empirical Results
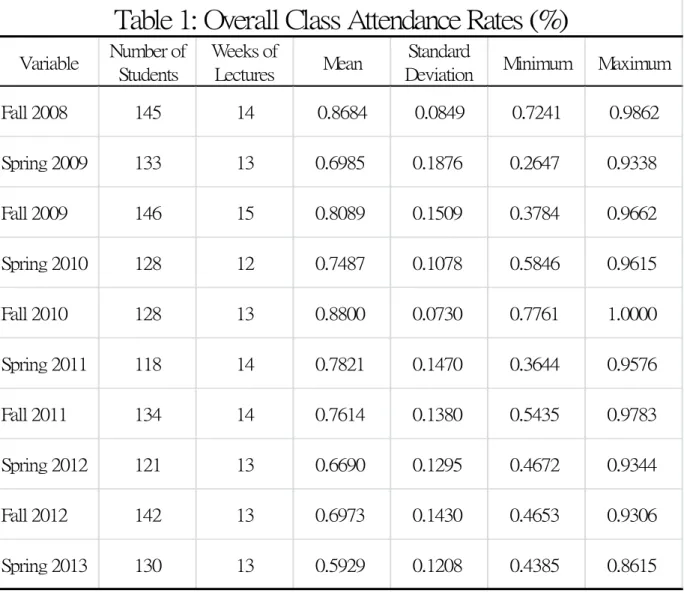
Table 1 represents the overall attendance rate across all semesters. Usually, the overall
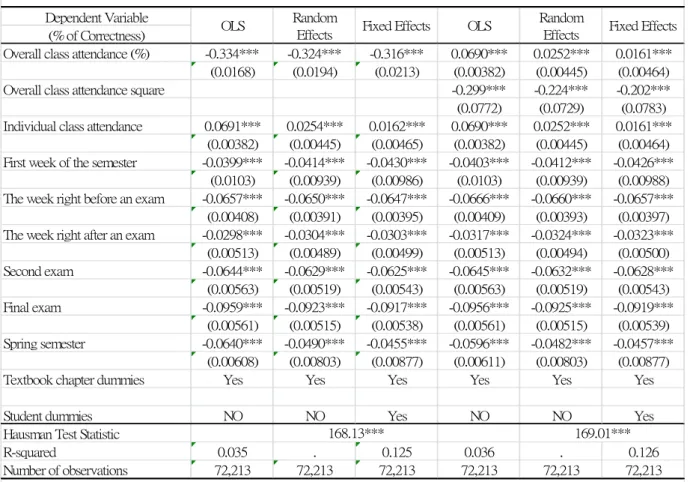
attendance rate in the fall semester is higher than in the spring semester. Table 2 is the estimation
results of peer attendance effect. We estimate three types of empirical models including OLS,
random effects and fixed effects models. The Hausman test suggests the use of fixed effects
model. We also consider a nonlinear effect of the overall attendance. The nonlinear effect of peer
attendance in terms of the overall attendance rate can be seen from the fourth to sixth column.
From the first three columns in Table 2, the estimation results suggest a significant and
negative effect of peer attendance on individual students’ examination performance, after
controlling for various confounding factors. On average, a student’s performance drops by 4.04%
(-0.316*12.8%) when overall class attendance increases by 1 standard deviation (12.8%). As a
result, this study suggests that the negative effect of a large class and potential distraction from
peers dominates the beneficial effect of peer attendance. To further capture the possible
nonlinearity of peer presence effect, we consider a quadratic form of the overall attendance
variable. From the sixth column in Table 2, we find that there is a concave and negative
the estimated coefficients, Figure 2 illustrates the relationship between examination performance
and overall attendance. The negative effect of peer presence on performance is consistent with
that found in the linear model. Notably, after controlling for peer attendance effect, students’ own
attendance still produces a positive effect on learning outcomes in the full sample. This result is
consistent with empirical evidence in prior studies.
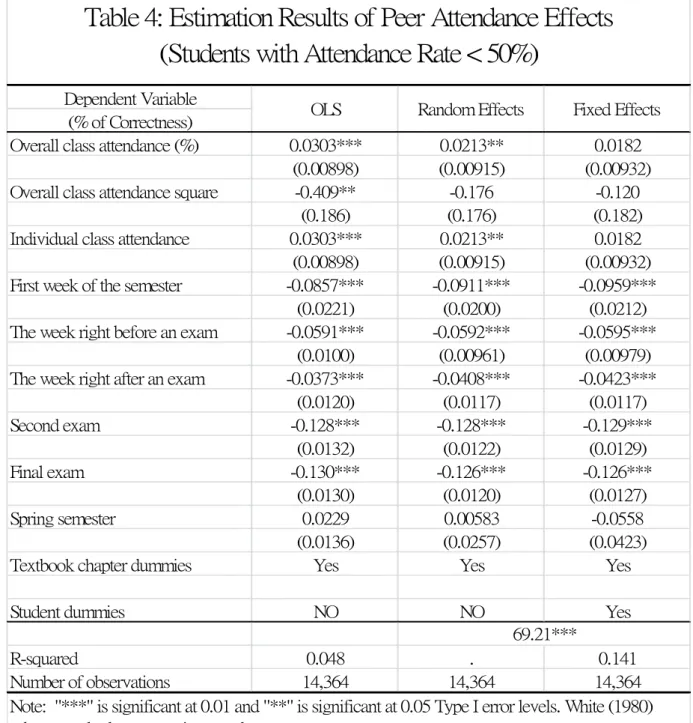
Next, we further investigate whether the peer presence effect differs across two groups of
students. One group of students considered here is those with 80% or higher class attendance rate.
The other group of students is those with 50% or lower class attendance rate. Table 3 shows the
estimation results for the first group of students and Table 4 shows the estimation results for the
second group of students. It is noteworthy that the overall attendance produces a negative effect
on the group of students who attend lectures more frequently but not on the group of students
who skip lectures more often. Also, the individual attendance effect is not significant for the
group of students with 50% or lower class attendance rate. This implies that attending lectures
does not improve the grades of less motivated students.
There are several plausible explanations for this finding. Firstly, better motivated students
might be getting distracted by less motivated students who are required to sit in the classroom.
Secondly, as the class size becomes larger, it might become more difficult for the instructor to
class and that could negatively affect students’ learning.
V. Conclusions
This paper addresses the effect of peer presence on students’ academic performance,
employing a unique 5-year panel data of Taiwan. In our sample, the overall attendance rate
ranges from 0.6 to almost 0.9. The highest attendance rate occurred in the project presentation
week during which students were required to attend class.In order to obtain unbiased estimates
of peer attendance effect, various dummy variables are included in the empirical model. The
estimation results indicate a negative effect of peer presence on college students’ examination
performance. This study shows that the negative effect of a large class and potential distraction
from peers dominates the beneficial effect of peer attendance.
The estimation results also suggest that a mandatory attendance policy which requires less
motivated students who would not have attended lectures might cause an adverse effect on
students with stronger learning motivations. Less motivated students may not benefit from
attending lectures as found in our estimation results (Table 4). In contrast, better motivated
students’ welfare and learning outcomes may be negatively affected by a higher overall
attendance rate (Table 3). When the overall class attendance rate is high, it is likely that less
motivated students in the classroom might have negative impacts on better motivated students. In
References
[1] Andrietti, V. (2014), Does Lecture Attendance Affect Academic Performance? Panel Data
Evidence for Introductory Macroeconomics, International Review of Economics Education,
15, 1-16.
[2] Arulampalam, W., R. A. Naylor, and J. Smith (2012), Am I Missing Something? The Effects
of Absence from Class on Student Performance, Economics of Education Review, 31,
363-375.
[3] Chen, J., and T. F. Lin (2008), Class Attendance and Exam Performance: A Randomized
Experiment, Journal of Economic Education, 39, 213-227.
[4] Dobkin, C., R. Gil, and J. Marion (2010), Skipping Class in College and Exam Performance: Evidence from a Regression Discontinuity Classroom Experiment, Economics of Education
Review, 29: 566-575.
[5] Marburger, R. (2006), Does Mandatory Attendance Improve Student Performance? Journal
of Economic Education, 37, 99-110.
[6] Romer, D. (1993), Do Students Go to Class? Should they? Journal of Economic
Perspectives, 7, 167-174.
[7] Self, S. (2012), Studying Absenteeism in Principles of Macroeconomics: Do Attendance
Policies Make a Difference? Journal of Economic Education, 43, 223-234.
[8] Sacerdote, B. (2001), Peer Effects with Random Assignment: Results for Dartmouth
Roommates, Quarterly Journal of Economics, 116, 681-704.
[9] Stanca, L. (2006), The Effects of Attendance on Academic Performance: Panel Data
Evidence for Introductory Microeconomics, Journal of Economic Education, 37, 251-266.
[10] White, H. (1980), A Heteroshedasticity-Consistent Covariance Matrix Estimator and a
Direct Test for Heteroshedasticity, Econometrica, 48, 817-838.
Variable Number of Students Weeks of Lectures Mean Standard
Deviation Minimum Maximum
Fall 2008 145 14 0.8684 0.0849 0.7241 0.9862 Spring 2009 133 13 0.6985 0.1876 0.2647 0.9338 Fall 2009 146 15 0.8089 0.1509 0.3784 0.9662 Spring 2010 128 12 0.7487 0.1078 0.5846 0.9615 Fall 2010 128 13 0.8800 0.0730 0.7761 1.0000 Spring 2011 118 14 0.7821 0.1470 0.3644 0.9576 Fall 2011 134 14 0.7614 0.1380 0.5435 0.9783 Spring 2012 121 13 0.6690 0.1295 0.4672 0.9344 Fall 2012 142 13 0.6973 0.1430 0.4653 0.9306 Spring 2013 130 13 0.5929 0.1208 0.4385 0.8615
Dependent Variable (% of Correctness)
Overall class attendance (%) -0.334*** -0.324*** -0.316*** 0.0690*** 0.0252*** 0.0161*** (0.0168) (0.0194) (0.0213) (0.00382) (0.00445) (0.00464) Overall class attendance square -0.299*** -0.224*** -0.202*** (0.0772) (0.0729) (0.0783) Individual class attendance 0.0691*** 0.0254*** 0.0162*** 0.0690*** 0.0252*** 0.0161***
(0.00382) (0.00445) (0.00465) (0.00382) (0.00445) (0.00464) First week of the semester -0.0399*** -0.0414*** -0.0430*** -0.0403*** -0.0412*** -0.0426***
(0.0103) (0.00939) (0.00986) (0.0103) (0.00939) (0.00988) The week right before an exam -0.0657*** -0.0650*** -0.0647*** -0.0666*** -0.0660*** -0.0657***
(0.00408) (0.00391) (0.00395) (0.00409) (0.00393) (0.00397) The week right after an exam -0.0298*** -0.0304*** -0.0303*** -0.0317*** -0.0324*** -0.0323***
(0.00513) (0.00489) (0.00499) (0.00513) (0.00494) (0.00500) Second exam -0.0644*** -0.0629*** -0.0625*** -0.0645*** -0.0632*** -0.0628*** (0.00563) (0.00519) (0.00543) (0.00563) (0.00519) (0.00543) Final exam -0.0959*** -0.0923*** -0.0917*** -0.0956*** -0.0925*** -0.0919*** (0.00561) (0.00515) (0.00538) (0.00561) (0.00515) (0.00539) Spring semester -0.0640*** -0.0490*** -0.0455*** -0.0596*** -0.0482*** -0.0457*** (0.00608) (0.00803) (0.00877) (0.00611) (0.00803) (0.00877) Textbook chapter dummies Yes Yes Yes Yes Yes Yes Student dummies NO NO Yes NO NO Yes Hausman Test Statistic
R-squared 0.035 . 0.125 0.036 . 0.126 Number of observations 72,213 72,213 72,213 72,213 72,213 72,213 Note: "***" is significant at 0.01 Type I error levels. White (1980) robust standard errors are in parentheses.
Table 2: Estimation Results of Peer Attendance Effects
(All Students)
OLS Random
Effects Fixed Effects OLS Random
Effects Fixed Effects
169.01*** 168.13***
Dependent Variable (% of Correctness)
Overall class attendance (%) 0.0421*** 0.0239** 0.0205**
(0.00977) (0.00957) (0.00982)
Overall class attendance square -0.395*** -0.275*** -0.237**
(0.104) (0.0983) (0.106)
Individual class attendance 0.0421*** 0.0239** 0.0205**
(0.00977) (0.00957) (0.00982)
First week of the semester 0.00708 0.00206 -0.000635
(0.0137) (0.0130) (0.0133)
The week right before an exam -0.0689*** -0.0638*** -0.0623***
(0.00518) (0.00504) (0.00509)
The week right after an exam -0.0393*** -0.0354*** -0.0340***
(0.00670) (0.00641) (0.00657) Second exam -0.0399*** -0.0380*** -0.0373*** (0.00732) (0.00681) (0.00710) Final exam -0.0804*** -0.0753*** -0.0739*** (0.00731) (0.00675) (0.00703) Spring semester -0.0754*** -0.0532*** -0.0439*** (0.00869) (0.0114) (0.0129)
Textbook chapter dummies Yes Yes Yes
Student dummies NO NO Yes
Hausman Test Statistic
R-squared 0.032 . 0.112
Number of observations 40,882 40,882 40,882
Note: "***" is significant at 0.01 and "**" is significant at 0.05 Type I error levels. White (1980) robust standard errors are in parentheses.
43.67***
Table 3: Estimation Results of Peer Attendance Effects
(Students with Attendance Rate > 80%)
Dependent Variable (% of Correctness)
Overall class attendance (%) 0.0303*** 0.0213** 0.0182
(0.00898) (0.00915) (0.00932)
Overall class attendance square -0.409** -0.176 -0.120
(0.186) (0.176) (0.182)
Individual class attendance 0.0303*** 0.0213** 0.0182
(0.00898) (0.00915) (0.00932)
First week of the semester -0.0857*** -0.0911*** -0.0959***
(0.0221) (0.0200) (0.0212)
The week right before an exam -0.0591*** -0.0592*** -0.0595***
(0.0100) (0.00961) (0.00979)
The week right after an exam -0.0373*** -0.0408*** -0.0423***
(0.0120) (0.0117) (0.0117) Second exam -0.128*** -0.128*** -0.129*** (0.0132) (0.0122) (0.0129) Final exam -0.130*** -0.126*** -0.126*** (0.0130) (0.0120) (0.0127) Spring semester 0.0229 0.00583 -0.0558 (0.0136) (0.0257) (0.0423)
Textbook chapter dummies Yes Yes Yes
Student dummies NO NO Yes
R-squared 0.048 . 0.141
Number of observations 14,364 14,364 14,364
Table 4: Estimation Results of Peer Attendance Effects
(Students with Attendance Rate < 50%)
OLS Random Effects Fixed Effects
Note: "***" is significant at 0.01 and "**" is significant at 0.05 Type I error levels. White (1980) robust standard errors are in parentheses.
科技部補助計畫衍生研發成果推廣資料表
日期:2015/01/08科技部補助計畫
計畫名稱: 上課出席、同儕效果與課業表現 計畫主持人: 陳鎮洲 計畫編號: 102-2410-H-004-007- 學門領域: 經濟學概論與教學無研發成果推廣資料
102 年度專題研究計畫研究成果彙整表
計畫主持人:陳鎮洲 計畫編號: 102-2410-H-004-007-計畫名稱:上課出席、同儕效果與課業表現 量化 成果項目 實際已達成 數(被接受 或已發表) 預期總達成 數(含實際已 達成數) 本計畫實 際貢獻百 分比 單位 備 註 ( 質 化 說 明:如 數 個 計 畫 共 同 成 果、成 果 列 為 該 期 刊 之 封 面 故 事 ... 等) 期刊論文 0 0 100% 研究報告/技術報告 1 1 100% 研討會論文 0 0 100% 篇 論文著作 專書 0 0 100% 申請中件數 0 0 100% 專利 已獲得件數 0 0 100% 件 件數 0 0 100% 件 技術移轉 權利金 0 0 100% 千元 碩士生 1 1 100% 博士生 0 0 100% 博士後研究員 0 0 100% 國內 參與計畫人力 (本國籍) 專任助理 1 1 100% 人次 期刊論文 0 0 100% 研究報告/技術報告 0 0 100% 研討會論文 1 1 100% 篇 論文著作 專書 0 0 100% 章/本 申請中件數 0 0 100% 專利 已獲得件數 0 0 100% 件 件數 0 0 100% 件 技術移轉 權利金 0 0 100% 千元 碩士生 0 0 100% 博士生 0 0 100% 博士後研究員 0 0 100% 國外 參與計畫人力 (外國籍) 專任助理 0 0 100% 人次其他成果