行政院國家科學委員會專題研究計畫 成果報告
政策制訂過程中的公共經理人:對於中高階文官貢獻之探
究
研究成果報告(精簡版)
計 畫 類 別 : 個別型 計 畫 編 號 : NSC 99-2410-H-004-122- 執 行 期 間 : 99 年 08 月 01 日至 100 年 07 月 31 日 執 行 單 位 : 國立政治大學社會科學學院 計 畫 主 持 人 : 柏門 共 同 主 持 人 : 王俊元、謝俊義 計畫參與人員: 碩士班研究生-兼任助理人員:蔡宜婷 報 告 附 件 : 出席國際會議研究心得報告及發表論文 公 開 資 訊 : 本計畫可公開查詢中 華 民 國 100 年 10 月 31 日
中文摘要: 本研究拓展了中高階文官在新方案及網絡治理角色上的知識, 尤其當近來的文獻已逐漸的聚焦在中高階文官(具有經驗的公 共經理人)在網絡治理系絡下如何倡議及發展新計畫時,本研 究有助於增進公共政策與公共行政的領導精神文獻上的討論。 事實上,關於這些類型公共經理人在實證研究上是非常稀少 的,而本研究藉由提供這些公共經理人在政策制訂相關的活 動、技能、與管理能力經驗上的證據,可填補與實踐中高階文 官在政策制訂角色、來自其機關首長的期待、以及其他影響因 素。具體而言,本研究的主要研究問題包含:1. 在政策制訂及 治理網絡的過程中,中高階文官所扮演的角色為何?2. 公共經 理人的知識、技能、激勵因素如何影響到其在政策制訂與治理 網絡過程中的參與? 3. 其他條件的限制,如管理階層的期望、 人力資源政策或其他結構性的因素,如何影響到其在政策制訂 與治理網絡過程中的參與?等。本研究透過問卷調查的方式, 發放問卷至行政院的七個部會,包括內政部、教育部、交通 部、人事行政局、衛生署、環保署及經濟部。截至七月下旬, 本研究回收了 695 份問卷,扣除掉僅填答少數題目的無效問卷 13 份,總計有效問卷為 682 份,回收率為 54.56%。其中薦任版 本發出 864 份,問卷回收 498 份,回收率為 57.63%;簡任版本 發出 386 份,回收 184 份,回收率為 47.66%。經由本研究分 析,發現單位主管(supervisor level)確實在領導、工作態度、 與績效表現等面向上有不同薦任非主管人員以及 10-12 職等的 簡任文官之表現。 英文摘要:
Public Managers in the
Policy-Making Process: Exploring the
Contribution of Middle and
Senior Managers
Contents
I. Introduction II. Research Purpose III. Literature Review IV. Research Design V. Finding and Conclusion References
Self-Evaluation
I. Introduction
These recent studies show that previous perspectives on policy-making are increasingly inadequate in two important ways. First, while past studies have often viewed top public managers as key players in making policy decisions, this view is increasingly untenable with the reality of network governance in the modern world. Too many policy decisions require a high level of coordination and expertise to an extent that no senior executive can manage it all. Executive leaders and top managers are increasingly unable to initiate and provide support to the great many of initiatives that are needed, which has led to a growing interest in getting lower officials to conceive new solutions and take initiative for addressing myriad problems. Indeed, the common view is now that society benefits (and in a globally competitive environment increasingly needs) from a multitude of leadership in tacking its many problems. In this regard, senior and higher echelon middle managers are viewed in this study as exceptional resource of expertise (they often have ten to twenty years of professional experience) and potential leadership in network governance. The growing role of network governance in modern societies requires that senior managers and upper echelon middle managers take greater initiative and leadership in collaboration efforts which may lead to new programs and also drive or shape new policy.
However, thus far very little systematic research has looked into this (e.g., Korosec and Berman, 2005), and with little attention to the skills, propensity and condition of middle managers to fulfill these roles.
Second, theoretical frameworks on sense-making have also recast the policy-making process as knowledge creation that casts top managers less in the role of decision-makers and synthesizers, and more of consensus-builders and those who help a broad coalition reach a shared and common understanding. Decision-making is seen as an organizational process, and policies are seen as more effective when they have contributions and support from those who are affected by them. In a knowledge-creating process, senior and upper middle managers are seen as being an integral part of the sense-making effort whose important contribution is being able to simultaneously comprehend the grand theories of top management and the experiences of operational realities of departments, including first-line workers and community stakeholders and clients (Nonaka & Takeuchi, 1995; Nonaka & Toyama, 2003). Managers help others to make sense of diverse realties and, by doing so, contribute to making better policy choices and play leading roles in the development of new policies and programs. Conceptualization of broad, sense-making processes is also not well-established, and this study contributes to that as well. It might also be noted that being able to effectively participate in such settings (e.g., being able to effectively bridge strategic and operational aspects) is relevant to their merit-based career promotion processes, as well, which might suggest why at least some middle managers might seek such opportunities.
II. Research Purpose
This research not only contributes to exploring contributions of senior and upper middle level managers, but, by including the latter, it also contributes to the current dearth of knowledge about middle managers (and sub-executive senior managers) in government. Undoubtedly, the absence of much past
scholarship about such managers reflects a lack of familiarity among political scientists with these levels of management, as well as historic alternate foci in public administration itself, such as top management leadership, etc. While some acknowledge societal stereotypes of such managers as ‘recalcitrant obstacles’ to change, others see them as stewards of public values, and still others note that many leaders were themselves promoted from the ranks of middle management whether they accomplished much.
This research explores (i) the extent and manner that public manager participate in policy-making processes, including network governance (dependent variables), and (ii) the factors that affect such participation (independent variables). Specifically, we address the following questions:
1. What roles do upper-middle managers and senior managers fulfill in policy-making processes, including network governance?
2. How do managers’ knowledge, skill and motivation affect managers’ participation in policy-making and network governance processes?
3. How do conditions such as supervisory expectations, HR policies, and structural factors (described further) affect managers’ participation in policy-making and network governance processes?
III. Literature Review
Public administrators (i.e., senior managers, middle supervisors, middle and junior employees), as internal key stakeholders in a agency, encounter constituencies whose preferences are ambiguous, dynamic, and significantly shaped by and through their backgrounds (Ammons 2002; Mihm 2002; Newcomer et al. 2002). They need to make their agencies more effective by empowering and coordinating these heterogonous preferences. People perceive the world from a variety of perspectives and define their interests in different ways. Each member of the agency performs in terms of managerial capacity and other contextual and background factors (e.g.,
relationships with others who hold particular managerial role expectations toward performance effectiveness). They construct knowledge, or what passes for knowledge, differently (Weiss 1998). For example, public administrators perceive that managerial role expectations to be comprehensive so that they will know what others expect of them (Frederickson and Smith 2003). Senior managers based on demographic backgrounds and the needs of agencies require supports and sufficient resources for systems and training that are key requirements for performance management activities. To mobilize support and use resources, senior managers must coordinate the needs of stakeholders and then take action (Mihm 2002; Newcomer et al. 2002). Sometimes middle and juniors employees have more information about problems and can influence implementation and performance of the programs and the agencies. They serve under the senior managers and middle supervisors. Some scholars have suggested that giving more autonomy and discretion to regular administrators is a way to meet citizens’ needs (Lipsky 1980).
The agencies also have middle supervisors. One of the main advantages is that these supervisors are ready and able to take on the job whenever implementation and coordination are required. Middle supervisors may face pressure from politicians, senior managers, regular administrators, and citizens) (Ammons 1995; van Thiel and Leeuw 2002). If middle and junior employees are represented in implementation, middle supervisors may take the views of those who are not part of the planning and implementation into account
IV. Research Design
A. Sketch of Surveyed Samples
Data were collected in July October, 2011 in Taiwan Central Government. An endorsement letter was obtained from the Examination Yuan, Republic of China(Taiwan), the office in charge of Taiwan civil service institution and implementation, to increase the response rate. With the professional assistance of the Examination Yuan, we surveyed ministry-level
senior manager, middle supervisor, and middle employee. To ensure equivalence of the measures in the Chinese and the English versions, all the scales used in this study were translated into Chinese. To increase the accuracy of the response, each survey was distributed with a cover sheet guaranteeing anonymity. We use some procedures enlist cooperation and then reduce nonresponse bias (e.g., telephone follow-ups, the return envelope, maintain the respondent’s anonymity, an informative advance letter) (Fowler, 2009; Dillman, 2007). 637 of total responses were returned and the final 589 of them with the complete information, yielding a higher response rate of 70.21%.
Among the respondents, about 54.84% were male, and the mean tenure in government and their organization were 22.13 years and 11.844, separately. About 30.39% were senior managers, 29.03% were middle supervisors, and 40.58% were middle employees. 33.11% and 39.73% of their age categories fall under 35,and 35-44, separately. Most of their highest educational level were bachelor (36.50%) and graduate (56.88%).
All the respondents reported that they were somewhat or familiar with the operation and performance of their work unit. The sample was compared with the population of Taiwan Central Government employees in terms of gender, tenure, age, and education. No statistically significant difference was found. Table 1 presents their separate demographic backgrounds. Table 1: Sample Characteristics
Dimension Mean Percentage
Work tenure in your organization 11.844 (Min.=1, Max.-40) (N=589) Work tenure in government 21.133 (Min.=2, Max=41) (N=589) Senior Manager (N=179) 30.39% Middle Supervisor (N=171) 29.03% Managerial Role Middle Employee (N=239) 40.58% Male 54.84% (N=323) Gender Female 45.16% (N=266) under 35 33.11% (N=195) 35-44 39.73% (N=234) 45-54 17.49% (N=103) Age over 54 9.68%(N=57) Vocational Education or Associate Degree 2.38%(N=14) Bachelor 36.50% (N=215) Graduate 56.88% (N=334) Highest Educational Degree Ph.D. 4.24%(N=25) B. Variable Measurement
The research variables designed for exploring the contribution of middle and senior public managers in the policy-making process discussed in the previous section. The survey items refer to the individual and the department as the unit of analysis that the respondents are asked to evaluate properties of their department, and behaviors and attitudes of their work shown in appendix 1. The variables consist of middle manager work, senior manager work, traditional value, ethical behavior, work difficulties, perceived performance, leadership, work condition, work attitude, innovation-oriented culture, and performance culture.
Finally, all factors but tradition value (5-point Likert scale) whose survey item are measured on a 7-point Likert scale, from 1 for strongly disagree to 7 for strongly agree. As appendix 1 shown, each factor has sufficient internal consistency reliabilities and construct validity. We then average the scores of each factor which combines their separate survey items.
C. Analytical Methods
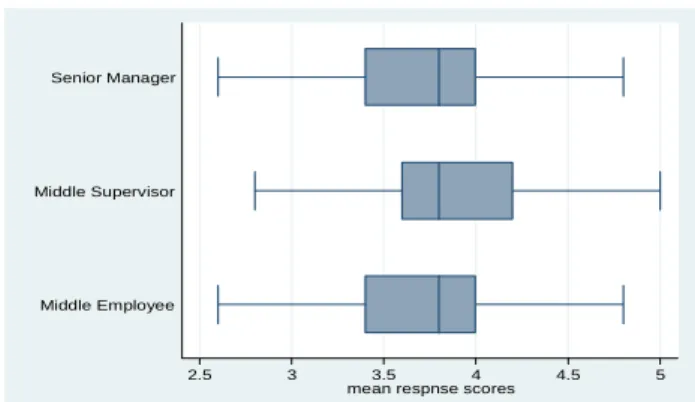
In addition to employing descriptive statistics to understand the distributions of the respondent samples, a box plot (also known as a box-and-whisker diagram or plot) graphically depicts three managerial roles of numerical data on each factor through their five-number summaries: the smallest observation (sample minimum), lower
quartile (25%), median (Q2), upper quartile (75 %), and largest observation (sample maximum).
One-way ANOVA is also used to compare the differences of each factor across senior manager, middle supervisor, and middle employee.
V. Finding and Conclusion
We firstly draft the box plot of the managerial role on each factor from Figure 1 to Figure 11. Then statistical information of one-way ANOVA indicates the differences across three managerial roles of senior managers, middle supervisors, and middle employees presented in table 2.
A. Box Plot Graph
As you can see, the basic idea of the box & whisker graphs graph is to sort the data and then select the minimum, the maximum and the values at the referring positions: median (0.5), lower (LQ) (0.25) and upper quartile (UQ) (0.75). From the below figure 1 to figure 11, each of the statistics (median, UQ, LQ) for middle is higher than for middle employees and senior managers. Overall, it appears that the middle employees have higher work attitudes and behaviors than other two types of employees. Based on these data values, we are certain that middle supervisors have higher median. There is some evidence to suggest that middle supervisors play a important roles in their government operations. .
3 4 5 6 7
mean response scores Middle Employee
Middle Supervisor Senior Manager
Figure1: Middle Manager Work
2 3 4 5 6 7
mean response scores Middle Employee
Middle Supervisor Senior Manager
Figure 2: Senior Manager Work
2.5 3 3.5 4 4.5 5 mean respnse scores
Middle Employee Middle Supervisor Senior Manager
Figure 3: Traditional Value Perception
3 4 5 6 7
mean response scores Middle Employee
Middle Supervisor Senior Manager
Figure 4: Ethical Behavior
1 2 3 4 5 6
mean respnse scores Middle Employee
Middle Supervisor Senior Manager
Figure 5: Perception of Work Difficulties
3 4 5 6 7 mean respnse scores
Middle Employee Middle Supervisor Senior Manager
Figure 6: Perceived Performance
3 4 5 6 7
mean response scores Middle Employee
Middle Supervisor Senior Manager
Figure 7: Leadership
3 4 5 6 7
mean response scores Middle Employee
Middle Supervisor Senior Manager
Figure 8: Work Condition
3 4 5 6 7
mean response scores Middle Employee
Middle Supervisor Senior Manager
Figure 9: Work Attitude
2 3 4 5 6 7
mean response scores Middle Employee
Middle Supervisor Senior Manager
Figure 10: Innovation-Oriented Culture
2 3 4 5 6 7
mean response scores Middle Employee
Middle Supervisor Senior Manager
Figure 11: Performance Culture
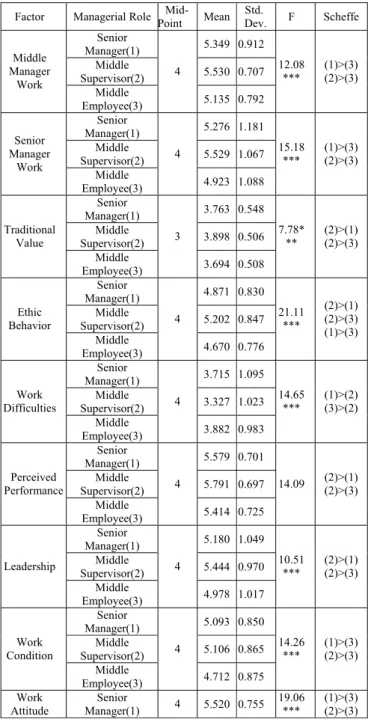
B. Mean Difference across Three Managerial Roles
Table 1 gives the mean difference of each factor across three managerial roles. As shown in Table 1, the average rating of middle manager work, senior manager work, ethical behavior, perceived performance, leadership, work condition, work attitude, innovation-oriented culture, and performance culture across three managerial roles are above the midpoint of 4, indicating that they perceived the high evaluation on their department environment, their work attitudes and behaviors. In general, Taiwan senior and middle civil servants agreed that their agency characteristics have enough support for management system operations. Most of them hold positive attitudes or have good behaviors toward their jobs. The civil servants perceived that these key components take effects when implementing policies or programs under the management system.
Of most importance, all three types of managerial roles had the significant perceived difference on these factors as shown in table 2. Especially, middle supervisors always share
higher average evaluations than senior managers and middle employees towards the factors of middle manager work, senior manager work, ethical behavior, perceived performance, leadership, work condition, work attitude, innovation-oriented culture, and performance culture (table 2). In other words, compared to other two types of civil servants, middle supervisors concerned and emphasized good management operation, have positive work attitudes and behave well.
The previous studies always thought that senior managers must develop an agency culture as they would any initiative (Rainey 2003). In a way, senior managers need the freedoms to manage resources. An increase in the autonomy of an agency lowers the cost of organizational maintenance by minimizing the number of external stakeholders and bureaucratic rivals, and by maximizing the opportunity for agency members to develop a cohesive sense of mission (Wilson 1989). The theoretical model always argued that senior managers hold higher evaluation on their work behaviors, work attitudes, and organizational operations than other types of employees. One of the reasons is that senior managers need to lead the plans and practices, and improve the performance, but other types of employees did not fully see the agency operations.
The factor of traditional value was found to have a significant difference among three groups (senior manager=5.276, middle supervisors=5.529, middle employees=4.923, F=7.78, p<0.001). As well, so do work difficulties (senior manager=3.715, middle supervisors=3.327, middle employees=3.882, F=14.65, p<0.001). The more likely explanation rests in the nature of job positions and hierarchical bureaucracy, which mark the perceived differences on traditional value and work difficulties. Middle supervisors serve a link-kin between senior and junior employees. Compared to senior manager’s decision-making, and junior employees’ implementation, they know the plans, implementations, and evaluations of their agencies. Therefore, middle supervisor are more likely to hold clearer pictures of their agency operations. table 2, the
One of the reasons explaining this phenomenon is that middle supervisors are more sensitive to the government system because of their duties and responsibilities. Middle employees may have this concern in their daily workloads, but sometimes they do not care about the government operations. Middle employees always have lower evaluations on each factor, compared to other types of employees.
Table 2 : One-Way ANOVA Analysis of Managerial Role on the Dimensions of Department Properties, Work Attitude and Work Behavior
Factor Managerial Role Point Mid- Mean Dev. Std. F Scheffe Senior Manager(1) 5.349 0.912 Middle Supervisor(2) 5.530 0.707 Middle Manager Work Middle Employee(3) 4 5.135 0.792 12.08 *** (1)>(3)(2)>(3) Senior Manager(1) 5.276 1.181 Middle Supervisor(2) 5.529 1.067 Senior Manager Work Middle Employee(3) 4 4.923 1.088 15.18 *** (1)>(3)(2)>(3) Senior Manager(1) 3.763 0.548 Middle Supervisor(2) 3.898 0.506 Traditional Value Middle Employee(3) 3 3.694 0.508 7.78* ** (2)>(1)(2)>(3) Senior Manager(1) 4.871 0.830 Middle Supervisor(2) 5.202 0.847 Ethic Behavior Middle Employee(3) 4 4.670 0.776 21.11 *** (2)>(1) (2)>(3) (1)>(3) Senior Manager(1) 3.715 1.095 Middle Supervisor(2) 3.327 1.023 Work Difficulties Middle Employee(3) 4 3.882 0.983 14.65 *** (1)>(2)(3)>(2) Senior Manager(1) 5.579 0.701 Middle Supervisor(2) 5.791 0.697 Perceived Performance Middle Employee(3) 4 5.414 0.725 14.09 (2)>(1)(2)>(3) Senior Manager(1) 5.180 1.049 Middle Supervisor(2) 5.444 0.970 Leadership Middle Employee(3) 4 4.978 1.017 10.51 *** (2)>(1) (2)>(3) Senior Manager(1) 5.093 0.850 Middle Supervisor(2) 5.106 0.865 Work Condition Middle Employee(3) 4 4.712 0.875 14.26 *** (1)>(3)(2)>(3) Work Attitude Senior Manager(1) 4 5.520 0.755 19.06 *** (1)>(3) (2)>(3)
Middle Supervisor(2) 5.624 0.691 Middle Employee(3) 5.203 0.732 Senior Manager(1) 4.842 0.988 Middle Supervisor(2) 5.241 0.885 Innovation-Oriented Culture Middle Employee(3) 4 4.660 0.923 19.52 *** (2)>(1)(2)>(3) Senior Manager(1) 4.939 0.981 Middle Supervisor(2) 5.203 0.859 Performance Culture Middle Employee(3) 4 4.777 0.946 10.39 *** (2)>(1) (2)>(3)
1.Senior Manager(1)=179, Middle Supervisor(2)=171, Middle Employee(3)=239.
2.*p<.05, **p<.01, ***p<.001.
V. Finding and Conclusion
Results revealed that middle supervisor play a vital role to consolidate the agency operation that the previous did not find and discuss more. Evidence was obtained with box-plot graph, internal consistence and factor analysis, and one-way ANOVA was adequate. We have confidence that the sample used in this research differs meaningfully from the level in terms of the samples of Taiwan Central Government.
Previous research focused on Western experiences, which does not fully explain how government management system becomes or ceases to be effective outside this area. This research demonstrates that according to public administrators’ perceptions – with other circumstances being constant – middle supervisors tended to play an unnecessary role on the government management system. Thus, this research advances the knowledge of international public management discourse. By examining managerial roles, we have confirmed that there are significant differences among senior managers, middle supervisors, and middle employees. Further, this study has taken a step in the direction of how they work in Eastern contexts. However, this research has its limitations, such as the need for objective evidence (e.g., official evaluations) to investigate whether the factors have differentiated across three managerial roles. In addition, the cross-section design may suffer from the inference of causal relationship. Future research needs more
longitudinal data to track their causal directions. The survey data is vulnerable to individual perceptual bias and social desirability bias. Nonetheless, the perceptual measures are systematically and logically linked with the real scenario (Lee et al. 2006; Moon 1999).4 Future
researchers may need to do additional estimation on this issue. From an inside stakeholder view, government management system has indeed benefited the operations of Taiwan Central Government. This study concludes that there are significant variations in managerial roles. Clearly there is still more to be learned by investigating other managerial contexts and gathering more evidence on the relationship between it and job outcomes.
It is a missing link to understand how and why middle supervisors play their roles. Are they different from or similar as other types of employees? There is almost no academic writing which focuses on this issue. Although some scholars alert their existences will be serious to government, there is so little systematic research to inquire their difference. Even if very few studies focus on this issue, this research needs to accumulate more cases to support the above arguments.
References
Alonso, Pablo and Lewis, Gregory B. (2001). Public Service Motivation and Job Performance: Evidence from the Federal Sector. The American Review of Public Administration. 31(4), 363-380. Boardman, Craig and Sundquist, Eric(2009). Toward Understanding Work Motivation: Worker Attitudes and the Perception of Effective Public Service. American Review of Public Administration 39(5), 519-535.
Bono, Joyce E. and Judge, Timothy A. (2003) ‘Self-concordance at Work: Toward Understanding the Motivational Effects of Transformational Leaders’, Academy of Management Journal 46(3): 554–71.
Borzaga, C., & Tortia, E. (2006). Worker motivations, job satisfaction, and loyalty in public and nonprofit social services. Nonprofit and Voluntary Sector Quarterly, 35, 225-248.
Brewer, G. A., Selden, S. C., & Facer, R. L., II. (2000). Individual conceptions of public service motivation. Public Administration Review, 60, 254-264.
Bright, Leonard (2005). Public Employees With High Levels of Public Service Motivation Who Are They, Where Are They, and What do They Want? Review of Public Personnel Administration, 25(2), 138-154.
Bright, Leonard(2007). Does Person-Organization Fit Mediate the Relationship Between Public Service Motivation and the Job Performance of Public Employees? Review of Public Personnel Administration 27(4), 361-379. Bright, L. 2008. ‘‘Does Public Service Motivation Really Make a Difference on the Job Satisfaction and Turnover Intentions of Public Employees?’’ American Review of Public Administration 38: 149–166.
Camilleri, E. (2006). Towards developing an organizational commitment—Public service motivation model for the Maltese public service employees. Public Policy and Administration, 21, 63-83.
Camilleri, Emanuel(2007). Antecedents affecting public service motivation. Personnel Review 36(3), 356-377.
Castaing, S. (2006). The effects of psychological contract fulfillment and public service motivation on organizational commitment in the French civil service. Public Policy and Administration, 21, 84-98.
Choi, D. L. (2004). Public service motivation and ethical conduct. International Review of Public Administration,8, 99-106.
Clerkin, Richard M., Paynter, Sharon R. and Taylor, Jami Kathleen (2009). Public Service Motivation in Undergraduate Giving and Volunteering Decisions. The American Review of Public Administration 39(6), 675-698.
Coursey, D. H., & Pandey, S. K. (2007). Public service motivation measurement: Testing an abridged version of Perry’s proposed scale. Administration & Society, 39, 547-568.
Coursey, D. H., Perry, J. L., Brudney, J. L., & Littlepage, L. (2008). Psychometric verification of Perry’s public service motivation instrument: Results for volunteer exemplars. Review of Public Personnel Administration, 28(1), 79-90.
Crewson, P. E. (1997). Public-service motivation: Building empirical evidence of incidence and effect. Journal of Public Administration Research and Theory, 7, 499-518.
DeHart-Davis, L., Marlowe, J., & Pandey, S. K. (2006). Gender dimensions of public service motivation. Public Administration Review, 66, 873-887.
DeHart-Davis, L., Marlowe, J., & Sanjay, P. K. (2007) Gender dimensions of public service motivation. Public Administration Review, 66, 873-887.
Francois, Patrick (2000) ‘Public Service Motivation as an Argument for Government Provision’,Journal of Public Economics 78: 275– 99.
Frank, S., & Lewis, G. B. (2004). Government Employees: Working hard or hardly working? American Review of Public Administration, 34, 36-51.
Gabris, G. T., & Simo, G. (1995). Public sector motivation as an independent variable
affecting career decisions. Public Personnel Management, 24, 33-51.
Horton, S., & Hondeghem, A. (2006). Editorial: Public service motivation and commitment. Public Policy and Administration, 21, 1-12.
Houston, D.J. (2000), “Public-service motivation: a multivariate test”, Journal of Public Administration Research and Theory, 10(4), 713-727.
Houston, D. J. (2005). “Walking the walk” of public service motivation: Public employees and charitable gifts of time, blood and money. Journal of Public Administration Research and Theory, 16(1), 67-86.
Hui, Chun, Lee, Cynthia and Rousseau, Denise M. (2004) ‘Psychological Contract and Organizational Citizenship Behaviors in China:
Investigating Generalizability and Instrumentality’, Journal of Applied Psychology
89(2): 311–21.
Jurkiewicz, C.,&Massey, T. K. (1997). What motivates municipal employees: A comparison study of supervisory vs. non-supervisory personnel. Public Personnel Management, 26, 367-377.
Jurkiewicz, C., Massey, T. K., & Brown, R. G. (1998). Motivation in public and private
organizations. Public Productivity and Management, 21, 230-251.
Jurkiewicz, C. L., & Brown, R. G. (1998). Gen Xers vs. boomers vs. matures: Generational comparisons of public employee motivation. Review of Public Personnel Administration, 18, 18-37.
Kim, S. (2006). Public service motivation and organizational citizenship behavior in Korea. International Journal of Manpower, 27, 722-740. Kim, Sangmook(2009). Testing the Structure of Public Service Motivation in Korea: A Research Note. Journal of Public Administration Research and Theory 19(4):839-851.
Kim, Sangmook(2009). Revising Perry's Measurement Scale of Public Service Motivation. The American Review of Public Administration 39(2), 149-163.
Lewis, G.B. and Frank, S.A. (2002), “Who wants to work for government?”, Public Administration Review, 62(4), 395-404.
Liu, Bangcheng, Tang, Ningyu and Zhu, Xiaomei(2008). ‘Development of a Public Service Motivation Measurement Scale: Public service motivation and job satisfaction in China An investigation of generalisability and instrumentality. International Journal of Manpower. 29(8), 684-699.
Liu, Bangcheng(2009).Evidence of public service motivation of social workers in China. International Review of Administrative Sciences 2009; 75; 349
Moynihan, D. P., & Pandey, S. K. (2007). The role of organizations in fostering public service motivation. Public Administration Review, 67, 40-53.
Moynihan, D.P. & Pandey, S.K. (2007b), “Finding workable levers over work motivation: comparing job satisfaction, job involvement and organizational commitment”, Administration and Society, 39 (7), 803-832.
Naff, K. C., & Crum, J. (1999). Working for America: Does PSM make a difference? Review of Public Personnel Administration, 19, 5-16. Newstrom, J.W., Rief, J.W., & Monczka, R.M. (1976).Motivating the public employee:Fact vs. fiction. Public Personnel Management, 5, 67-72. Ostroff, C. (1992). The relationship between satisfaction, attitudes and performance: An
organization level analysis. Journal of Applied Psychology, 77, 963-974.
Pandey, S.K., B.E. Wright, and D.P. Moynihan. 2008. ‘‘Public Service Motivation and Interpersonal Citizenship Behavior: Testing a Preliminary Model.’’ International Public Management Journal 11(1): 89–108.
Pandey, Sanjay K., Wright, Bradley E. and Moynihan, Donald P. (2008) ‘Public Service Motivation and Interpersonal Citizenship Behavior in Public Organizations: Testing a Preliminary Model’, International Public Management Journal 11(1): 89–108.
Pandey, S.K. and Stazyk, E.C. (2008) “Antecedents and Correlates of Public Service Motivation”, in J.L. Perry and A. Hondeghem (eds) Motivation in Public Management: The Call of Public Service, pp. 101–17. Oxford: Oxford University Press.
Park, Sung Min and Rainey, Hal G. (2008) ‘Leadership and Public Service Motivation in US Federal Agencies’, International Public Management Journal 11(1): 109–42.
Perry, J., & Porter, L.W. (1982). Factors affecting the context for motivation in public organizations. Academy of Management Review, 7, 89-98.
Petty, M. M., McGee, G. W., & Cavender, J. W. (1984). A meta-analysis of the relationship between individual job satisfaction and individual performance. Academy of Management Review, 9, 712-721.
Perry, J. L., & Wise, L. R. (1990). The motivational bases of public service. Public Administration Review, 50, 367-373.
Perry, J. L. (1996). Measuring public service motivation: An assessment of construct reliability and validity. Journal of Public Administration Research and Theory, 6, 5-22. Perry, J. L. (1997). Antecedents of public service motivation. Journal of Public Administration Research and Theory, 7, 181-197.
Perry, J. L. (2000). Bringing society in: Toward a theory of public-service motivation. Journal of Public Administration Research and Theory, 10, 471-488.
Perry, J. L., Brudney, J. L, Coursey, D., & Littlepage, L. (2008). What drives morally committed citizens? A study of the antecedents
of public service motivation. Public Administration Review, 68(3), 445-458.
Perry, J. L., & Hondeghem, A. (2008). Building theory and empirical evidence about public service motivation.International Public Management Journal, 11(1), 3-12.
Perry, J. M. and A. Hondeghem, eds. 2008. Motivation in Public Management. Oxford: Oxford University Press.
Perry, James L. and Hondeghem, Annie (2008a) Motivation in Public Management: The Call of Public Service. New York: Oxford University Press.
Perry, J. M., A. Hondeghem, and L. R. Wise. 2009. ‘‘Revisiting the Motivational Bases of Public Service: Twenty Years of Research and an Agenda for the Future.’’ Paper presented at the International Public Service Motivation conference, Indiana University, Bloomington, IN, June 7–9.
Steijn, B. (2008) ‘Person–Environment Fit and Public Service Motivation’, International Public Management Journal 11(1): 13–27.
Stephens, G. Ross and Wilkstrom, Nelson (2000). Reinventing Government and Federal Downsizing-or Whose Ox is being Gored. Paper presented at the meeting of the Annual Conference of the Southern Political Science Association on National Government Reinvention: Yesterday and Today, Atlanta, GA. Taylor, J. (2007), “The impact of public service motives on work outcomes in Australia: a comparative multi-dimensional analysis”, Public Administration, 85(4),931-959.
Vandenabeele, Wouter, Scheepers, Sarah and Hondeghem, Annie (2006) ‘Public Service Motivation in an International Comparative Perspective: The UK and Germany’, Public Policy and Administration 21(1): 13–32.
Vandenabeele, Wouter (2008) ‘Development of a Public Service Motivation Measurement Scale: Corroborating and Extending Perry’s Measurement Instrument’, International Public Management Journal 11(1): 143–167.
Verquer, M. L., T. A Beehr, and S. H. Wagner. 2003. ‘‘A Meta-Analysis of Relations Between Person–Organization Fit Research and Work Attitudes.’’ Journal of Vocational Behavior 63(3): 473–489.
Self-Evaluation
This research collected the survey data from Taiwan Central Government. Even in business management, studies of middle management are far less common than those of other levels of employees and managers. For a variety of reasons, research on such managers in public administration has been largely absent, and it is also now much needed. We believe that leading TSSCI, and SSCI-journals in public administration will welcome research into this under-explored area that also brings new theoretical perspectives to bear.
Appendix 1: Internal Consistency of Construct Validity of Survey Items for Each Factor
Factor Survey Items F1 F2 F3 F4 F5 F6 I bring information about frontline service operations to upper managers 0.588
I deal with complex information and synthesize it into clear understandings 0.736 I analyze both internal and external information when assessing programs and policies 0.783 I exchange information with other agencies and external stakeholders 0.449 I analyze and evaluate how programs contribute to broader policy and agency goals. 0.779 I often suggest new ideas and initiatives for our agency 0.777 I often help with new programs and projects getting off the ground 0.834 I often try to make existing programs better 0.867 I propose new programs or projects to senior management 0.868 I support trying out new things in our agency 0.842 I often lead in developing new programs 0.808 I contribute important information in the development of new initiatives 0.842 I monitor program activities and performance 0.814 I implement policies and programs that further agency objectives 0.784 I translate goals and objectives into action plans 0.889 I represent top management initiatives to subordinates 0.859 I ensure that project teams stay on track when implementing programs 0.855 I often align or resolve conflicting purposes when implementing programs. 0.839 I help employees to adjust and accommodate new policies and practices 0.855 I locate and secure resources for implementing new, trial ideas 0.891
I mentor and guide the development of subordinates 0.846 I often put winning teams of employees together for implementing programs 0.672
I bring new actors outside the agency into the network of the program 0.655 I help create a shared vision among program participants inside and outside the agency 0.821
I develop rules for collaboration among program participants 0.872 I encourage the exchange of information among actors inside and outside the agency 0.793
I motivate actors outside the agency to become actively involved in new programs 0.783 Middle
Manager Work (Cronbath α= .9772)
I communicate agency and program values and norms to external actors 0.759
Senior managers often take initiative for developing new programs and policies 0.824 Senior managers display exemplary leadership 0.895
Senior managers ensure that the agency responds well to new problems and changes in society
0.916 Senior managers often promote more effective ways of working 0.902
Senior managers generate support from citizens and elected officials for our agency’s
mission or programs 0.828 Senior Manager
Work (Cronbath α= .9506)
Senior managers have a clear strategic vision for our agency 0.871 Respect for tradition 0.486
Thrift 0.632 Persistence (perseverance) 0.744
Modesty (looking small, not big) 0.720 Traditional
Value (Cronbath α= .7131)
Keeping time free for fun 0.361 Managers make sure that employees are aware of ethics requirements 0.730 Ethical violations are often exposed 0.623
Senior managers act according to high ethical standards 0.774 Compliance with rules and procedures is taken seriously 0.738
Decisions and actions are based on what’s best for everyone 0.667 Following laws or codes of ethics are a major consideration when making decisions 0.643 There is favoritism in hiring or promotion(R) 0.510 Standards of merit and “acceptable behavior” are unclear(R) 0.552 Ethical
Behavior (Cronbath α= .8410)
Many positions do not have qualification standards(R) 0.442 I experience many interruptions in my daily work 0.610
Work plans often change in mid-course around here 0.717 We spend a lot of time talking about personal matters at work. 0.589 I put in long hours but I still accomplish very little 0.686 Work
Difficulties (Cronbath α= .786)
I spend too much time in meetings, rather than in work 0.625 56.I get my work done efficiently 0.703 62. I produce high quality work 0.694 63.The people I serve are satisfied with the work I do 0.732 65.I am willing to start work early or stay late to finish a job 0.539 68.I achieve job goals, targets and deadlines set in my job 0.813 Perceived
Performance (Cronbath α= .8431)
87.I have good technical skills in substantive area of my work 0.669 Eigenvalue 17.794 4.576 1.837 3.683 2.095 2.901 Proportion 0.841 1.029 1.075 0.812 1.101 2.836
Appendix 1: Internal Consistency of Construct Validity of Survey Items for Each Factor(Continued)
Factor Survey Items F7 F8 F9 F10 F11 Top management has a high level of trust in their subordinates 0.778
Top management encourages subordinates to participate in decision making. 0.760 My superiors would seriously consider a request to provide extra resources to
improve service delivery leadership
0.758 I trust my superiors to make the best decisions for the organization. 0.832 Leadership
(Cronbath α= .890)
My superior is helpful 0.785
My salary is competitive 0.660 My job security is satisfactory 0.701 My job is well-respected in society 0.677 My work responsibilities are clear and specific 0.576 Work
Condition (Cronbath α= .7395)
My department upholds merit principles in hiring 0.372
I enjoy working with others in my department 0.650 I expect to be working here for many years 0.482 I build long-term and personal relations with people at work 0.670 I care about the long-term consequences of our decisions 0.785 A person should take personal responsibility for his/her own future (and not depend
on others) 0.630 Work Attitude
(Cronbath α=.7758)
Work is a principal source of my happiness 0.542
Our department encourages open and constructive dialogue 0.738 We use advanced information technology applications 0.694 We empower (ask) employees to make important decisions 0.607 We frequently develop innovative programs 0.811 Our agency rewards innovative ideas 0.756 We regularly use strategic planning 0.736 Innovation
(Cronbath α=.8644)
We use focus groups or other meetings with clients or citizens 0.507
Workplace productivity is high 0.757 We have a strong customer orientation 0.704 Individual performance appraisal holds people accountable for their performance 0.746 Staff are required to pursue continuing professional development 0.810 Managers set high performance expectations for employees 0.704 We compare our performance against similar departments 0.699 Our agency rewards excellence performance by individuals 0.727 We use “pay for performance” strategies at work 0.435 Performance
Culture (Cronbath α=.8890)
We use performance measurement in our program management 0.700 Eigenvalue 3.067 1.854 2.411 3.421 4.473 Proportion 2.890 1.204 2.299 3.216 4.165
行政院國家科學委員會補助國內專家學者出席國際學術會議報告
100 年 10 月 31 日 報 告 人 姓 名 柏門 服 務 機 關 及 職 稱 國立政治大學亞太研究 英語博士學位學程 講座教授 時 間 會 議 地 點 2011/3/11-3/15 美國馬里蘭州 巴爾地摩市 本 會 核 定 補 助 文 號 99-2410-H-004-122- 會 議 名 稱 (中文) 2011 年美國公共行政學會年會(英文) 2011 American Society for Public Administration (ASPA) Annual Conference
發 表 論 文 題 目
(中文) 東亞公共行政之比較:新發現與領域之奠基
(英文) Comparative Public Administration in East Asia: New Findings, Founding the Field
報告內容應包括下列各項: 一、參加會議經過
(一)03/11 上午赴會場註冊處報到並參與研討。
(二)03/12 赴會場參與研討並發表論文“The Impact of HRM on Public Orientations of Senior Managers in Large Special Districts”, 晚上 參加由 大會舉 辦之 歡 迎晚宴 (Welcome Reception)。
(三)03/13 參與 ROPPA 期刊、SPALR 分區以及國際分區(International Chapter)會議之 研討。
(四)03/14 主持會議並進行論文發表,主題為“Comparative Public Administration in East Asia: New Findings, Founding the Field”,會後參觀書展。
(五)03/15 會議結束。 二、與會心得 (一) 東亞的公共行政研究已日趨獲得重視,台灣身為東亞社群之一員,必然要重視國 際參與方能進一步與世界接軌。 (二) 台灣公共行政相關的學術社群需要更多的鼓勵與支持,才能在國際的廠肆上發揮 更大的影響力。 附件三
三、考察參觀活動(無是項活動者,或前已敘述者可省略此項) 略。 四、建議 (一) 台灣參與公共行政國際學術研討會的仍多以 individual paper 為主,但在競爭激烈 的情況下,被大會接受的論文進來有減少的現象。三年來本人在國內也積極協助相 關社群成員連結其他國家的學者來籌組 panel,並獲得相當成功的經驗,建議政府相 關單位可多鼓勵這種模式。 (二) 參與國際研討會後,更重要的在於後續的聯繫與國際學術合作的機會,本人近年 也協助組織了亞太公共行政研究的團隊,目前許多成員也是多次會議後進一步建立 起的學術網絡。這樣的連結有助於將台灣帶向國際,然而可以肯定的是這樣的國際 連結行動也需要更多種子計畫來支持。 五、攜回資料名稱及內容 會議手冊與學術期刊、專書。 六、其他 略
99 年度專題研究計畫研究成果彙整表
計畫主持人:柏門 計畫編號:99-2410-H-004-122- 計畫名稱:政策制訂過程中的公共經理人:對於中高階文官貢獻之探究 量化 成果項目 實際已達成 數(被接受 或已發表) 預期總達成 數(含實際已 達成數) 本計畫實 際貢獻百 分比 單位 備 註 ( 質 化 說 明:如 數 個 計 畫 共 同 成 果、成 果 列 為 該 期 刊 之 封 面 故 事 ... 等) 期刊論文 0 0 100% 研究報告/技術報告 0 0 100% 研討會論文 1 1 100% 篇 論文著作 專書 0 0 100% 申請中件數 0 0 100% 專利 已獲得件數 0 0 100% 件 件數 0 0 100% 件 技術移轉 權利金 0 0 100% 千元 碩士生 1 1 100% 博士生 0 0 100% 博士後研究員 0 0 100% 國內 參與計畫人力 (本國籍) 專任助理 0 0 100% 人次 期刊論文 0 0 100% 研究報告/技術報告 0 0 100% 研討會論文 1 1 100% 篇 論文著作 專書 0 0 100% 章/本 申請中件數 0 0 100% 專利 已獲得件數 0 0 100% 件 件數 0 0 100% 件 技術移轉 權利金 0 0 100% 千元 碩士生 0 0 100% 博士生 0 0 100% 博士後研究員 0 0 100% 國外 參與計畫人力 (外國籍) 專任助理 0 0 100% 人次其他成果