i
國立交通大學
應用化學系
碩 士 論 文
結合連續波與飛秒脈衝雷射在時間與空間上控制甘
胺酸單一結晶的形成
Spatial-temporally controlled single crystal formation of glycine by a
combination of continuous wave and femtosecond pulse lasers
研究生:黃彥樺
指導教授:增原 宏 教授
ii
結合連續波與飛秒脈衝雷射在時間與空間上控制甘
胺酸單一結晶的形成
Spatial-temporally controlled single crystal formation of glycine by a
combination of continuouswave and femtosecond pulse lasers
研 究 生:黃彥樺 Student:Yan-Hua HUANG
指導教授: 增原宏 博士 Advisor:Dr. Hiroshi MASUHARA
國 立 交 通 大 學
應用化學系
碩 士 論 文
A Thesis
Submitted to M. S. Program
Department of Applied Chemistry
National Chiao Tung University
in Partial Fulfillment of the Requirements
for the Degree of
Master
in
Applied Chemistry
July 2012
Hsinchu, Taiwan, Republic of China
iii
Spatial-temporally controlled single crystal formation of glycine
by a combination of continuouswave and femtosecond pulse lasers
Student:Yan-Hua HUANG
Advisor:Dr. Hiroshi MASUHARA
M. S. Program, Department of Applied Chemistry
National Chiao Tung University
Abstract
Light irradiation-induced crystallization is attracting much attention as novel phenomena and as potential methods to control single crystal formation. It has been reported that focusing of an amplified fs pulse (J ~ mJ/pulse) into a supersaturated solution induces the bubbling due to fs laser-induced break-down of water and eventual crystallization and CW laser trapping with saturated solution induces local concentration increase and spatially controlled crystallization. Recent report on fs laser trapping of particles stimulating us to use fs pulses to improve laser trapping crystallization technique. We can expect higher crystallization efficiency with higher photon density of fs laser in a short time compare to CW laser. Thus here we report first demonstration of low energy fs pulse utilized laser trapping crystallization of glycine without conventional bubbling.
Glycine/D2O solution (2.4~2.6 M, supersaturation degree: 0.9~1.0) was prepared and a
portion of the solution was dropped in a sealed glass sample chamber to form a thin liquid layer (~120 m). An output from Ti:sapphire laser (=800 nm), which can be operated with pulse (80 MHz, 150 fs) and CW modes, was focused to the air/solution interface through an objective lens (60X, NA 0.90).
iv
crystallization is below than that of the bubbling. No bubbling and no other apparent nonlinear behavior was observed during crystallization. Crystallization was effectively induced compared to 800 nm CW laser utilized trapping crystallization. We consider that repetitively exerted photon pressure induced by irradiated fs laser pulse collects molecules, forms high concentration area locally around the laser spot, and induces fluctuation and re-orientation of the clusters, leading to crystallization.
However frequently observed fs laser ablation on generated crystal resulted in polycrystal formation. Thus we need to improve the crystallization method to make the application of femtosecond laser in single crystal formation. We have examined a single crystal generation which was induced by fs only or a fs/CW combination. Finally we succeeded to make single crystal by a combination of fs and CW laser trapping. The most important achievement in this study is the success of single crystal generation by combining short fs irradiation and CW laser irradiation. By this method, we can generate one single crystal with high spatial and temporal controllability.
v
結合連續波與飛秒脈衝雷射在時間與空間上控制甘胺酸單一結晶
的形成
研 究 生:黃彥樺 指導教授:增原宏 博士 國立交通大學 應用化學系碩士班中文摘要
光線照射誘導結晶,作為新的現象和潛在的控制單晶形成方法,吸引了研究者的高度 重視。文獻指出增幅脈衝雷射在過飽和溶液中誘發水分解,而產生冒泡導致結晶;和連 續波雷射捕陷於飽和溶液中,誘發局部高濃度並於空間上控制結晶化。近來的飛秒脈衝 雷射捕陷分子研究,促使我們使用飛秒雷射來改善雷射捕陷結晶化技術。相較連續波雷 射,飛秒脈衝雷射在單一脈衝的時間內有更高的光子數,因此我們可以期待飛秒雷射可 以帶來更好的結晶效率。這裡我們第一個示範以低能量飛秒脈衝雷射執行雷射捕陷結晶 化,並且過程中沒有觀察到冒泡現象。 甘胺酸重水溶液(2.4~2.6 M,飽和度:0.9~1.0)滴入一個密封的玻璃容器並形成一個薄 的液層(~120 m)。Ti:sapphire 雷射(=800 nm)可以控制輸出為脈衝(80 MHz, 150 fs)及連 續波模式,此雷射光經由物鏡(60X, NA 0.90)聚焦到空氣與溶液的介面。 我們到在飛秒雷射的焦點上觀察到結晶的產生,結晶過程中並沒有觀察到冒泡及其他 非線性光學現象,得知雷射誘發結晶的低限能低於冒泡的低限能。相較於同樣波長的連 續波雷射捕陷結晶化技術,飛秒脈衝雷射誘發結晶是更有效率的,我們認為飛秒雷射以 更強的光壓收集分子,在焦點形成局部高濃度,並誘導分子叢的變動及從新排列,進一 步使結晶化產生。 然而,飛秒雷射能量太強,熔蝕了結晶,導致多核結晶的形成,因此我們必須改善結 晶的方法使飛秒雷射應用於單一結晶的製備。我們驗證了只使用飛秒雷射的條件,或結 合連續波與飛秒脈衝雷射,並在這些條件下成功的控制單一結晶的形成。最重要的方法 是結合短時間的飛秒雷射照射,及長時間的連續波雷射照射,形成單一結晶,我們可以 使用這個方法達成高度的時間及空間上的控制能力。vi
Acknowledgement
I feel very lucky that I had the chance to join this great group. I met many foreign peoples. We discussed, worked, and exchanged culture, shared nice experiences. During the study in this laboratory, I had a chance to visit Japan to learn experimental skill. That was my first time to go to an aboard. These experiences are so beautiful that I cannot forget forever. Life in this laboratory is really enjoyable and I thank everything here.
I have to appreciate to my supervisor, Prof. Masuhara. He kindly guided me in this laboratory. His scientific thinking way and sense are stimulating. I am very glad and proud that I can study with him.
Thank to Prof. Miura, the closest teacher. We are frequently discussing and contacting, even fighting with different viewpoints. Thanks to his kindness teaching, without that, I must not able to finish my study. I am very appreciating that we had such special relationship in this two years.
I also want to thank Prof. Sugiyama that he gives me lots useful suggestions. His great supporting let me breakthrough my blind spots of my research. Dr. Yuyama improves my understanding of my study and gives me helpful ideas. Dr. Usman teaches me a lot and helps me how to construct optical setup. Prof. Uwada gives me the suggestions for a positive
vii
research attitude. I am very grateful for their help.
I must have to thanks my seniors and classmates: 許平諭, 杜靜如, 劉宗翰, 黃重維, 曾 綮續, 許孜瑋, 王順發, 江威逸, 黃鈴婷, 吳奇勳。Thanks for their companying with nice atmosphere and encouragement to me when I was disappointed. Specially thanks to 許平諭, 杜靜如, 黃重維, they help me a lot for research and how to live in Hsinchu. Wish them will get great achievement in the future.
Finally, sincerely thanks to my family and friends for their supporting and concerning and support to finish master degree.
viii
Table of Contents
Abstract ... iii
中文摘要 ... v
Acknowledgement ... vi
Table of Contents ... viii
List of Figures ... xi
List of Tables ... xv
1. Introduction ... 1
1.1 Laser trapping ... 1
1.1.1 History of laser trapping ... 1
1.1.2 Principle of laser trapping ... 2
1.1.3 Laser trapping-induced assembly formation ... 5
1.1.4 Laser trapping by applying pulse laser ... 8
1.2 Crystallization ... 9
1.2.1 History of biomolecular crystallization ... 10
1.2.2 Crystallization theory ... 11
1.3 Light-induced crystallization methods ... 14
1.3.1 Kerr effect crystallization ... 14
1.3.2 Photochemical reaction-induced crystallization ... 15
1.3.3 Amplified femtosecond laser-induced crystallization ... 16
1.3.4 Laser trapping crystallization ... 17
1.4 Motivation ... 18
2. Experiment ... 20
2.1 Materials ... 20
2.2 Property of glycine ... 22
ix
2.3.1 Continuous wave laser light source ... 26
2.3.2 Femtosecond laser light source ... 27
2.4 Microscope setup for imaging of crystallization behavior ... 28
2.5 Fourier transfer infrared spectra measurement ... 29
3. Continuous Wave Laser-Induced Crystallization... 32
3.1 Power dependence of laser trapping crystallization ... 32
3.2 Volume/Thickness dependence of laser trapping crystallization ... 37
3.3 Summary ... 39
4. Femtosecond Laser-Induced Crystallization ... 40
4.1 Crystallization of glycine by femtosecond pulse laser ... 40
4.2 Power dependence on fs laser trapping crystallization ... 43
4.3 Focus position dependence on fs laser trapping crystallization ... 44
4.4 Comparison between fs and CW laser trapping crystallization ... 45
4.5 Discussion ... 50
4.5.1 Trapping by low energy fs laser operated at high repetition rate ... 50
4.5.2 Comparisons of fs laser trapping crystallization and amplified fs laser-induced crystallization ... 52
4.5.3 Comparisons of fs and CW trapping crystallization ... 54
4.6 Summary ... 55
5. Single crystal formation by a combination of fs and CW lasers ... 56
5.1 Femtosecond laser-induced crystallization: Approach 1, fs for nucleation and growth without laser irradiation ... 56
5.2 Femtosecond laser-induced crystallization with further CW laser irradiation ... 60
5.3 Low power CW laser trapping crystallization with a short time irradiation of fs laser ... 63
5.4 Temporal control of crystallization by millisecond exposure time of fs laser ... 68
5.5 FTIR measurements for generated glycine crystals ... 72
x
6. Summary ... 77 7. Reference ... 79
xi
List of Figures
Fig. 1.1 Ray diagram shows difference of the direction of gradient force (gray arrows) induced by unfocused (a) and focused (b) light. ... 3 Fig. 1.2 Schematic drawing of the relationship between refractive indices of particle (n1)
and medium (n2) and the direction of gradient force (F). ... 4
Fig. 1.3 Schematic view of PNIPAM assembly via photon pressure and phase transition [12]. ... 6 Fig. 1.4 Schematic picture of proposed transportation of nanoparticles due to the
convection flow under the laser trapping in water. [20]. ... 7 Fig. 1.5 Schematic drawing of classical nucleation theory, crystal growth by packing of
molecules [34]. ... 11 Fig. 1.6 Schematic illustration of the two-step mechanism of nucleation of crystals (dot
line) [35]. ... 12 Fig. 1.7 Free energy diagram for possible crystallization processes [34]. ... 13 Fig. 1.8 Phase diagram showing the solubility depends on temperature and concentration.
Once solution became highly saturated with higher free energy in the labile or metastable region, nucleation could take place, causing a reduction of free energy and the phase returned to the stable region. ... 13 Fig. 1.9 Mechanism of (a) the photochemically induced nucleation of lysozyme, and (b)
enhancement of protein crystallization by a photochemical reaction [44]. ... 15 Fig. 2.1 Pictures of container made of (a) cut glass vial and (b) short glass tube. ... 22 Fig. 2.2 Schematic drawing of surface shape: (a) cut glass vial and (b) short glass tube. .... 22 Fig. 2.3 The chemical structure of glycine. ... 23 Fig. 2.4 Schematic diagram of the morphology of the (a) - and (b) -glycine single
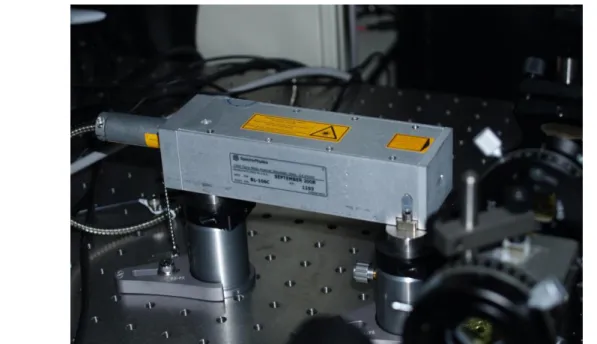
crystals [4]. ... 24 Fig. 2.5 Picture of Nd:YVO4 laser, J20-BL10-106Q, used in this study. ... 27
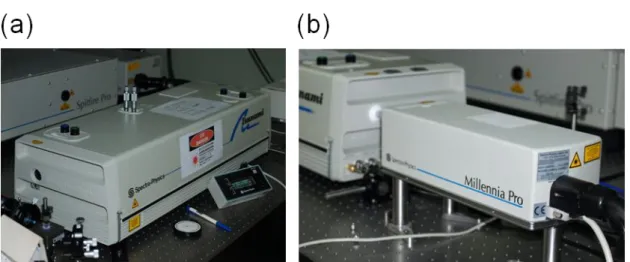
Fig. 2.6 Picture of (a) mode-locked Ti:sapphire laser, Tsunami and (b) pump laser, MillenniaPro... 28 Fig. 2.7 Optical set up of laser-induced crystallization system. ... 29 Fig. 2.8 A multiple reflection ATR system. Light undergoes multiple internal reflections in
the ATR crystal of high refractive index, shown in yellow. The sample is in contact with the crystal. ... 31 Fig. 3.1 Power dependence of laser trapping crystallization with a focused (a) CW 1064
nm and (b) CW 800 nm laser. Laser was focused to the air/solution interface of the glycine solution. Power of 200, 400, 600, and 800 mW CW laser was examined for 1064 nm with 1.0 SS solution; Power of 400 and 600 mW CW laser was examined
xii
for 800 nm with 0.9 SS solution. The examined crystallization time is 30 minutes. ... 33 Fig. 3.2 Images of glycine crystal generation and growth by CW laser trapping. Saturation
degree is 0.9 SS. Laser power is 600 mW. ... 34 Fig. 3.3 Solution height change during 1064 nm CW laser irradiation in cover glass case,
laser was focused to the air/solution interface of the thin glycine solution layer formed on the glass substrate. Above curve was obtained with 1.32 SS solution. Laser power is 1.0 W. Asterisk indicates the timing when crystallization occurred. ... 36 Fig. 3.4 Solution height change during 1064 nm CW laser irradiation in cut glass vial case.
Laser was focused to the air/solution interface of the glycine solution. Above curve was obtained with 1.0 SS solution. 200, 400, 600 mW laser power was examined. Cut glass vial was used as a container. Asterisk indicates crystallization occurred in 600 mW case. ... 37 Fig. 3.5 Solution (a) volume and (b) thickness dependent crystallization time. Curves were
obtained with 1.32 SS solution. Laser power is 1.0 W. Short glass tube was used as a container. ... 38 Fig. 3.6 Solution thickness dependence on crystallization time. Curves were obtained with
1.32 SS solution. Laser power is 1.0 W. Short glass tube was used as a container. Asterisk indicates crystallization occurred. ... 38 Fig. 4.1 Images taken during fs pulse laser induced trapping crystallization. Before fs laser
irradiation (a), generated crystal (b), and trapped and grown crystal (c) and (d). Saturation degree of solution is 1.0 SS. Laser power is 600 mW. Similar to CW laser trapping crystallization, solution height did not change obviously but slightly decreased during fs laser irradiation to the air/solution interface. ... 41 Fig. 4.2 Comparison of the solution height change under trapping laser irradiation. Both
1064 nm CW (blue line) and 800 nm fs (red line) lasers were ste to the same average power (400 mW) and focused to the air/solution interface of the glycine solution. Asterisk indicates the moment crystallization occurred in 800 nm fs laser. Black dotted line in the figure is solution height change without laser irradiation. 42 Fig. 4.3 Power dependence of crystallization time of fs laser trapping crystallization. 100,
200, 300, 400, and 600 mW fs laser was applied. Observation time is 30 min. Saturation degree of solution is 0.9 SS. ... 43 Fig. 4.4 Focus position dependence on fs laser trapping crystallization. Crystallization
occurred only focusing to the air/solution interface as well as CW laser trapping crystallization. Saturation degree of solution is 0.9 SS. Laser power is 600mW. ... 45 Fig. 4.5 Snapshots of laser trapping crystallization process induced by (a) CW and (b) fs
xiii
solution is 0.9 SS. ... 47 Fig. 4.6 (a) Crystal pictures and crystal size definition, and (b) crystal growth rate by
irradiating fs and CW lasers. Laser power is 600 mW. Saturation degree of the solution is 0.9 SS. ... 48 Fig. 4.7 (a) Crystallization probability and (b) crystallization time induced by fs and CW
lasers. Green and red markers correspond to CW and fs laser, respectively. Examined laser powers are 100, 200, 300, 400, 600 mW. Saturation degree of the solution is 0.9 SS. Observation time is 30 min. ... 48 Fig. 4.8 Pictures of (a) CW laser-induced single glycine crystal and (b) fs laser-induced
polycrystal. In fs case, crystal growth and damage on the crystal surface simultaneously took place. ... 49 Fig. 4.9 Illustration of laser energy comparison of low energy fs laser, amplified fs laser,
and CW laser. ... 50 Fig. 4.10 Schematic drawing of femtosecond laser trapping induced accumulation of
molecule at the focal spot... 52 Fig. 4.11 Schematic drawing of focused amplified fs laser and low energy fs laser focused
into the solution. Micrometer-size cavitation bubble plays a key role in amplified fs laser. Supersaturated glycine solution is necessary in the amplified fs laser case. ... 54 Fig. 5.1 (a) Sequential pictures obtained during fs laser trapping crystallization and crystal
growth without laser irradiation and (b) schematic drawing of femtosecond laser-induced crystallization by terminating fs laser irradiation after observing crystal generation. fs laser power is 400 mW. Saturation degree of solution is 1.0 SS. ... 57 Fig. 5.2 Schematic drawing of solvent evaporation process to obtain a millimeter-size
crystal. ... 58 Fig. 5.3 Pictures of the obtained millimeter-size single crystal of femtosecond
laser-induced crystallization without further irradiation. ... 59 Fig. 5.4 Schematic drawing of dissolution of formed crystal in unsaturated region. Deep
blue means the high concentration area induced by trapping laser. ... 60 Fig. 5.5 (a) Pictures of the crystallization and (b) schematic drawing of fs laser-induced
crystallization with further CW laser irradiation. Power of both fs and CW laser is 400 mW. Saturation degree of solution is 1.0 SS. ... 61 Fig. 5.6 Pictures of the obtained millimeter-size single crystal of femtosecond
laser-induced crystallization with further continuouswave laser irradiation. ... 62 Fig. 5.7 Schematic drawing of low power CW laser trapping crystallization with a short
time irradiation of fs laser. ... 64 Fig. 5.8 (a) Schematic drawing of laser irradiation manner in simultaneous fs and CW laser
xiv
irradiation. (b) Laser trapping crystallization of glycine by focusing 1064 nm cw and 800 nm fs laser simultaneously. The limited experiment time is 30 minutes. Saturation degree of solution is 1.0 SS. ... 65 Fig. 5.9 (a) Schematic drawing of laser irradiation manner in method 3. (b) Success
probability and crystallization time of low power CW laser trapping crystallization with a short time irradiation of fs laser. The red arrow means fs laser irradiated. The limited experiment time is 30 minutes. Saturation degree of solution is 1.0 SS. ... 66 Fig. 5.10 Pictures of the crystallization of low power CW laser trapping crystallization with
a short time irradiation of fs laser. ... 67 Fig. 5.11 (a) Images and (b) schematic drawing of temporally controlled laser-induced
crystallization by millisecond short time irradiation of fs laser. Power of fs and CW lasers are 200 and 400 mW, respectively. Saturation degree of solution is 1.0 SS. . 69 Fig. 5.12 Schematic mechanism of millisecond short time irradiation of fs laser induced
crystallization. fs laser irradiation gathers the surrounding glycine cluster together. Suddenly concentration became high enough for crystallization. ... 70 Fig. 5.13 Phase diagram showing the solubility depends on temperature and concentration.
Suddenly fs laser irradiation induced highly saturated area in the labile region and finally persuaded nucleation and crystallization. ... 71 Fig. 5.14 FTIR spectra of glycine crystals prepared by single crystal formation by
combination of CW and fs laser.- and -form spectra of glycine-d3 was obtained
xv
List of Tables
Table 2.1 Solubility of glycine in H2O and D2O [2]. ... 23
Table 4.1 Crystallization probability and time for different trapping laser power of fs and CW laser trapping crystallization. ... 47 Table 5.1 Setting fs laser irradiation time and crystallization probability under different
combination of CW and fs lasers ... 67 Table 5.2 Vibrational frequencies of N-deuterated glycine (ND3+CH2COO-, glycine-d3) .... 74
1
1. Introduction
1.1 Laser trapping
Laser trapping is a powerful technique for controlling and manipulating particles in chemistry, biology and physics. This technology has offered a precise method for manipulating objects from a few tens of nanometer to tens of micrometer in size by using the optical gradient force. A continuous wave (CW) laser is usually used for the laser trapping, meanwhile we introduce femtosecond pulse laser for trapping molecules and forming molecular assembly, and then induced crystallization.
1.1.1
History of laser trapping
Arthur Ashkin is one of the pioneers of laser trapping. He and his colleagues were first demonstrated the optical trapping of transparent micron-sized particle in 1970 [1] . They observed that micron-sized particle in liquids or gas can be trapped by radiation pressure caused by exerted laser. Based on the basic scatting and gradient force of radiation pressure, the trapping of neutral dielectric particles and atoms have been demonstrated [2, 3]. They also demonstrated non-destructive manipulation of living cells such as bacteria later [4].
2
of atoms to dimensions less than the optical wavelength [5]. He received the Nobel Prize in physics in 1997 along with Claude Cohen-Tannoudji and William Daniel Phillips by this work. Indeed it was a very big breakthrough to control atom in the 1 Å scale.
Until now, this technique has been widely applied to physics and biological studies. Usually laser trapping is applied to manipulate single micrometer to nanometer-sized particles, and now being developed to combine with single molecule spectroscopy [6].
1.1.2
Principle of laser trapping
Laser trapping is a physical phenomenon which is described by the interaction between light and objects. Traditionally, optical force enables to trap and manipulate small particle is clarified into two parts: gradient force and scattering force. The former is directed along the spatial laser gradient and the latter is along the direction of light propagation. For stable trapping of objects, three-dimensional intense gradient force is necessary. This condition is provided when very sharp light intensity change is achieved by using an objective lens with high numerical aperture (N.A.). The steep gradient force which transfers the object to the focal region must be larger to exceed the scattering force which moves the object away from the focal region.
In developing a theoretical treatment of optical trapping, there are two limiting cases for which the force on a sphere can be readily calculated. When the trapped sphere is much
3
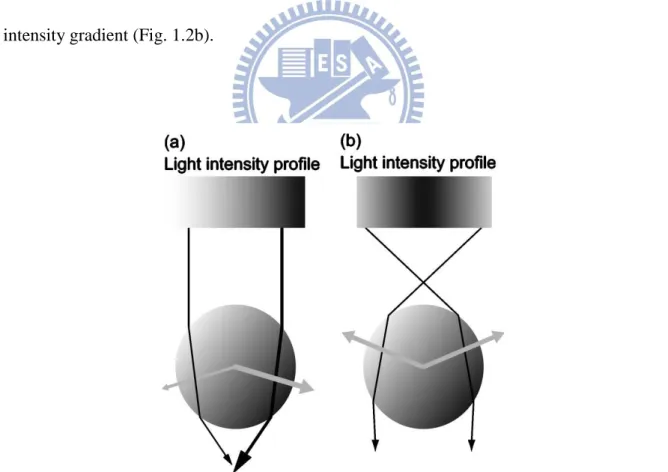
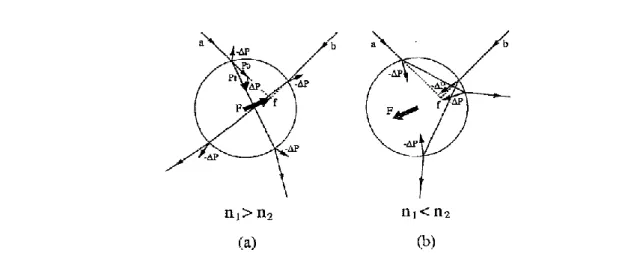
larger than the wavelength of the trapping laser, the conditions for Mie scattering are satisfied [7]. Refraction of the incident light by the sphere corresponds to a change in the momentum carried by the light. By Newton’s third law, changed momentum of photon and that of the object should be equal. The force on the sphere, given by the rate of momentum change, is proportional to the light intensity (Fig. 1.1). When the refractive index of refraction of the particle is greater than that of the surrounding medium, the optical force arising from refraction is in the direction of the intensity gradient (Fig. 1.2a) [8]. Conversely, for an index lower than that of the medium, the force is in the opposite direction of the intensity gradient (Fig. 1.2b).
Fig. 1.1 Ray diagram shows difference of the direction of gradient force (gray arrows) induced by unfocused (a) and focused (b) light.
4
For another case, Rayleigh scattering are satisfied when the trapped sphere is much smaller than the wavelength of the trapping laser. The particle can be treated as a point dipole under this condition. We need to consider the interaction between an electric field of the light and dipole moment of the particle. Gradient and scattering forces are expressed in equation 1.1 and 1.2, respectively, where E and B denote electric field, and magnetic field. σ p is the scattering cross section of a particle. c denotes the speed of light in vacuum. α in
equation 1.3 is the polarizability of a particle under the light condition, where r is the radius of the particle, and εm is the dielectric constant of the surrounding medium. np and nm are the
refractive indices of the particle and the surrounding medium, respectively.
……….…….….……… (1.1) ……….…….……… (1.2) ……….…….……… (1.3)
Fig. 1.2 Schematic drawing of the relationship between refractive indices of particle (n1)
5
As the high N.A. objective lens is employed, the trapping potential becomes to the equation 1.4. When trapping potential energy overcomes the energy of a Brownian motion
kBT, where kB is the Boltzmann constant and T is the temperature in Kelvin, photon pressure
makes it possible to control the object.
……….…….……… (1.4)
Similarly, as in Ray optics, the condition for driving the object toward the focal region, the refractive index of the object should be larger than that of medium (np > nm)
1.1.3
Laser trapping-induced assembly formation
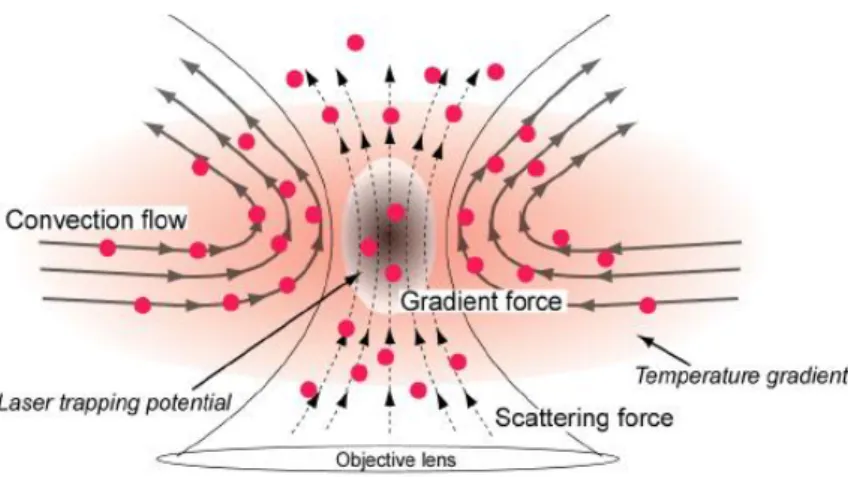
Extending the laser trapping technique allowed scientists to investigate the interaction of particles, such as colloids [9], polymers and membranes [10]. Laser trapping technique has been demonstrated to assemble small particles of colloids and polymers [11, 12] to create their assembly which is larger than the focal spot size. Masuhara and his colleagues investigated the assembly formation of many polymer molecules under photon pressure [13-15] and its solvent dependence [16]. Fig. 1.3 describe schematic representation of assembly formation of Poly(N-isoprpryl acrylamide) (PNIPAM) that induced by focusing of trapping light source into its solution [12].
6
On the other hand, heat generation by absorption of focused light is inevitable in laser trapping since both solvent and solute can absorb the trapping laser light. It induces Marangoni convection flow [17, 18] and enhances mass transfer that increases molecular transportation which should cooperate with photon pressure to collect molecules in liquid-liquid system [19]. Recently Uwada et al. visualized the convection flow under laser trapping by using gold nanoparticle as probe of the motion of the particle in the solution with Rayleigh scattering microscopy as shown in Fig. 1.4. [20].
Fig. 1.3 Schematic view of PNIPAM assembly via photon pressure and phase transition [12].
7
Previously reported molecular assembly formations, such as PNIPAM assembling, induced by laser trapping imply a possibility of the formation of more advanced molecular assembling not only collect the solutes but also the crystallization. Tsuboi et al. reported the assembling of several amino acids under laser trapping in solution by using Raman scattering and backward scattering detection [21]. They concluded that laser trapping induced assembly is formed by trapping clusters of solute molecules. They also examined laser trapping of Lysozyme and observed small assembly formation during trapping laser irradiation. They can observe the crystal of lysozyme only after a few days later of trapping laser irradiation [22]. It suggests crystallization could be initiated from a protein aggregate which formed by photon pressure during trapping. We can find other laser trapping crystallization study of Lysozyme from Rubinsztein-Dunlop’s group. They applied trapping to induce the crystal growth [23] and investigated directional crystal growth under trapping
Fig. 1.4 Schematic picture of proposed transportation of nanoparticles due to the convection flow under the laser trapping in water. [20].
8
[24, 25]. However no in-situ and real-time laser trapping crystallization of protein has been done yet.
1.1.4
Laser trapping by applying pulse laser
As we mentioned above, conventional laser trapping technology typically use CW laser as a light sources of trapping that need only a few mW power to investigate tweezing of micrometer objects in three dimensions. While CW tweezers have been tremendously successful, femtosecond pulse lasers provide extremely high pulse peak energy that allow to access nonlinear processes within trapped particles, such as multi-photon absorption and harmonic generation.
Malmqvist and co-workers have demonstrated second harmonic generation from optically trapped nonlinear Rayleigh particles using a femtosecond titanium-sapphire laser [26]. Xing and co-workers have presented numerical modeling and theoretical analysis which predicts that femtosecond laser trapping are entirely feasible [27].
Dholakia and his colleagues investigated the relative Q-values in the femtosecond and CW regimes shows that femtosecond laser trapping are just as effective as CW laser trapping [28]. This verifies that an average power is playing key role rather than the peak power for optical trapping. They also demonstrate simultaneous laser trapping and in-situ control of two-photon fluorescence (at 400 nm) from dye-doped polymer microspheres with
9
femtosecond laser. A distinctive advantage in using femtosecond tweezers rather than CW tweezers is that the characteristically high peak powers of femtosecond pulses can be used to exploit nonlinear optical processes.
Tamai and colleagues investigated nanometer-sized CdTe quantum dots (QDs) in D2O can
be optically trapped by a high repetition-rate picosecond Nd: YLF laser with an input power as low as 100 mW [29], while an extreme high power (20 W) is necessary in CW laser trapping. A large two-photon absorption (TPA) cross section of 104–105 GM for CdTe QDs makes it possible to detect the trapping process with TPA induced luminescence.
Recently, Okamoto’s group demonstrated a novel phenomenon of trapping arising from nonlinear polarization when we trap gold nanoparticles (AuNPs) by femtosecond near-infrared (NIR) laser pulses [30]. The stable trap site of AuNPs is split into two equivalent positions. The trap positions are aligned along the direction of the incident laser polarization. The results were successfully interpreted in terms of the nonlinear polarization caused by the femtosecond pulses.
1.2 Crystallization
In this dissertation, I demonstrate new crystallization method induced by femtosecond pulse laser trapping. Crystallization is closely related to our daily life such as the salt isolation from seawater and diamond formation in the deep earth under high temperature
10
and pressure. Crystal provides molecule packing information and is used in wide fields of science and technology.
1.2.1
History of biomolecular crystallization
The history of macromolecular crystallization described by McPherson can be traced back to more than 150 years ago [31]. The first published observation of the protein crystallization was reported by Hunefeld in 1840 [32]. They reported the crystallization of hemoglobin from the earthworm. The plate-like crystal was observed when the blood of an earthworm was pressed between two microscope slides. The first structural determination of biomolecule with X-ray analysis has done for vitamin B-12 in 1957 by D. C. Hodgkin [33]. She received the Novel prize for chemistry as the result of this research.
Crystallization has been studied for long time, however, its process is very complex and crystallization of biomolecule is still very difficult. In order to understand the fundamentals of crystallization to obtain better crystals, massive efforts were made on optimized crystallization and crystal growth of basic molecules, such as small organic compounds and amino acids. Crystallization of amino acids, which are the basis unit of protein, is important works for protein crystallization. We have been conducting laser trapping crystallization study and already possess knowledge for the crystallization of amino acids, especially on glycine. Therefore we employed amino acid, glycine, in this work. Until now, crystallization
11
of protein is still quite empirical. By studying the crystallization of amino acids, we are also expecting to gain further understanding of crystallization of proteins from the results of this study.
1.2.2
Crystallization theory
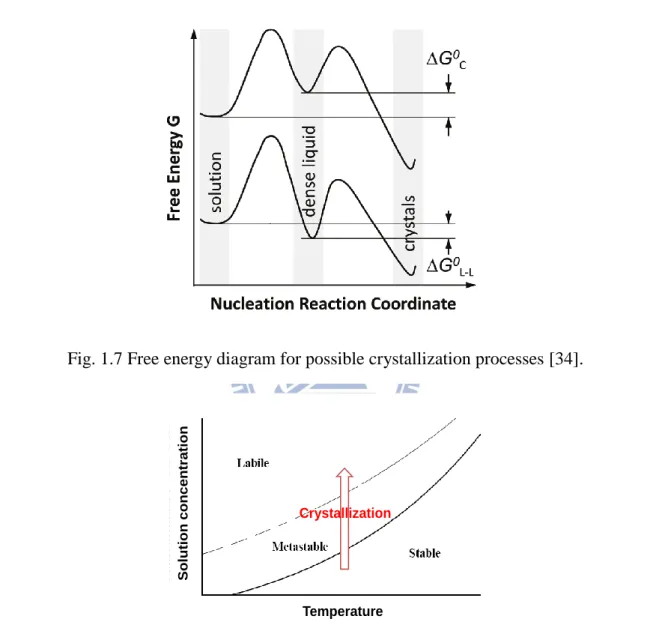
Crystallization is a phase separation process and used as a purification method. Usually, concentration of solution for crystallization must be at supersaturation which is achieved by many variable methods such as vapor pressure, temperature and pH valve. The crystallization process consists of two major parts; nucleation and crystal growth. The birth of a new crystal is called nucleation. It indicates that molecular aggregate becomes larger than the critical size. Traditionally, the classical nucleation theory has been employed for the nucleation process, but it starts with tiny size and is difficult to observe experimentally [34]. After nucleation, a subsequent process is known as crystal growth where nuclei grow larger. Molecules are continuously packing with each other in the regular ordering (Fig. 1.5).
Fig. 1.5 Schematic drawing of classical nucleation theory, crystal growth by packing of molecules [34].
12
However, a number of differences between theoretical predictions and experimental results suggest that nucleation of solids from solution does not proceed via the classical nucleation theory but follows more complex routes. In this account, the development of the modern two-step model was discussed. In the two-step model, a highly disordered dense liquid droplet was formed, after that the cluster inside the droplet reorganized into an ordered alignment [35, 36].
The experiments discussed below demonstrate that nucleation of crystals of the protein lysozyme proceeds in two steps: the formation of a droplet of a dense liquid, followed by nucleating a periodic crystal within the droplet. When the dense liquid is not stable but has a higher free energy than the dilute solution (ΔG0
> 0, represented by the upper curve in Fig. 1.7, the dense phase is metastable with respect to both the solution and the crystals and only Fig. 1.6 Schematic illustration of the two-step mechanism of nucleation of crystals (dot line) [35].
13
exists as a density fluctuation of a limited lifetime; If the dense liquid is stable with respect to the dilute solution (ΔG0
< 0, represented by the lower curve in Fig. 1.7), the nucleation of crystals occurs inside macroscopic droplets of this phase.
Fig. 1.8 Phase diagram showing the solubility depends on temperature and concentration. Once solution became highly saturated with higher free energy in the labile or metastable region, nucleation could take place, causing a reduction of free energy and the phase returned to the stable region.
Crystallization Temperature Solution con cen tr ation
14
1.3 Light-induced crystallization methods
Light-induced crystallization can be realized with various light sources through different mechanisms, such as photochemical and nonphotochemical processes where applicable light sources are Xe lamp, CW laser or pulse laser at different wavelengths ranging from UV to NIR region.
1.3.1
Kerr effect crystallization
In 1996, Garetz et al. discovered that intense nanosecond NIR laser pulses (pulse duration: 20 ns, repetition rate: 10 Hz, wavelength: 1.06 m) can induce nucleation of urea solution. The solutions are transparent at the incident wavelength, a photochemical mechanism is unlikely. This phenomenon was named as nonphotochemical laser-induced nucleation (NPLIN). The needle-shaped crystals that initially form tend to be aligned parallel to the electric field vector of the light. They suggested that the electric field-induced realignment of urea molecules results in cluster formation, and this mechanism is known as the optical Kerr effect [37]. Nucleation of glycine was also demonstrated and the polymorph of glycine was controlled by changing polarization of laser beam [38, 39] or by additionally applying strong DC electric field to enhance the optical Kerr effect [40].
15
1.3.2
Photochemical reaction-induced crystallization
Okutsu et al. have reported photochemical reaction-induced crystal growth and morphology control of anthracene [41]. Furthermore, they have investigated photochemical reaction-induced nucleation of hen egg-white lysozyme (HEWL) [42], thaumatin [43], and ribonuclease A (RNaseA) [44]. In the lysozyme crystallization experiment, they exposed UV light (wavelength: 280, 300 and 400 nm) from Xe lamp (wavelength: 200-800 nm, USHIO UXL-300D) to supersaturated but metastable lysozyme solution and produced photochemical intermediate (Fig. 1.9). The photochemical product, the protein dimer, behaved as the smallest cluster of nucleation. Okutsu gave a representative demonstration of photochemical reaction-induced nucleation. However, it is not known for sure how radical formation affects the purity of the obtained protein crystal.
Fig. 1.9 Mechanism of (a) the photochemically induced nucleation of lysozyme, and (b) enhancement of protein crystallization by a photochemical reaction [44].
16
1.3.3
Amplified femtosecond laser-induced crystallization
Hosokawa et al. was firstly demonstrated HEWL crystallization by amplified femtosecond laser in 2003 [45]. Besides, urea [46], anthracene [47] and 4-(dimethylamino)-N-methyl-4-stilbazolium tosylate (DAST) [48] crystallizations were also reported in following years. Femtosecond laser-induced crystallization is triggering nucleation by multiphoton absorption of solvent leading to optical breakdown and is less related with solute. When an intense femtosecond laser light is focused into water, multiphoton absorption of water induces nonlinear phenomena such as shockwaves and cavitation bubbles. These nonlinear phenomena were also described as laser tsunami.
Our collaborator Uwada also demonstrated the amplified fs laser induced crystallization of glycine and lysozyme from its supersaturated solution [49]. Pulse energy and repetition rate dependences show that the frequency of cavitation bubble generation induced by multiphoton absorption of water is playing a key role for nucleation process. The local concentration change around the cavitation bubble will probably induce nucleation of crystals. They also observed significant increase of crystallization probability by focusing fs pulses at the air/solution interface. They ascribe the reason of observed increasing of crystallization probability to molecular adsorption at the interface where restricted freedom of molecular motion may improve molecular ordering at the generated bubble surface.
17
laser-induced cavitation bubble behavior and the subsequent nucleation of crystals. The bubble size was expanding and shrinking. In order to discuss the importance of Rayleigh bubble to crystallization, Murai et al. increased the viscosity of lysozyme solution by adding agarose gel against protein diffusion from the focal point and recorded the conformation change of bubbles [50]. They successfully observed the formation of locally high concentration region induced by bubble conformation change leaded to elevate crystallization probability around the surface of bubble.
1.3.4
Laser trapping crystallization
Sugiyama et al. have demonstrated crystallization of glycine by focusing a near-infrared laser beam (wavelength: 1064 nm) at the air/solution interface. It was the first observation of the crystallization only by focused irradiation. They named this method as “laser trapping crystallization”. The initial crystallization was observed by a CCD camera that the glycine crystal grew from focus to a certain size within a few seconds [51]. They also observed that crystal growth of glycine was accelerated by focusing a CW 1064-nm laser beam at a position. The crystal growth rate depended on where the focused laser placed against crystallographic axes [52]. They also reported that crystallization can be achieved in unsaturated glycine solution with this crystallization method [53]. They have investigated the method to control crystal polymorph by tuning laser power. It was found that the
18
competing result between photon pressure and temperature elevation at a certain high laser power led to the probability increase to find -polymorph glycine crystal, which is not available under ambient conditions [54]. Yuyama et al. have demonstrated the formation of a millimeter-scale dense liquid droplet of glycine induced by laser trapping effect [55]. The droplet would form after focusing a CW NIR laser beam at the glass/solution interface of a thin film of its supersaturated heavy water solution. Once the droplet formed, they found that crystallization starts immediately just after the focal position is shifted to the air/solution interface. It is considered that the dense droplet formation is possibly the early stage of the multistep crystallization process [35] and plays an important role in photon pressure-induced crystallization of glycine.
1.4 Motivation
Our purpose of this work is to explore a new laser trapping crystallization method. In this study, we applied femtosecond laser pulses on laser trapping crystallization of glycine. Earlier studies related to the laser trapping by femtosecond pulse imply that femtosecond laser can be utilized as an efficient trapping light source for the crystallization [30]. Therefore we can expect that application of femtosecond laser can bring a new and better optical crystallization methodology.
19
High peak intensity of amplified femtosecond laser usually leads nonlinear multiphoton process and ablation of the water or solvent. To prevent bubble-induced crystallization, we kept the laser energy sufficiently low to prevent the generation of cavitation bubble. Another possibility of the ablation under femtosecond laser pulse trapping, namely an ablation of generated crystal, will be taking into account. We also demonstrate new single crystal formation method by combining fs pulse and CW lasers.
Higher efficiency of laser trapping with fs pulses can be expected to give better temporal controllability. Thus, through single crystal formation method by a combination of fs and CW laser, we can demonstrate spatially and temporally controlled crystallization of glycine. It will be a very powerful method to study crystallization dynamics and mechanism since conventional crystallization methods cannot give high temporal and spatial controllability that we will achieve only fs/CW combined laser trapping crystallization method.
20
2. Experiment
2.1 Materials
Glycine (99.0%, Wako Pure Chemical) in the form of white powder was used without further purification. D2O (>99%, Sigma-Aldrich) as a solvent was filtrated with a syringe
filter (pore size; 0.22 m, SLGV 013 SL, Millipore) before dissolving glycine. Concentration of glycine/D2O solution is 2.40, 2.64, and 3.43 M which supersaturation
values are 0.9, 1.0, and 1.32, respectively. Solute molecules in the solution were ensured to be totally dissolved by heating with a water bath to 60˚C for 24 h and then decreased the temperature of the solution stepwise until it returned to room temperature (~25˚C). Prior to the laser trapping crystallization experiments, solutions were aged for 1 to 7 days to ensure the absence of spontaneous crystallization. Here we used deuterated water as solvents to suppress temperature elevation due to 1064 nm trapping laser absorption.
A home-made closed glass container which was made by gluing (Shin-Etsu Silicone, 1 component RTV) a cut glass vial (Nichiden-Rika glass) on a cover glass (18 × 18 mm) was used as experimental container (fig 2.1(a)). The glass container was sunk in detergent at least for one day, and then washed by purified water repeatedly and cleaned by plasma cleaner before using. After wet and dry cleanings surface of all glass containers became highly hydrophilic. Applied solution to clean and hydrophilic surface spreads and covers
21
whole glass surface stably. A portion of glycine solution (15 L) was poured into a glass container. The D2O of glycine solution can easily spread on the bottom of the glass container
and formed a thin solution layer without touching the glass wall as shown in Fig. 2.2a. The shape of the D2O of glycine solution is convex. The initial solution layer thickness was
about 120 m.
For volume dependence experiment in chapter 3, another home-made glass container (Fig 2.1(b)) which was made by gluing short glass tube and cover glass (24 × 30 mm) was used. Different solution volume can be applied in this container. Before usage of the containers, containers were washed with detergent, acetone and purified water repeatedly. Washed containers were further cleaned by nitrogen plasma treatment (10 minutes with nitrogen gas flow rate of 40 cc/min). After wet and dry cleanings surface of all glass containers became highly hydrophilic. As well as in the other container, glycine solution can easily spread on the bottom of the glass container and formed a concave solution layer with touched the glass wall (Fig. 2.2b). The initial solution layer thickness was about 75, 200, 350, 500 m with 150, 175, 200, 225 L solution volume, respectively.
22
2.2 Property of glycine
Protein is a biological macromolecule composed of 20 common amino acids. Glycine (NH2CH2COOH) is the simplest amino acid with lowest molecular weight and a colorless,
sweet-tasting crystalline solid (Fig. 2.3). It has been frequently studied in the field of crystallography.
Fig. 2.2 Schematic drawing of surface shape: (a) cut glass vial and (b) short glass tube. Fig. 2.1 Pictures of container made of (a) cut glass vial and (b) short glass tube.
23
From small angle X-ray scattering (SAXS) study of glycine supersaturated aqueous solution, it is suggested that zwitterionic form glycine molecules exist as dimers in supersaturated solution [56]. In the supersaturated solution, dimers and water molecules aggregated with each other due to Columbic interactions and hydrogen bonding, form liquid-like cluster. The solubility of glycine in aqueous solutions was determined by means of evaporating and weighing the residue [57]. Table 2.1 shows the solubility of glycine in water and deuterated water. At 20°C, the molar concentration of saturated glycine/D2O
solution is 2.4 M. Solubility of glycine solution with using H2O or D2O as the solvent do not
show obvious difference.
Glycine crystal shows three polymorphs: , and . The - and -forms crystal in the monoclinic system with centrosymmetric space groups P21/n and P21, respectively. -form
crystallizes in the trigonal–hexagonal system with non-centrosymmetric space group P32
Table 2.1 Solubility of glycine in H2O and D2O [2].
Temperature (°C) Glycine weight (g) to 100 g of the solvent
H2O D2O
20 21.85 21.76
30 26.45 26.90
24
[58-61]. The shape difference between - and -polymorph glycine crystals can be clearly distinguished in Fig. 2.4.
Usually, commercially available glycine powder contains mixture of - and - polymorph.
-polymorph is unstable and difficult to exist for a long time, and easily transform to -form.
-polymorph crystal is the most thermodynamically stable among these three polymorphs. But spontaneous crystallization almost gives kinetically stable -polymorph under moderate experimental condition. Crystal of -polymorph is preferentially obtained under relatively hard conditions for crystallization such as using acid, base or using heavy water solution [62]. Comparing to traditional crystallization method, it is difficult to prepare -polymorph crystal just under using heavy water as solvent in laser trapping crystallization. The success Fig. 2.4 Schematic diagram of the morphology of the (a) - and (b) -glycine single crystals [4].
25
of crystallizing -polymorph seems to depend on optical parameters (i.e., power and polarization of laser) in laser trapping crystallization method [54, 63] less determined by the solvent. Ethanol should be used to precipitate -polymorph from a saturated water solution, however a mixture of the - and the -polymorphs are always obtained [59, 61].
The transformations among these three polymorphs are very complicated [59]. Although
-polymorph is quite stable at room temperature, it transforms to -polymorph after several months. The transformation rate is highly dependent on the humidity of environment and higher the humidity transformation rate accelerated. -polymorph refers to transform to - but not -polymorph under high humidity, but it can be preserved well in dried environment.
-polymorph also transforms to -polymorph with heating below 100 C or mechanical shocks such as crush. -polymorph is quite stable at room temperature but it transforms to
-polymorph at 165 C. Reverse transformation does not take place immediately even after
-polymorph is cooled down to room temperature [60].
Glycine is frequently employed in crystallization study.Usage of this well-known simple amino acid will enables to focus studying to understand the mechanism of femtosecond laser-induced crystallization itself.
2.3 Laser mode
26
power output is essentially continuous over time or its output takes the form of pulses of light. CW operation of a laser means that the laser is continuously pumped and continuously emits light with constant frequency. Pulsed operation of a laser means that the emitted light in the form of optical pulses with changeable amplitude.
2.3.1
Continuous wave laser light source
Nd:YVO4 is one of the most efficient laser host crystal currently existing for diode
laser-pumped solid-state lasers. Its large stimulated emission cross-section at lasing wavelength, high and wide absorption coefficient and bandwidth at pump wavelength, high laser induced damage threshold as well as good physical, optical and mechanical properties make Nd:YVO4 an excellent crystal for stable, high power and cost-effective diode pumped
solid-state lasers. Recent developments have shown that Nd:YVO4 can produce powerful
and stable IR, green, blue lasers with the design of Nd:YVO4 and frequency
doubling/tripling crystals. A Nd:YVO4 laser (wavelength: 1064 nm, J20-BL10-106Q,
Spectra Physics, Fig. 2.5) was used as the continuous wave light source in this study. A NIR laser light output from laser head (BL10) was controlled by a computer which was connected to the power supply (J20). The output power of the laser is determined by the current to the laser diode.
27
2.3.2
Femtosecond laser light source
Femtosecond (fs) pulse train generated by a mode-locked Ti:Sapphire laser (wavelength: 700-900 nm, repetition rate: 80 MHz, pulse duration: 150 fs, Tsunami, Spectra Physics, shown in Fig 2.6a) which is pumped by a CW solid-state green laser (wavelength: 532 nm, Millennia Pro, Spectra Physics, shown in fig 2.6b) at about 8 W, was used as fs pulse laser for trapping. A prism sequence and a slit were used for dispersion control and wavelength selection, respectively. A full width at half maximum (FWHM) of the spectrum and central wavelength of the laser light were determined to about 12 nm and 800 nm by a fiber optic spectrometer (USB4000, Ocean Optics).
28
2.4 Microscope setup for imaging of crystallization behavior
Figure 2.7 shows a schematic drawing of optical setup for laser-induced crystallization experiment. Microscope setup is based on an inverted microscope (Olympus, IX71). Temperature and humidity were controlled to be around 23~25˚C and 50~60% by air conditioner, respectively. We use two different laser light source for trapping experiment. One is NIR Ti:Sapphire laser at 800 nm, which can operate both in femtosecond pulse and continuous wave. Another is NIR CW 1064 nm Nd:YVO4 laser (J20-BL10-106Q, Spectra
Physics). Both lasers were introduced into the microscope and focused to the air/solution interface of sample solution through a 60× objective lens (N.A. 0.90). In order to achieve optimal trapping condition, laser beam was expanded and collimated to fully use a back
Fig. 2.6 Picture of (a) mode-locked Ti:sapphire laser, Tsunami and (b) pump laser, MillenniaPro.
29
pupil diameter of microscope objective lens (~8 mm). A 633 nm CW He-Ne laser (LASOS, LGK 7628, ~5 mW) was also introduced into the microscope coaxially with two NIR lasers for checking solution surface height and focus height of NIR laser.
Crystallization behavior around the laser spot was monitored by bright field transmission imaging method by using a halogen lamp as an illumination light source and recorded by CCD camera. Sample solutions were covered to suppress spontaneous evaporation of solution during the laser irradiation.
2.5 Fourier transfer infrared spectra measurement
Fourier transform infrared spectroscopy (FTIR) is a technique which is used to obtain an Fig. 2.7 Optical set up of laser-induced crystallization system.
30
infrared spectrum of absorption and emission of a solid, liquid or gas. An FTIR spectrometer simultaneously collects spectral data in a wide spectral range. This wide spectral measurement is a significant advantage compared to a dispersive spectrometer which measures intensity over a narrow range of wavelengths at a time. After the measurement, computer will process Fourier transform algorithm is used to turn the raw resultant data into the desired spectral data, namely light absorption data for each wavelength.
In this study, Attenuated Total Reflectance-Fourier transform infrared (ATR-FTIR) spectroscopy was used to obtain detailed information of the polymorph of glycine crystal.
ATR is a sampling technique used in conjunction with infrared spectroscopy which enables samples to be examined directly in the solid or liquid state without further preparation.
Figure 2.8 is describing a principle of multiple reflection ATR system. An infrared beam is directed onto an optically dense crystal with a high refractive index at a certain angle through an optical waveguide. In the case of a glycine crystal, it is crushed and pressed to ATR crystal for attaining direct contact. This internal reflectance creates an evanescent wave that extends beyond the surface of the crystal into the sample. The penetration depth into the sample is typically between 0.5 and 2.0 micrometers. Consequently, there must be good contact between the sample and the ATR crystal surface. The evanescent wave will be attenuated in regions of the infrared spectrum where the sample absorbs energy. Transmitted light is then collected by a detector and the system then generates an infrared spectrum.
31
Fig. 2.8 A multiple reflection ATR system. Light undergoes multiple internal reflections in the ATR crystal of high refractive index, shown in yellow. The sample is in contact with the crystal.
32
3. Continuous Wave Laser-Induced Crystallization
To compare CW and fs laser-induced crystallization in the next section, we studied CW laser trapping crystallization under different experimental parameters as for the first step. Laser trapping crystallization with high power laser (0.8~1.4 W) was examined [54, 63], and we found crystallization of glycine was always successful under such high laser power condition. We also examined the crystallization efficiency at low power (0.2~0.6 W) laser trapping crystallization. We found power threshold of laser trapping crystallization on CW laser trapping. We had also checked solution volume dependence of laser trapping crystallization.
3.1 Power dependence of laser trapping crystallization
CW 1064 and 800 nm lasers were used. It should be necessary to check the efficiency of laser trapping crystallization from low to high power range. We define the crystallization probability as follow; experimental observation time is restricted to 30 min. If crystallization is observed within 30 min, then it is counted as successful crystallization. If crystallization is not observed within 30 min, it is counted as failed case.
Heat generation by focused trapping laser cannot be ignored since long time laser irradiation will make the solvent evaporated. Although we tried to reduce the evaporation of
33
solvent by using a closed chamber as a container, solution height still slowly decreased. In this condition, the edge of the solution will possibly be dried and generate the crystal. A 1~2 hour laser irradiation time is not a suitable for spatiotemporally controlled laser trapping crystallization experiment. To avoid such complication, we decide a maximum laser irradiation time to be 30 min.
We examined 1064 nm CW laser trapping crystallization with 200, 400, 600 and 800 mW trapping laser power and focusing to the air/solution interface of saturated solution (S.S. = 1.0) for 30 min. However we can observe crystal generation only with laser power above 600 mW as shown in Fig. 3.1a. CW laser trapping crystallization of 800 nm CW laser with 0.9 SS solution showed similar crystallization power dependency. We need more than 600 Fig. 3.1 Power dependence of laser trapping crystallization with a focused (a) CW 1064 nm and (b) CW 800 nm laser. Laser was focused to the air/solution interface of the glycine solution. Power of 200, 400, 600, and 800 mW CW laser was examined for 1064 nm with 1.0 SS solution; Power of 400 and 600 mW CW laser was examined for 800 nm with 0.9 SS solution. The examined crystallization time is 30 minutes.
34
mW under examined condition as we can see in Fig. 3.1b. As we mentioned in previous section, crystallization can be initiated from high concentration region such as dense liquid droplet. Those results imply that the formation of local high concentration region generation by photon pressure is necessary for laser trapping crystallization, and 200 - 400 mW was not sufficient to induce nucleation of the crystal. Stronger power of laser will induce molecular assembly more efficiently [21]. It implies the local high concentration of solute induced by focused laser is depending on laser power. The growth rate of amino acid aggregates decreased with decreasing the laser power. We also can suggest that 30 min focusing of low power trapping laser is not enough strong to make surrounding of focal spot higher than the critical concentration for nucleation.
Fig. 3.2 Images of glycine crystal generation and growth by CW laser trapping. Saturation degree is 0.9 SS. Laser power is 600 mW.
35
Figure 3.2 shows snapshots of glycine crystal generation and growth at the air/solution interface. After few minutes of CW laser irradiation, the seed crystal was generated at the focal spot and trapped by the focused laser. The resulting crystal from low power laser showed the same crystallization process with the crystal from high power laser.
In spite of lower absorption coefficients of H2O and D2O at 1064 nm, heat effect by laser
irradiation cannot be neglected when the intense laser beam is focused. The temperature elevation by laser irradiation has estimated by applying fluorescence correlation spectroscopy recently. Temperature elevation which is defined as T/P (K/W in unit) at the focal spot is about 22-24 K/W in H2O and 2 K/W in D2O, respectively, with high NA
objective lens (N.A. = 1.35) [64]. It suggests that if we use H2O as a solvent, drastic
temperature elevation increases the solubility of glycine and makes the crystallization more difficult. Therefore we have been using D2O as a solvent of laser trapping crystallization in
order to decrease the thermal effect [51]. We followed these information and used D2O as a
solvent of glycine solution to suppress temperature elevation during laser trapping.
When we use liquid thin film of glycine solution which was formed by dropping a small amount of solution onto the cover glass (solution layer thickness: <100 mm), it showed local surface deformation and height change during laser trapping crystallization process as shown in Fig. 3.3. Height was first lowered and liquid film become thin. After kept very thin condition of this liquid film for a while, surface height was started elevating and eventually
36
crystal formation was observed. The solution height elevation is attributed to the dense liquid droplet formation as reported [55]. In contract to thin solution layer formed on cover glass, surface height/shape of the sample solution in cut glass vial showed no local surface deformation and negligibly slowly height decreasing. Figure 3.4 shows the solution height change during trapping laser focusing to the solution surface. A sample which was not irradiated showed typically less than a few m decrease. Degree of height decreasing showed negligible power dependency in the range of 200~600 mW. All sample showed about 20 m decrease for 30 min irradiation of trapping laser. Laser-induced surface deformation is almost negligible, and crystallization process may not be strongly affected.
Fig. 3.3 Solution height change during 1064 nm CW laser irradiation in cover glass case, laser was focused to the air/solution interface of the thin glycine solution layer formed on the glass substrate. Above curve was obtained with 1.32 SS solution. Laser power is 1.0 W. Asterisk indicates the timing when crystallization occurred.
37
3.2 Volume/Thickness dependence of laser trapping crystallization
Previous studies of laser trapping crystallization suggest that spatial freedom and restriction of molecular transportation will have important effects. Here we have checked solution volume effect on laser trapping crystallization with a focused CW laser at the air/solution interface. Supersaturated solutions (ca. 3.43 M, S.S. = 1.32) and the short glass tube were used as a sample solution and container, respectively.
We found crystallization time depends on the volume as seen in Fig. 3.5. Interestingly, necessary time for crystallization increased linearly in time with increasing of solution volume/thickness. Figure 3.6 shows that solution thickness was not changed during laser Fig. 3.4 Solution height change during 1064 nm CW laser irradiation in cut glass vial case. Laser was focused to the air/solution interface of the glycine solution. Above curve was obtained with 1.0 SS solution. 200, 400, 600 mW laser power was examined. Cut glass vial was used as a container. Asterisk indicates crystallization occurred in 600 mW case.
38
irradiation to the air/solution interface. The local surface height change and deformation were suppressed with a sealed glass tube. Although no surface deformation observed, crystal formation was confirmed.
It implies that solution volume is correlated with mass flow of solute molecules. One key factor for laser trapping crystallization is most probably sufficient supply of molecules to the Fig. 3.6 Solution thickness dependence on crystallization time. Curves were obtained with 1.32 SS solution. Laser power is 1.0 W. Short glass tube was used as a container. Asterisk indicates crystallization occurred.
Fig. 3.5 Solution (a) volume and (b) thickness dependent crystallization time. Curves were obtained with 1.32 SS solution. Laser power is 1.0 W. Short glass tube was used as a container.
39
focal spot by convection flow which induced by heat generation. Observed slowing of crystallization time probably related to slower or less effective convention flow and mass transfer in larger amount of solution which resulted in less effective condensation of the molecules to the focal spot of trapping laser. Local temperature and related mass transfer should be studied for this condition further.
3.3 Summary
We had examined CW laser trapping crystallization to obtain basic information of glycine crystallization under photon pressure by changing experimental parameters. We found power threshold around 600 mW for examined experimental condition. Lower crystallization probability at lower laser power range is attributed to less photon pressure which correct and pinned the molecules to the focal spot of the trapping laser. For laser-induced molecular assembly, 30 minutes irradiation of focused low power laser did not reach the critical concentration for nucleation. These results will be a great help for the comparison between CW and fs laser-induced crystallization in the following sections.
Volume dependence of laser trapping crystallization by focusing the CW laser at the air/solution interface is also examined. Necessary time for crystallization increased with increasing of solution volume. It shows linear increase in time. It implies that solution volume is correlated with local temperature elevation and mass flow of solute molecules in the solution.
![Fig. 1.3 Schematic view of PNIPAM assembly via photon pressure and phase transition [12]](https://thumb-ap.123doks.com/thumbv2/9libinfo/8638166.192992/21.892.208.733.177.495/fig-schematic-pnipam-assembly-photon-pressure-phase-transition.webp)
![Fig. 1.5 Schematic drawing of classical nucleation theory, crystal growth by packing of molecules [34]](https://thumb-ap.123doks.com/thumbv2/9libinfo/8638166.192992/26.892.163.768.908.1031/schematic-drawing-classical-nucleation-theory-crystal-packing-molecules.webp)
![Fig. 1.9 Mechanism of (a) the photochemically induced nucleation of lysozyme, and (b) enhancement of protein crystallization by a photochemical reaction [44]](https://thumb-ap.123doks.com/thumbv2/9libinfo/8638166.192992/30.892.245.787.737.1034/mechanism-photochemically-nucleation-lysozyme-enhancement-crystallization-photochemical-reaction.webp)