養殖土地利用變遷及對地區經濟發展的影響:雲林及宜蘭
地區的比較研究 (II)
研究成果報告(精簡版)
計 畫 類 別 : 個別型 計 畫 編 號 : NSC 95-2415-H-002-032- 執 行 期 間 : 95 年 08 月 01 日至 96 年 10 月 31 日 執 行 單 位 : 國立臺灣大學地理環境資源學系暨研究所 計 畫 主 持 人 : 張康聰 共 同 主 持 人 : 蔡博文 計畫參與人員: 碩士班研究生-兼任助理:賴致瑜、顏士閔 報 告 附 件 : 國際合作計畫研究心得報告 處 理 方 式 : 本計畫可公開查詢中 華 民 國 96 年 10 月 18 日
1. Introduction
Aquaculture, especially shrimp farming, can be a quick and important source of
income and foreign exchange earnings. It can bring social and economic benefits to
coastal areas that, for example, do not have the options of growing agricultural crops.
The Food and Agriculture Organization (FAO) reports that aquaculture is probably
the fastest growing food-producing sector (FAO 2006). But aquaculture can be a
cause for social conflicts by competing with other coastal land uses such as
mangroves, rice paddies, tourism, and preservation of nature (Martinez-Alier 2001;
Lebel et al. 2002; Cheong 2003; Stead 2005). It can also lose its export
competitiveness because of global competition (Tsai et al. 2006). More seriously,
aquaculture has been linked to various regional and local environmental problems
such as conversion of mangroves, salinization of groundwater and agricultural land,
and pollution of coastal waters due to pond effluents (Flaherty and Karnjanakesorn
1995; Dierberg and Kiattisimkul 1996; Tisdell 1999; Senarath and Visvanathan 2001;
FAO et al. 2006).
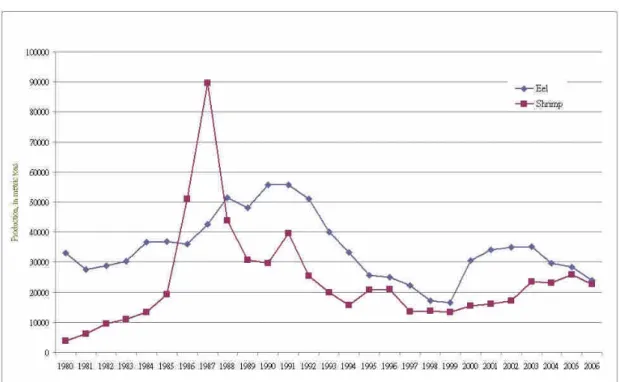
Taiwan’s aquaculture faces economic and environmental threats. Once a lead
exporter, Taiwan has gradually lost its export competitiveness (Traesupap et al. 1999;
Lee et al. 2003; Tsai et al. 2006) for the past two decades. As a result, production of
with acute aquaculture-related environmental problems such as fish diseases, land
subsidence, and flooding (Lin 1989; Chen 1990). As part of a solution to these
environmental problems, government agencies have proposed plans that include
conversion of aquaculture areas into wetlands, ecotourism, and adoption of new and
refined aquaculture technologies (e.g., CEPD 2006). But the reality is that many
aquaculture farmers are struggling to preserve their livelihoods, which have existed
for several generations for some of them. Wetland and ecotourism are therefore not
viable options at least at present. This leaves technology as an option that can
accommodate both government agencies and aquaculture farmers.
Fig. 1. Eel and shrimp production in Taiwan, 1980-2006. Data source: 2006 Taiwan
Previous studies have stated that agents (e.g., aquaculture farmers in this study)
must be willing to accept new technologies before adopting them (Iyer-Raniga and
Treloar 2000; Gordon et al. 2001; Lambin 2005; Stead 2005). However, few
comprehensive studies have been made as to which types of agents are more likely to
accept new technologies. Unless these “willing”agents can be identified, it will be
difficult for planners to target their efforts and to succeed in their promotion of
technology transfer.
Using Taiwan as a case study, this study attempts to find who are more willing to
accept new aquaculture technologies. Because knowledge of local tradition, local
history, and local circumstances is required for successful technology transfer
(Ostrom 1990; Irvine and Kaplan 2001; Armitage 2005), this study also tries to gain a
better understanding of local conditions such as who have abandoned aquaculture in
the past and who are more likely to switch job or land use. We interviewed 224
aquaculture farmers in the field, and used logistic regression to find characteristics of
these farmers that could explain their willingness to accept new technology, their
previous abandonment experience, and their propensity to switch job or land use. It is
hoped that results from this study can help planners of sustainable aquaculture
identify potential adopters of environmentally friendly technologies.
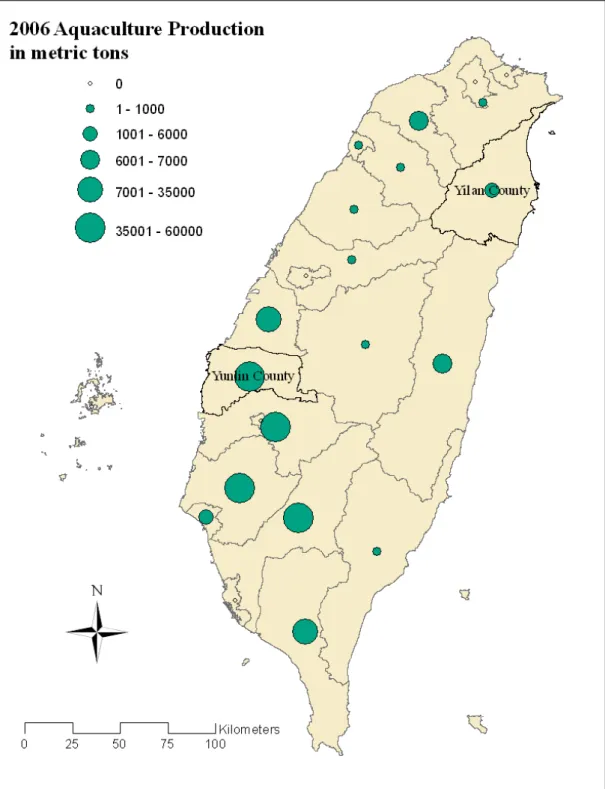
The study area consists of the coastal townships in Yunlin and Ilan Counties (Fig.
2). Four coastal townships in Yunlin are part of Taiwan’s core aquaculture area on the
west coast. Clam has been the dominant species in the north, eel in the south, and
shrimp along the coast in monoculture or polyculture (e.g., with clam) (Richards 1986;
Tsai et al. 2006). In recent years, because of the government’s heavy promotion and
favorable export markets, tilapia has also become a popular species in inland locations.
Located in northeastern Taiwan, Ilan’saquaculturegrew rapidly in the 1970s with eel
exports to Japan, followed by shrimp farming in the 1980s. Ilan has abundant
precipitation and fresh water supply, which was instrumental to the initial expansion
of aquaculture. But the cooler temperature accompanied by the northeast winter
monsoon presents a limiting factor for Ilan’s aquaculture. Shrimp (white, black tiger,
Fig. 2. Aquaculture production by county in Taiwan in 2006. Yunlin and Ilan
Counties, which are included in the study area, are labeled. Data source: 2006 Taiwan
In 2005, the average household income in Yunlin County was 71% of Taiwan’s
average, making Yunlin the second poorest county in Taiwan. Ilan County fared better
at 92% of Taiwan’s average. Ilan is a one-hour drive from the Taipei metropolis, the
largest metropolis in Taiwan with a population of three million. In contrast, Yunlin is
far away from any major city. Overall, Ilan has a more diverse and vigorous economy
than Yunlin.
3. New and Refined Aquaculture Technologies
This section describes new and refined aquaculture technologies that are relevant
to the study area. Eel farmers in Taiwan have known the inland super-intensive
recirculating eel culture system since the 1990s (Shyu 1998). The system consumes
less than 10% fresh water of conventional eel culture and offers antibiotics-free
features. The main hurdle for its adoption has been the high cost. Researchers have
been looking for ways to lower its cost, such as building the system outdoors without
the greenhouse (Shyu and Liao 2004).
Fish diseases continue to be a major problem for shrimp farmers. The reliance of
antibiotics or other drugs to combat diseases has led to drug-resistant bacteria, which,
when contained in the shrimp products with antibiotic residues or discharged with
waste water, can have harmful effects on the consumers or the environment (Shyu and
disease diagnoses and prevention, treatment of pond effluents, and development of
disease free stocks (Liao and Chao 1997).
Inspection of the antibiotic residues in the eel products for export to Japan has
been enforced in Taiwan since the 1990s. Increasingly, domestic consumers are also
willing to pay higher prices for authenticated (safe) shrimp, clam, and other
aquaculture products (Lee et al. 2006). Researchers are now in favor of adopting a
Hazard Analysis Critical Control Point system to provide traceability in the
Taiwanese aquaculture industry (Lee et al. 2006).
Taiwanese researchers have reported that de-hulled soybean meal can effectively
replace fishmeal in diets for tilapia reared in a water re-circulating system without
reduced growth rates (Wu et al. 2003; Lin et al. 2004). Because fishmeal in diets
essentially converts low-cost fish species into a high-value species, soybean meal is
highly favored as a cost efficient and sustainable substitute (FAO 2006; Deutsch et al.
2007).
4. Method
4.1 Questionnaire Survey
Surveys are a common tool for gathering information in social sciences. They
can be used to measure things such as attitudes, beliefs including predictions and
et al. 1996). The design of a questionnaire survey must be guided by previous studies.
Economic studies of technology transfer have shown that farmers are more inclined to
adopt new technologies that can cut production cost, increase profit, and reduce risk
(MacLeod and Taylor 1994; Frank 1995; Ruttan 1996). Characterization studies of
farmers have found that education level, age, available resources, and past experience
tend to influence farmers’behaviors (Rogers 1995; Wadsworth 1995; Moseley 2000;
Solano et al. 2000; Bergevoet et al. 2004). Finally, extension agencies, network
membership, and perceived social pressures may also be important for adoption of
farm technology (Wadsworth 1995; Bergevoet et al. 2004; Lockie 2006; Rehman et al.
2007).
Based on the literature review, the questionnaire for this study included 22 fixed
choice questions. They covered three general categories: (1) background information
on the farmer such as age, education level, farming experience, and size of his
aquaculture operation; (2) risk factors such as fish diseases, land subsidence, typhoon,
water supply, and impact of local industrial plants on aquaculture operations; and (3)
economic aspects of aquaculture farming as well as of external factors such as market
prices and government policies that might influence the farmer’s decision-making.
Two surveys were conducted, one in Yunlin and the other in Ilan. The survey in
method and a target sample size of 100, we derived a number of persons for each
township that was proportional to the size of the aquaculture area within the township.
Aquaculture farmers for the survey were then randomly selected from each township.
In the field, we were able to conduct the survey with 87 of the intended 100 farmers.
The survey in Ilan was conducted in September 2005 and July 2006. Using a target
sample size of 140 and the stratified sampling method, we were able to conduct the
survey with 137 farmers in the field.
4.2 Interview
Informal interviews were conducted with government officials and aquaculture
farmer association officials in Ilan in September 2005 and in Yunlin in September
2006 and March 2007. These interviews were primarily designed to obtain
information on aquaculture technologies.
4.3 Logistic Regression
Logistic regression is useful when the dependent variable is category (e.g.,
presence or absence) and the explanatory (independent) variables are categorical,
numeric, or both (Menard 2002). The logit model from a logistic regression has the
following form:
where the logit of y is the dependent variable, xiis the explanatory variable i, a is a
constant, and biis the regression coefficient i.
The logit of y is the natural logarithm of the odds:
logit (y) = ln(p/(1p))
where p is the probability of the occurrence of y and p/(1 - p) is the odds. To convert
logit (y) back to the probability p, the above equation can be rewritten as:
...) exp( 1 ...) exp( 3 3 2 2 1 1 3 3 2 2 1 1 x b x b x b a x b x b x b a p
A logit model can be evaluated by the receiver operating characteristic (ROC). The
ROC measures the fitness of a model or model accuracy on the basis of true positive
(proportion of incidences correctly reported as positive) and false positive (proportion
of incidences erroneously reported as positive) (Pontius and Batchu 2003). Typically,
a probability value of 0.5 is used to determine whether the model has made a correct
prediction (> 0.5) or not (< 0.5). Additionally, Cox and Snell R2and Nagelkerke R2
measure how well the explanatory variables can predict and explain the dependent
variable. Cox and Snell R2cannot achieve a maximum of 1, whereas Nagelkerke R2
stretches the R2value to range from 0 to 1.
This study ran a series of logistic regression analyses at the general (combining
the samples from Yunlin and Ilan) and local (treating Yunlin and Ilan separately)
switching land use, and willingness to accept new technology. Explanatory variables
came from the farmer’s responses to the questionnaire, which represented his
background data and his views on risk factors and economic conditions. A number of
explanatory variables such as age and the seriousness of fish diseases contained
ordinal data. They were converted to binary data for the analysis. For example,
fish_disease_34 separated farmers, who viewed the fish disease problem to be
moderate or serious, from those, who did not. Two water supply questions were not
used in the analysis because of missing data caused by some farmers using only
brackish water or fresh water.
Logit models were first developed at the general level. Then explanatory
variables selected for the abandonment experience and willingness to accept new
technology models were used to develop the local models. If local differences did not
exist between Yunlin and Ilan, then the local models should be similar to the general
models.
5. Result
5.1 Questionnaire Survey
Appendix 1 itemizes responses to the survey questions from 224 aquaculture
farmers. It shows that 75% have a minimum of 11 years of experience in aquaculture
Compared to the general population in Taiwan, these farmers are older (only 8% are
younger than 40 years old) and less educated (93% have <= 12 years of education).
Almost 60% of those surveyed own the aquaculture farm, but 83% have fishponds
that are smaller than three hectares.
With respect to the risk factors, 87% describe the fish disease problem as either
moderate or serious, 70% complain about serious impacts from nearby industrial
plants, and 59% suffer frequent damages from typhoons.
63% of the surveyed farmers do not have enough income to pay for the
household expenses, 46% do not have enough capital to cover the farming costs, 64%
are willing to switch to a different land use, and 55% are willing to switch to a
different job if given the opportunity. Market price affects 54% of the surveyed
farmers in their decision making and government policies 25%.
5.2 Abandonment Experience
Using the dependent variable that separates farmers who have, or have not,
abandoned aquaculture within the past 10 years, the logit model includes five
explanatory variables that are significant at the 0.1 level: fishpond_size, other_income,
capital, age, and fish_disease (Table 1). The model is significant at 1% level (ROC =
74.5%, Cox & Snell R2= 0.171, Nagelkerke R2= 0.236, n = 224). A farmer is more
income from other sources; has insufficient capital to pay for farming costs; is older in
age (> 50); and considers the problem of fish diseases to be moderate or serious.
[Table 1]
5.3 Switching Job
Using the dependent variable that separates farmers who are, or are not, willing
to switch to other jobs, the logit model includes two explanatory variables that are
significant at the 0.1 level: edu_level, and capital (Table 2). The model is significant
at the 1% level (ROC = 69.4%, Cox & Snell R2= 0.133, Nagelkerke R2= 0.178, n =
224). A farmer is more likely to switch job if he has years of education > 9 and has
insufficient capital for farming costs.
[Table 2]
5.4 Switching Land Use
Using the dependent variable that separates farmers who are, or are not, willing
to switch to different land uses, the logit model includes edu_level as the only
explanatory variable that is significant at the 0.1 level (Table 3). The model is
significant at the 1% level (ROC = 60.4%, Cox & Snell R2= 0.040, Nagelkerke R2=
0.055, n = 224). A farmer is more likely to switch to a different land use if he has
> 9 years of education.
5.5 Willingness to Accept New Technology
The logit model, which separates farmers who are, or are not, willing to accept
new technologies, includes five explanatory variables that are significant at the 0.1
level: fish_disease, abandonment_exp, fishpond_size, edu_level, and other_income
(Table 4). The model is significant at 1% level (ROC = 72.1%, Cox & Snell R2=
0.137, Nagelkerke R2= 0.193, n = 224). The result shows that a farmer is more
willing to accept new technologies if he considers the problem of fish diseases to be
moderate or serious, has not had abandonment experience, has fishpond size > 2 ha,
has > 9 years of education, and has income from other sources.
[Table 4]
5.6 Yunlin Models
Of the five explanatory variables selected for abandonment of aquaculture in the
general model, the Yunlin model includes fishpond_size and other_income that are
significant at the 0.1 level. Two other variables, fish_disease and capital, are close to
the 0.1 level. This local model is significant at the 0.1 level (ROC = 88.8%, Cox &
Snell R2= 0.394, Nagelkerke R2= 0.547, n = 87).
Of the five explanatory variables selected for willingness to accept new
technology in the general model, the Yunlin model includes only abandonment_exp
This local model is significant at the 0.1 level (ROC = 75.0%, Cox & Snell R2= 0.172,
Nagelkerke R2= 0.238, n = 87).
5.7 Ilan Models
The Ilan model for abandonment of aquaculture includes capital that is
significant at the 0.1 level. Two other variables, fishpond_size and other_income, are
close to the 0.1 level. The model is significant at the 0.1 level (ROC = 64.4%, Cox &
Snell R2= 0.071, Nagelkerke R2= 0.098, n = 137).
The Ilan model for willingness to accept new technology includes fish_disease
and fishpond_size that are significant at the 0.1 level. The other three explanatory
variables in the general model all have probabilities close to 0.1. The Ilan model is
significant at the 0.1 level (ROC = 72.4%, Cox & Snell R2= 0.147, Nagelkerke R2=
0.211, n = 137).
6. Discussion
6.1 Abandonment Experience and Willingness to Accept New Technology
Interestingly, abandonment experience is a significant explanatory variable for
willingness to accept new technology. Farmers who have abandoned aquaculture
within the past 10 years are those who have small fishponds, insufficient capital for
farming costs, and no income from other sources. In other words, these are poorer
in the future. They are not willing to accept new technology because they probably
cannot afford the additional cost and are not really committed to aquaculture for
making a living.
Moderate or serious fish disease problem is the only significant explanatory
variable for both the abandonment experience model and the willingness to accept
new technology model. This result is not contradictory as it appears to be. Nearly 90%
of farmers in the survey have experienced moderate or serious fish diseases; therefore,
the fish disease problem becomes a factor for abandoning aquaculture as well as for
being willing to accept new technology. Farmers, who do not have enough income or
capital, are likely to abandon aquaculture when facing the additional fish disease
problem. On the other hand, farmers, who are better-off financially, probably hope
that new technology can reduce or even solve the fish disease problem.
The model for willingness to accept new technology has a significant, positive
relationship with education level. This result is consistent with studies of diffusion of
innovations that suggest that earlier adopters of technologies tend to have more years
of formal education (Rogers 1995; Moseley 2000; Solano et al. 2000; Bergevoet et al.
2004). This study, however, also shows that farmers with a higher level of education
(> 9 years) are more likely to switch to a different job or a different land use.
remain in aquaculture so that they can help promote new or refined technologies for
achieving sustainable aquaculture.
6.2 Local Difference
For willingness to accept new technology, the local model has a ROC value of
75.0% for Yunlin and 72.4% for Ilan, suggesting that farmers in these two counties
have similar views on the technology issue. For abandonment experience, the local
model has a ROC value of 88.8% for Yunlin and 64.4% for Ilan; in other words, the
explanatory variables selected for the general model perform poorly for Ilan. A series
of runs with different combinations of explanatory variables were tried for Ilan, but
none produced a ROC value of greater than 67%. There are two possible reasons for
this poor model performance. First, the questionnaire did not include enough
questions that are relevant to abandonment of aquaculture in Ilan. Second,
abandonment of aquaculture is a more complicated issue in Ilan than Yunlin. Related
to the second possible reason is the close proximity of Ilan to the Taipei metropolis,
which not only creates a more diverse economy but may also create a more unstable
condition for aquaculture, meaning that farmers may have many more different
reasons for abandonment. A more detailed study is needed to better understand
abandonment of aquaculture in Ilan.
This study has identified the type of farmer, who is more willing to accept new
technologies. What is next? Besides having new or refined technologies available for
farmers to adopt, appropriate physical and institutional infrastructure must be in place
to implement a technological change (Berkhout 2002; Tompkins and Adger 2002;
Dietz et al. 2003; Lambin 2005; van der Brugge et al. 2005). For example, if an
outdoor recirculation system becomes feasible, how should it be implemented in
Yunlin? The cost is probably still too high for individual farmers to adopt their own
systems. Should it be run by a farmer association? Or, should it be run by an
extension office? Regardless of what final decision is reached, it should be made with
inputs from all stakeholders for a technological change to be implemented
successfully (Iyer-Raniga and Treloar 2000; Gordon et al. 2001; Stead 2005).
7. Conclusion
New or refined technologies may help solve aquaculture-related environmental
problems. Based on a questionnaire survey, this study has found that farmers, who
have larger fishponds, income from other sources, and higher levels of education but
have not had abandonment experience, are more willing to accept new technologies.
These farmers can serve as earlier adopters of technologies and promoters of
technology transfer. However, some of these farmers with higher levels of education
for technology transfer to succeed, government planners must encourage these more
References
Armitage D (2005) Adaptive capacity and community-based natural resource
management. Environ Manage 35: 703-715.
Bergevoet RHM, Ondersteijn CJM, Saatakmp HW, van Woerkum CMJ, Huirne
RBM (2004) Entrepreneurial behaviour of Dutch dairy farmers under a milk quota
system, goals, objectives, and attitudes. Agr Syst 80: 1-21.
Berkhout F (2002) Technological regimes, path dependency and the environment.
Global Environ Change 12: 1-4.
CEPD (2006) A strategy plan for national land restoration and conservation. Council
for Economic Planning and Development, Taipei, Taiwan. (in Chinese)
Chen LC (1990) Aquaculture in Taiwan. Fishing News Books, Oxford, UK.
Cheong S (2003) Privatizing tendencies, fishing communities and tourism in Korea.
Mar Policy 27: 23-29.
Deutsch L, Gräslund S, Folke C, Troell M, Huitric M, Kautsky N, Lebel L (2007)
Feeding aquaculture growth through globalization: Exploitation of marine ecosystems
for fishmeal. Global Environ Change 17: 238-249.
Dierberg F, Kiattisimkul W (1996) Issues, impacts, nd implications of shrimp
Dietz T, Ostrom E, Stern PC (2003) The struggle to govern the commons. Science
302: 1907-1912.
FAO (2006) State of world aquaculture, 2006. Food and Agriculture Organization,
Rome.
FAO/NACA/UNEP/WB/WWF (2006) International principles for responsible shrimp
farming. Network of Aquaculture Centres in Asia-Pacific (NACA), Bangkok,
Thailand.
Flaherty M, Karnjanakesorn C (1995) Marine shrimp aquaculture and natural resource
degradation in Thailand. Environ Manage 19: 27-37.
Frank BR (1995) Constraints limiting innovation adoption in the north Queensland
beef industry. II, non-adoption is an intelligent response to environmental
circumstances. Agr Syst 47: 323-346.
Gordon J, Vincent D, Haberkorn G, MacGregor C, Stafford-Smith M, Breckwoldt R
(2001) Indicators within a decision framework: social, economic and institutional
indicators for sustainable management of the rangelands. National Land and Water
Resources Audit, Canberra.
Irvine KN, Kaplan S (2001) Coping with change: The small experiment as a strategic
Iyer-Raniga U, Treloar G (2000) A context for participation in sustainable
development. Environ Manage 26: 349-361.
Kongkeo H (1997) Comparison of intensive shrimp farming systems in Indonesia,
Philippines, Taiwan and Thailand. Aquac Res 28: 789-96.
Lambin EF (2005) Conditions for sustainability of human-environment systems,
Information, motivation, and capacity. Global Environ Change 15: 177-180.
Lebel L, Tri NH, Saengnoree A, Pasong S, Buatama U, Thoa LK (2002) Industrial
transformation and shrimp aquaculture in Thailand and Vietnam, Pathways to
ecological, social, and economic sustainability? Ambio 31: 311-323.
Lee W, Chen Y, Lee Y, Liao IC (2003) The competitiveness of the eel aquaculture in
Taiwan, Japan, and China. Aquaculture 221: 115-124.
Lee W, Chen Y, Chen Y, Chu W (2006) Analysis of consumers’willingness to pay
for authenticated aquaculture products. J Taiwan Fish Res 14: 89-100. (in Chinese)
Liao IC, Chao N (1997) Developments in aquaculture biotechnology in Taiwan. J Mar
Biotechnol 5: 16-23.
Lin CK (1989) Prawn culture in Taiwan, What went wrong? World Aquac 20: 19-20.
Lin W, Chen C, Du M, Huang C (2004) Replacement of fish meal with de-hulled
soybean mean in diets on growth of subadult hybrid tilapia Oreochromis niloticus x O.
Ling B, Leung PS, Shang YC (1999) Comparing Asian shrimp farming, The domestic
resource cost approach. Aquaculture 175: 31-48.
Lockie S (2006) Networks of agri-environmental action, temporality, spatiality and
identity in agricultural environments. Sociol Ruralis 46: 22-39.
MacLeod ND, Taylor JA (1994) Perceptions of beef cattle producers and scientists
relating to sustainable land use issues and their implications for technology transfer.
Rangeland J 16: 238-253.
Martinez-Alier J (2001) Ecological conflicts and valuation, mangroves versus shrimps
in the late 1990s. Environ Plann C 19: 713-728.
Menard S (1995) Applied logistic regression analysis. Sage, London.
Moseley MJ (2000) Innovation and rural development: Some lessons from Britain and
Western Europe. Plann Practice Res 15: 95-115.
Ostrom E (1990) Governing the commons: The evolution of institutions for collective
action. Cambridge University Press, Cambridge.
Pontius Jr. RG, Batchu K (2003) Using the relative operating characteristic to
quantify certainty in prediction of location of land cover change in India. Transactions
in GIS 7: 467-484.
Rehman T, McKemey K, Yates CM, Cooke RJ, Garforth CJ, Tranter RB, Park JR,
new technologies on dairy farms in SW England using the theory of reasoned action.
Agr Syst 94: 281-293.
Richards JB (1986) Changing patterns in Taiwan’s aquaculture, 1957-1983. Ph.D.
dissertation, Department of Geography, University of Washington.
Rogers EM (1995) Diffusion of innovation, 4thedition. Free Press, New York.
Ruttan VW (1996) What happened to technology adoption-diffusion research? Sociol
Ruralis 36: 1-76.
Senarath U, Visvanathan C (2001) Environmental issues in brackish water shrimp
aquaculture in Sri Lanka. Environ Manage 27: 335-348.
Shyu CZ (1998) Technological development of a super-intensive recirculating eel
culture system in Taiwan. In: Liao IC, Baker J (eds.) Aquaculture and fisheries
resources management. Taiwan Fisheries Research Institute, Keelung, Taiwan, pp
97-103.
Shyu CZ, Liao IC (2004) Development of sustainable aquaculture in Asia, Challenges
and strategies. J Fish Soc Taiwan 31: 159-172.
Solano C, Bernues A, Rojas F, Joaquin N, Fernandez W, Herrero M (2000)
Relationships between management intensity and structural and social variables in
dairy and dual-purpose systems in Santa Cruz, Bolivia. Agr Syst 65: 159-177.
socio-economic dynamics to aid management, planning and policy. Ocean Coast
Manage 48: 670-692.
Tisdell C (1999) Overview of environmental and sustainability issues in aquaculture.
Aquacult Econ Manage 3: 1-5.
Tompkins E, Adger WN (2002) Institutional networks for inclusive coastal
management in Trinidad and Tobago. Environ Plann A 34: 1095-1111.
Traesupap S, Matsuda Y, Shima H (1999) An economic estimation of Japanese
shrimp supply and demand during the 1990s. Aquacult Econ Manage 3: 215-221.
Tsai B, Chang K, Chang C, Chu C (2006) Analyzing spatial and temporal changes of
aquaculture in Yunlin County, Taiwan. Prof Geogr 58: 161-171.
van der Brugge R, Rotmans J, Loorbach D (2005) The transition in Dutch water
management. Reg Environ Change 5: 164-176.
Wadsworth J (1995) Adoption of innovations by Costa Rican livestock producers
under different levels of extension intensity, predicted versus observed behaviour. Agr
Syst 49: 69-100.
Weisberg HF, Krosnick JA, Bowen BD (1996) An introduction to survey research,
Wu G, Chung Y, Lin W, Chen S, Huang C (2003) Effect of substituting de-hulled or
fermented soybean meal for fish meal in diets on growth of hybrid tilapia
Appendix 1. Questionnaire questions and responses
Questions are in italic, with the variable name in bold in front of each question.
Responses to each question are presented in three sets of parentheses, from left to
right: the total sample, the Yunlin sample, and the Ilan sample.
Category 1:
Abandonment_exp. Have you abandoned aquaculture farming during the past 10 years? Yes, No
(77, 147) (29, 58) (48, 89)
Age. Age? <=39, 40-49, 50-59, >=60
(18, 40, 67, 99) (11, 27, 27, 22) (7, 13, 40, 77)
Edu_level. Education level? Illiterate, <=6 years of education, 6-9, 9-12, >12 (31, 93, 56, 29, 15) (8, 29, 25, 18, 7) (23, 64, 31, 11, 8)
Years_aqua. Years in aquaculture farming? <=5, 6-10, 11-15, 16-20, >20 (22, 33, 41, 28, 100) (3, 24, 29, 8, 23) (19, 9, 12, 20, 77)
Man_power. Other than the harvesting time, can you take care of aquaculture farming by yourself? Yes, No
(176, 48) (72, 15) (104, 33)
Ownership. Land ownership? Sole owner, Joint owner, Renter, A mix of the above
(134, 4, 48, 38) (63, 2, 12, 10) (71, 2, 36, 28)
Findpond_size. Size of fishpond? <=0.9 chia*, 1-1.9 chia, 2-2.9 chia, >=3 chia
(70, 74, 43, 37) (17, 30, 23, 17) (53, 44, 20, 20)
Operation_type. Have you raised, or do you raise, fish in brackish water, or fresh
water, or both? Brackish water, Fresh water, Both
(102, 32, 90) (53, 28, 6) (49, 4, 84)
Fresh_water. Is it easy to get fresh water in your farming area? Easy, Fairly easy, Difficult
(88, 39, 49) (22, 26, 39) (66, 13, 10)
Salt_water. Is it easy to get salt water in your farming area? Easy, Fairly easy, Difficult
(158, 22, 12) (52, 7, 0) (106, 15, 12)
Fish_disease. How serious is the fish disease problem locally? Not serious, Fairly
serious, Serious
(29, 73, 122) (10, 36, 41) (19, 37, 81)
Subsidence. How serious is the land subsidence problem locally? Not serious, Fairly
serious, Serious
(140, 30, 54) (9, 26, 52) (131, 4, 2)
Typhoon. How often has your fishpond been damaged by typhoon? Often,
Occasionally, Never
(133, 67, 24) (40, 39, 8) (93, 28, 16)
Ind_plant. What is the extent of impact that the new Formosa Petrochemical
Corporation has brought to your local environment? No impact, Some impact, Serious
(133, 67, 24) (8, 35, 44) (3, 21, 113)
Category 3:
Household_exp. Is the income from aquaculture farming enough to cover your household expenses? Enough, Usually enough, Not enough
(34, 48, 142) (13, 18, 56) (21, 30, 86)
Capital. Do you have enough capital to pay for the farming costs? Enough, Usually enough, Not enough
(101, 21, 102) (18, 9, 60) (83, 12, 42)
Other_income. Income from other sources? Yes, No
(122, 102) (50, 37) (72, 65)
Switch_lu. Will you consider switching from aquaculture to a more profitable land
use type? Yes, No
(144, 80) (60, 27) (84, 53)
Switch_job. Will you consider switching from aquaculture to a different,
higher-income job? Yes, No
(124, 100) (57, 30) (67, 70)
Accept_NT. Are you willing to experiment with new aquaculture farming technologies? Yes, No
(155, 69) (57, 30) (98, 39)
Market_price. Does the market price influence your decision-making in aquaculture farming? Yes, No
Gov_policy. Does the government policy affect your decision-making in aquaculture
farming? Yes, No
International Geosphere-Biosphere Programme and the International Human Dimensions Programme.
I went to the University of Copenhagen in February 2007 to meet with Prof. Anette Reenberg, chair of the GLP, and Dr. Tobias Langanke, executive director of the GLP. We discussed about the working relationship between the sustainable aquaculture project and the GLP.
GLP – a joint research agenda of IGBP and IHDP
June 2007
Issue No. 2
1
Editorial
Welcome to this second Newsletter of the Global Land Project. After establishing the International Project Office (IPO) in Copenhagen in September 2006 and a meeting of the Scientific Steering Committee (SSC) in Beijing (November 2006), the GLP begins to take shape. In the past months we have focused on networking and planning for activities such as workshops. GLP has no budget to contract and conduct research as such. GLP lives almost exclusively through the efforts and cooperation of individuals and (endorsed) projects that have funding from other sources, but who see a mutual interest in placing their project (or part of it) in the context of the Global Land Project.
We hope to be able to demonstrate the added value and synergies that GLP will provide in return. Workshops and other activities organized by GLP could lead to new cooperation’s and networking
and open new venues for publications. In a more general sense, being part of GLP could enable scientists to place their local or regional studies in a global context. GLP also hopes to initiate a stronger integration between the natural and the social sciences, not only in its synthesis activities, but also among existing and planned projects.
In this second GLP newsletter we provide you with an overview of the emerging GLP network by presenting the projects, activities and networks we have endorsed so far. The 3 nodal offices that GLP has set up in Japan (Sapporo), China (Beijing) and the UK (Aberdeen) will take a lead in initiating GLP activities in the form of workshops and educational activities and will be introduced in more detail in the next newsletter.
Contents of this issue:
Editorial……… 1
GLP news summary………. 2
New Faces……….. 2
IPO networking activities ………. 3
GLP network and database………. 4
IPO: Report back: Sapporo workshop (Feb. 2007)……… 5
NASA LCLUC science team meeting.. 6
NEESPI summit ……… 7
Endorsed Projects – overview……… 8
Endorsed Projects – detailed introduction…………. 9
8
Overview: Endorsed Research Projects and Programmes
The following list of projects reflects a wide ranging interest in contributing to the GLP. These projects, networks, programmes or PhD projects have applied for endorsement status within the last months and after a short review process have been granted GLP endorsement by GLP. This formal recognition of mutual interest in cooperation is a first step in establishing the practical details of a real cooperation. Some of these projects introduce themselves with a short summary of their work below.
• Rationalising Biodiversity Conservation in Dynamic Ecosystems (RUBICODE). Paula Harrison, Environmental Change Institute, Oxford University, UK.
• North American Land Change: Decision Making in Coupled Human-Environment Systems. Steven M. Manson, Department of Geography, University of Minnesota, Minneapolis, USA.
• Fire-Land-Atmosphere Modeling and Evaluation for Southeast Asia (FLAMES). Darla K. Munroe, Department of Geography, Ohio State University, Columbus, USA.
• Sustainable Aquaculture Project. Kang-tsung (Karl) Chang, Department of Geography, National Taiwan University, Taipei, Taiwan.
• The Boston-Area Climate Experiment. Jeffrey Dukes, Department. of Biology, University of Massachusetts, Boston, USA.
• Refining plant functional classifications for earth system modelling. Sandra Lavorel, Colin Prentice, Sandra Diaz, Paul Leadley.
• Sustainable resource use or imminent collapse? Climate, livelihoods and production in the
Southwest Pacific (CLIP). Department of Geography and Geology, University of Copenhagen and the Danish Meteorological
Institute.
• History Database of the Global Environment (HYDE). Kees Klein Goldewijk, Netherlands Environmental Assessment Agency (MNP).
• The southern Yucatan peninsular region (SYPR) project. Landscape Vulnerability-Resilience
in the SYPR. B. L. Turner II, Geography, Clark University.
• Monitoring Land Use/Land Cover Changes and its Envionmental Impacts in Karst Mountain
Ecosystem: a spatial analysis integrating RS, GIS, social survey and climate data. Huang Qiuhao,
Department of Resources, Environment & Geography, Peking University, Beijing, China.
• A Political Ecology of Postsocialist Land Use Change. Johannes Stahl, Institute for Agricultural Economics and Social Sciences, Humboldt University, Berlin, Germany.
• Tools for management and Sustainable Use of Natural vegetation in West Africa (SUN). Anne Mette Lykke, Department. of Systematic Botany, Aarhus University, Denmark.
• ARIDnet (A Research Network for Studies of Global Desertification).
• TERACC (Terrestrial Ecosystem Response to Atmospheric and Climatic Change). • NEESPI (Northern Eurasia Earth Science Partnership Initiative).
12
Sustainable Aquaculture Project
Kang-tsung (Karl) Chang, Department of Geography, National Taiwan University, Taipei, Taiwan.
Taiwan’s aquaculture faces economic and environmental threats. Once a lead exporter, Taiwan has gradually lost its competitiveness due to globaliz-ation since the early 1990s. It is also confronted with acute aquaculture-related environmental problems such as land subsidence and flooding. This project attempts to tackle these challenges and find sustainable alternatives for Taiwan’s aquaculture.
At present, the project is looking at a three-pronged solution: conversion to wetland, adoption of biotechnology, and introduction of ecotourism. Recently, we have used a system of rainfall runoff models, SOBEK, to assess the benefits of conversion of aquaculture area to wetland. We have also analyzed a questionnaire survey of aquaculture farmers to determine the characteristics of farmers who are more likely to accept new technologies.
Taiwan’s experience is not unique; we invite aquaculture researchers from other countries to contact us and to participate in this important project.
http://www.geog.ntu.edu.tw/research/SAP/index.htm
Ilan, Taiwan. Harvesting of white shrimp (Penaeus vannamei). Photograph: Karl Chang.