CHAPTER FOUR FINDINGS
The present study is aimed at investigating the elementary school and junior high school English teachers’ perceptions and implementation of remedial instruction for underachievers. In this chapter, findings from the questionnaires and interviews were presented in eight sections. The first section described the subjects’ background information. From section two to seven, the subjects’ responses to the thirty-two questions in the questionnaire were analyzed and discussed in detail. Since the target population involved teachers from two different teaching contexts, namely elementary schools and junior high schools, the focus of the analysis was on comparing the responses of the two groups of subjects. The last section presented the results from the teacher interviews.
4.1 Background Information
As stated in the previous chapter, the subjects were sampled through stratified
sampling, with which the number of English teachers sampled accounted for 20% of
the total number of English teachers in elementary schools and junior high schools in
Taipei City. As shown in Table 4.1, the number of teachers planned to be sampled in
each district was listed in the “estimated” column, while the number of returned
questionnaires in each district was put down in the “returned” column.
Table 4.1 Numbers of the estimated and returned questionnaires in each district
ESET JHSET
District
Estimated Returned Estimated Returned
Sungshan Dist. (松山區) 8 8 14 14
Hsini Dist. (信義區) 9 9 14 12
Taan Dist. (大安區) 13 13 24 17
Chungshan Dist. (中山區) 9 4 10 7
Chungcheng Dist. (中正區) 7 3 14 10
Tatung Dist. (大同區) 9 3 13 9
Wanhua Dist. (萬華區) 12 2 9 7
Wenshan Dist. (文山區) 21 11 20 20
Nankang Dist. (南港區) 6 3 7 7
Neihu Dist. (內湖區) 11 9 20 16
Shihlin Dist. (士林區) 19 12 20 20
Peitou Dist. (北投區) 17 15 19 8
Total 141 92 184 147
Note: ESET= Elementary school English teachers; JHSET= Junior high school English teachers.
In total, the valid returned questionnaires used for the analysis in the present
study were 239, including 92 elementary school teachers (38.5%) and 147 junior high
school teachers (61.5%), with 13 males (5.4%) and 223 (94.6%) females. In terms of
their educational background, a majority of the teachers (72.8%) were college
graduates, while 26.8% owned a master’s degree and only one teacher (0.4%) had a
doctoral degree. Additionally, most of the teachers were English majors (77.8%). As
for the frequencies of attending relevant workshops on English teaching, 79.6% of the
teachers attended less than five workshops each semester, while 16.2% attended six to
ten workshops per semester. The subjects’ background information was summarized
in Table 4.2.
Table 4.2 Background information of the subjects
Category N %
School level (N=239)
Elementary school 92 38.5
Junior high school 147 61.5
Gender (N=239)
Male 13 5.4
Female 226 94.6
Educational background (N=239)
College graduates 174 72.8
Master’s degree 64 26.8
Doctoral degree 1 0.4
Major (N=239)
English major 186 77.8
Non-English major 53 22.2
Times of attending workshops each semester (N=216)
7Less than 5 times 172 79.6
6~10 times 35 16.2
More than 11 times 9 4.2
In terms of the teacher training programs, years of teaching experience, positions at school, and the numbers of classes and students teaching, the data showed that there are significant differences between the elementary school and junior high school teachers. This difference was due to the English teaching policy. For example, the elementary school English teachers’ training programs sponsored by MOE was offered in company with Grades 1 to 9 English Curriculum. And since the elementary school English courses in Taipei City began from the school year of 1998, the years of teaching experience of elementary school English teachers tend to be less than that of
7
When analyzing the data and computing the frequency and percentage of the responses for each
question, only valid cases would be computed. Subjects who did not answer the specific question or
whose answer to that question was confusing would be treated as “missing.” Therefore, the number of
the subjects responding to each question would not always be the same, thus the total number of the
subjects (N) would vary from question to question.
junior high school teachers. Due to the different nature of the two groups of the
teachers, the subjects’ background information regarding the categories mentioned
above were described separately (Table 4.3). The majority of the elementary school
teachers (78.3%) received elementary school English teachers’ training programs
sponsored by MOE, while junior high school teachers were mostly assigned after
graduation from a teacher training school (56.5%) or after taking teacher education
courses (34.7%). Besides, more than 80% of the elementary school teachers had less
than five years of teaching experience, compared to a majority of 53.3% junior high
school teachers who had been teaching for more than ten years. The teacher’s position
at school was also different between the two groups, with 80.4% elementary school
teachers teaching only English while 73.5% junior high school teachers serving
supervising teachers. The number of classes teaching at the two school levels was also
different. At elementary schools, most teachers (68.1%) were responsible for six to
ten classes, and still 19.8% are teaching more than eleven classes, with each class
comprising less than thirty-five students. The large number of classes that the teachers
teach was because in elementary schools, each class had only two English courses per
week. By comparison, at junior high schools, 95.2% of the teachers were teaching less
than five classes, while the number of students in each class was more than that of at
the elementary school level.
Table 4.3 Background information of the subjects at different school levels Teacher training programs Years of teaching experience
% Teacher training school
Teacher education
courses
MOE’s teacher training programs
Others
Less than 5
years
6~10 years
11~15 years
16~20 years
More than 21
years
School Level N=239 N=225
ES 6.5 12.0 78.3 3.3*** 81.8 12.5 4.5 1.1 0.0***
JHS 56.5 34.7 4.1 4.8 28.5 18.2 18.2 13.9 21.2 Positions at school
Supervising teacher Teaching English and
other subject matters Teaching only English
%
No Yes No Yes No Yes
School Level N=239 N=239 N=239
ES 97.8 2.2*** 88.0 12.0* 19.6 80.4***
JHS 26.5 73.5 95.9 4.1 79.6 20.4
Numbers of classes teaching Numbers of students teaching
% Less than 5
classes 6~10
classes More than
11 classes Less than
30 students 31~35
students More than 36 students
School Level N=236 N=237
ES 12.1 68.1 19.8*** 50.5 48.4 1.1***
JHS 95.2 4.1 0.7 28.1 29.5 42.5
*p<.05, ***p<.001
Note: ES= Elementary school; JHS= Junior high school
4.2 School Policy on English Teaching and Remedial Instruction
From this section to section 4.6 were the detailed analysis of the subjects’
responses to questions number 11 to 42 in the questionnaire, which focused on
exploring the current situation of English teaching at the two school levels, the
teachers’ perceptions and implementation of remedial instruction, the effects of
remedial instruction implemented, and the difficulties and support needed. As
aforementioned, the analysis was displayed mainly as the comparison between the
responses of the elementary school teachers and junior high school teachers. In this
section, questions 11 to 17 were analyzed to understand the school policy on English teaching, including ability grouping and textbook selection, and on remedial instruction, including whether remedial instructions were implemented, types of remedial programs, target students, course contents, and general effects of the programs.
Question 11: Is ability grouping for English courses implemented in your school?
In terms of ability grouping for English courses, only a minority of the subjects’
schools were administering this policy, with 17.4% and 24.5% in elementary schools and junior high schools respectively (Table 4.4). The former placed fifth and sixth graders in streams, while the latter grouped students mainly at the seventh grade (50.0%) and the eighth grade (63.9%).
Table 4.4 Ability grouping for English courses at different school levels
Category N %
Ability grouping for English courses in elementary schools N= 16 (17.4%)
Grade 1 0 0.0
Grade 2 0 0.0
Grade 3 0 0.0
Grade 4 0 0.0
Grade 5 7 43.8
Grade 6 16 100.0
Ability grouping for English courses in junior high schools N= 36 (24.5%)
Grade 7 18 50.0
Grade 8 23 63.9
Grade 9 11 30.6
Question 12: How do the English textbooks selected in your school?
As shown in Table 4.5, the English textbook selection in a majority of the
subjects’ schools was “selecting different sets of textbooks according to students’
grade levels” (73.6%). On the contrary, none of the teachers’ schools used “textbooks selected by individual teachers.” While most schools selected different sets of textbook in accordance with the students’ grade levels, the Chi-square test revealed a significant difference in responses between the teachers in elementary schools and in junior high schools (p=.000). 36.1% of the junior high school teachers used “the same set of textbooks school-wide”, compared to only 6.5% of the teachers in elementary schools.
Table 4.5 English textbook selection at different school levels English textbook selection
% Using the same set of textbooks school-wide
Selecting different sets of textbooks according to students’ grade levels
Selecting different sets of textbooks according to students’ ability groups
Using textbooks selected by individual teachers
Using teacher-made textbooks School Level N=239
ES 6.5 89.1 4.4 0.0 0.0***
JHS 36.1 64.0 0.0 0.0 0.0
Total 24.7 73.6 1.7 0.0 0.0
*** p<.001
Question 13: Is you school implementing or has your school implemented English remedial instruction for underachievers? From which school year?
When asked about the school’s implementation of remedial instruction for underachievers in English learning, the teachers at the two school levels responded differently, and the difference among the two groups achieved the level of significance via the Chi-square test (p=.000). As illustrated in Table 4.6, only 33.0%
of the teachers in elementary schools indicated current implementation of remedial
instruction, and nearly half of the teachers’ schools (48.4%) had never had such
remedial programs, and another 18.7% had the programs before but cease implementing this year. In contrast, a majority of the teachers in junior high schools (84.9%) had school-wide remedial programs right now, among them 53.6% started the program before the school year of 2000. The data showed that there was a widespread implementation of remedial instruction at the junior high school level but not quite so at the elementary school level.
Table 4.6 Current implementation of remedial instruction at different school levels School’s current implementation of
remedial instruction
Academic year of starting remedial instruction
% Yes. Starting from this school year
Yes. Starting from ___
school year to this year
Yes, we had, but not this school year
No, never
Since 1996 and
before
Between 1997 and
2000
Since 2001 and
after
School Level N=236 N=85
ES 17.6 15.4 18.7 48.4*** 0.00 10.3 89.7***
JHS 9.7 75.2 5.5 9.7 17.9 35.7 46.4
*** p<.001
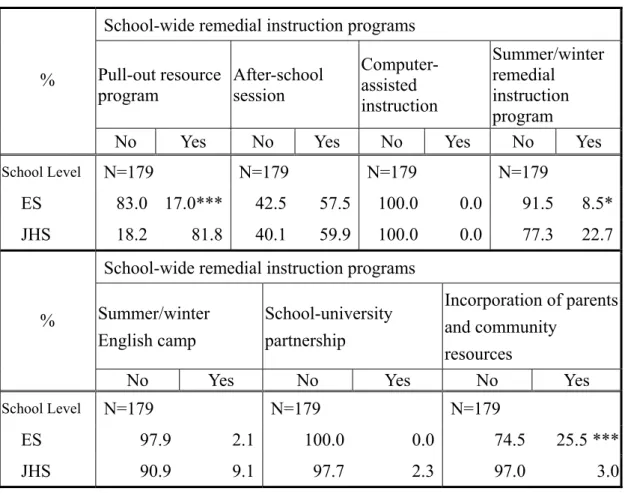
Question 14: What kind of remedial instruction programs is your school implementing or has implemented? (More than one answer can be selected)
Table 4.7 indicated that among the seven given options, the two most commonly adopted programs in elementary schools were “after school session” (57.5%) and
“incorporation of parents and community resources” (25.5%), such as “volunteer parents.” In junior high schools, on the other hand, “pull-out resource program” and
“after-school session” were most frequently implemented, accounting for 81.8% and
59.9% respectively. Further comparison showed that among these common programs,
significant differences existed between the two school levels in terms of their
administration of “pull-out resource program” and “incorporation of parents and
community resources” (p=.000). Contrasting to that of in junior high schools, only 17.0% of the elementary school teachers reported the use of “pull-out resource program.” Besides, unlike that of in elementary schools, a minority of 3.0% junior high school teachers incorporated parents and community resources for remedial programs. Furthermore, though “after school session” was implemented in both school contexts, elementary school teachers mostly conducted remedial instruction during the mornings or lunch breaks, while junior high school teachers made use of the “eighth period” to do so.
Noticeably, though “computer-assisted instruction” (CAI) had been proved to be effective in the literature (Slavin et al., 1989; Tu, 2001) and was featured as individualizing students’ leaning (Huang, 2001), no use of such program was reported in both school contexts. Similarly, the school-university partnership was one of the current trends in remedial education (Chen & Li, 2004; Conderman et al., 1997);
however, only three cases reported (2.3%) in junior high schools and none in
elementary schools.
Table 4.7 Remedial instruction programs implemented at different school levels School-wide remedial instruction programs
Pull-out resource program
After-school session
Computer- assisted instruction
Summer/winter remedial instruction program
%
No Yes No Yes No Yes No Yes
School Level N=179 N=179 N=179 N=179
ES 83.0 17.0*** 42.5 57.5 100.0 0.0 91.5 8.5*
JHS 18.2 81.8 40.1 59.9 100.0 0.0 77.3 22.7
School-wide remedial instruction programs Summer/winter
English camp
School-university partnership
Incorporation of parents and community
resources
%
No Yes No Yes No Yes
School Level N=179 N=179 N=179
ES 97.9 2.1 100.0 0.0 74.5 25.5 ***
JHS 90.9 9.1 97.7 2.3 97.0 3.0
*p<.05, ***p<.001
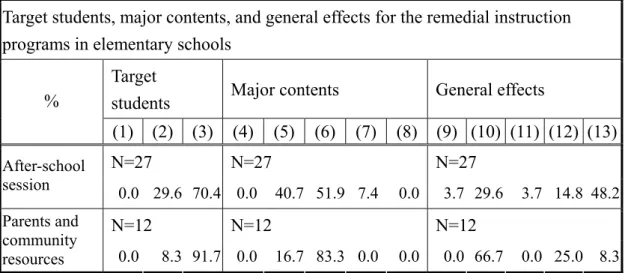
Question 15~17: What are the target students, the major contents, and the general effects for the school- implemented remedial instruction programs?
As illustrated in Table 4.8, the analysis focused on the two most commonly adopted programs in elementary schools, namely “after-school session” and
“incorporation of parents and community resources” in terms of their identification of the target students, major contents and general effects. The target students for the two programs were mainly underachievers only (70.4% and 91.7%), and the contents were mostly “consolidating students’ basic English language skills” (51.9% and 83.3%) and
“reviewing the lessons taught” (40.7% and 16.7%). As for the general effects, a
majority of the teachers (48.2%) whose schools adopting after-school session claimed
that “the effects were not yet evaluated.” The results implied that though the
“after-school session” was widely implemented in elementary school context, its effectiveness remained unclear and the student’s progress was seldom traced systematically. As for the “incorporation of parents and community resources,” 66.7%
of the teachers reported to have acceptable effects, while still 25.0% thought there were only short-term effects. Analyzing from the data, it was encouraging that some of the elementary schools had made efforts to lighten the school teachers’ workload by recruiting volunteer parents for the practice of remedial programs. However, only minor or short-term effects were reported. Generated from the results, it is suggested that careful planning of the program and the provision of parental training sessions were necessary to promote the efficiency of the program. Moreover, the scale of integration of the community resources could be further extended so as to maximize its effectiveness.
Table 4.8 Target students, major contents, and general effects for the remedial instruction programs in elementary schools
Target students, major contents, and general effects for the remedial instruction programs in elementary schools
Target
students Major contents General effects
%
(1) (2) (3) (4) (5) (6) (7) (8) (9) (10) (11) (12) (13)
N=27 N=27 N=27
After-school
session 0.0 29.6 70.4 0.0 40.7 51.9 7.4 0.0 3.7 29.6 3.7 14.8 48.2
N=12 N=12 N=12
Parents and community
resources 0.0 8.3 91.7 0.0 16.7 83.3 0.0 0.0 0.0 66.7 0.0 25.0 8.3
Note: (1) All students are required to attend the class; (2) Students are allowed to take the course
voluntarily; (3) Only underachievers in English learning are required to attend the class; (4) Teaching
new lessons; (5) Reviewing the lessons taught; (6) Taking tests; (7) Consolidating students’ basic
English language skills; (8) Providing individualized instruction; (9) Remarkable effects; (10)
Acceptable effects; (11) Insignificant effects; (12) Only short-term effects; (13) The effects are not yet
evaluated
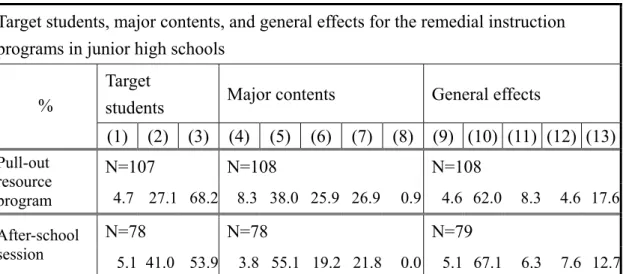
As in Table 4.8 above, Table 4.9 showed the target students, course contents, and general effects of the “pull-out resource program” and “after-school session,” the two most widely adopted remedial programs in junior high schools. Students for the pull-out resource program were mainly underachievers (68.2%), while the after-school session basically opened for either underachievers (53.9%) or any student who is willing to take the course (41.0%). In terms of the major contents for the pull-out resource program, “reviewing the lessons taught” (38.0%), “individualized instruction” (26.9%), and “consolidating students’ basic English language skills”
(25.9%) were all reported. On the other hand, more than half of the teachers (55.1%)
indicated “reviewing the lessons taught” to be the major content for the after-school
session. The analysis of the general effects of these two programs showed that though
a majority of the subjects considered the effects to be acceptable (62.0% and 67.1%),
no significant differences existed among the teachers whose school did and did not
implement the two programs. In other words, there were limited effects of the two
commonly adopted remedial programs in junior high schools in helping the learning
of underachievers.
Table 4.9 Target students, major contents, and general effects for the remedial instruction programs in junior high schools
Target students, major contents, and general effects for the remedial instruction programs in junior high schools
Target
students Major contents General effects
%
(1) (2) (3) (4) (5) (6) (7) (8) (9) (10) (11) (12) (13)
N=107 N=108 N=108
Pull-out resource
program 4.7 27.1 68.2 8.3 38.0 25.9 26.9 0.9 4.6 62.0 8.3 4.6 17.6
N=78 N=78 N=79
After-school
session 5.1 41.0 53.9 3.8 55.1 19.2 21.8 0.0 5.1 67.1 6.3 7.6 12.7 Note: (1) All students are required to attend the class; (2) Students are allowed to take the course voluntarily; (3) Only underachievers in English learning are required to attend the class; (4) Teaching new lessons; (5) Reviewing the lessons taught; (6) Taking tests; (7) Consolidating students’ basic English language skills; (8) Providing individualized instruction; (9) Remarkable effects; (10) Acceptable effects; (11) Insignificant effects; (12) Only short-term effects; (13) The effects are not yet evaluated
4.3 Current Situation of Multilevel Classes and Teachers’ Responses in Dealing with This Problem
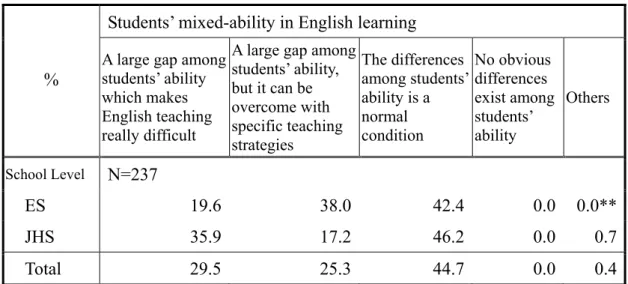
Question 18: How do you perceive the situation of students’ mix-ability in English learning in your classes?
Considering the current situation of multilevel classes in both elementary
schools and junior high schools, as shown in Table 4.10, 44.7% of all the subjects
considered the students’ mixed level to be a normal condition. By comparison, still
more than half of the teachers observed a large gap among students’ English
proficiency, among which 29.5% thought the gap had made English teaching difficult,
and the other 25.3% claimed to be able to overcome this problem with specific
teaching strategies. Further analysis via the Chi-square test revealed a significant
difference between the responses of the subjects in elementary schools and in junior
high schools (p=.001) regarding the problem of students’ mixed ability in English
learning. A higher proportion of junior high school teachers (35.9%) had trouble dealing with mixed-ability classes, compared to 19.6% of the elementary school teachers who had the same problem. Besides, 38.0% of the elementary school teachers claimed to be able to cope with mixed-ability classes with specific teaching strategies, while only 17.2% of the junior high school teachers made such a claim.
The possible explanations for the discrepancy among the two groups of the teachers were further discussed in sections 4.7.1 and 5.1.
Table 4.10 Students’ mixed-ability in English learning at different school levels Students’ mixed-ability in English learning
%
A large gap among students’ ability which makes English teaching really difficult
A large gap among students’ ability, but it can be overcome with specific teaching strategies
The differences among students’
ability is a normal condition
No obvious differences exist among students’
ability
Others
School Level N=237
ES 19.6 38.0 42.4 0.0 0.0**
JHS 35.9 17.2 46.2 0.0 0.7
Total 29.5 25.3 44.7 0.0 0.4
**p<.01
Question 19: How do you deal with students of mixed-ability in English learning in your classes? (At most three answers can be selected)
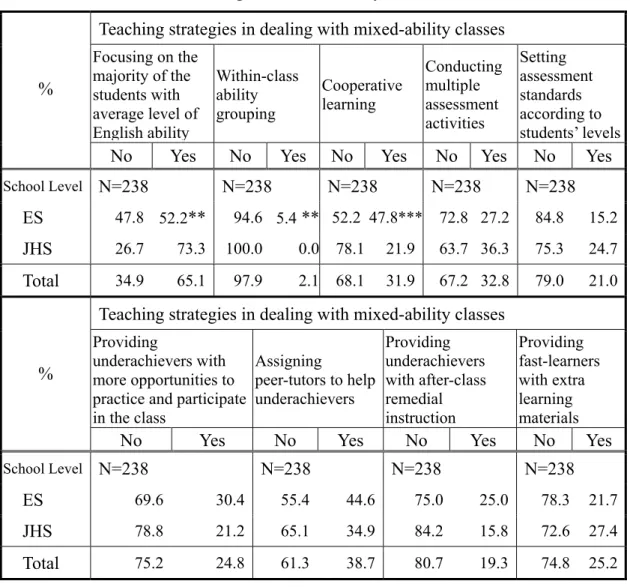
As indicated in Table 4.11, among the eleven given options, five most commonly used strategies reported by the subjects in dealing with mixed-ability classes were “focusing on the majority of the students with average level of English ability” (65.1%), “assigning peer-tutors to help underachievers” (38.7%), “conducting multiple assessment activities” (32.8%), “cooperative learning” (31.9%), and
“providing underachievers with more opportunities to practice and participate in the
class” (24.8%). Further analysis showed that significant differences exited between the teachers in elementary schools and junior high schools regarding their use of
“focusing on the majority of the students with average level of English ability” and
“cooperative learning” (p≤.001) in that the former is adopted more frequently by
junior high school teachers (73.3%) while the latter was found more often in
elementary school contexts (47.8%). It was also found that though the problem of
mixed ability was considered more serious in the junior high school context, as
discussed in question 18, there were still 73.3% of the junior high school teachers
whose teaching were “focusing on the majority of the students with average level of
English ability.” Such results were indeed worth noticing and were discussed in the
next chapter.
Table 4.11 Teaching strategies used by teachers at different school levels in dealing with mixed-ability classes
Teaching strategies in dealing with mixed-ability classes Focusing on the
majority of the students with average level of English ability
Within-class ability grouping
Cooperative learning
Conducting multiple assessment activities
Setting assessment standards according to students’ levels
%
No Yes No Yes No Yes No Yes No Yes
School Level N=238 N=238 N=238 N=238 N=238
ES 47.8 52.2 ** 94.6 5.4 ** 52.2 47.8*** 72.8 27.2 84.8 15.2 JHS 26.7 73.3 100.0 0.0 78.1 21.9 63.7 36.3 75.3 24.7 Total 34.9 65.1 97.9 2.1 68.1 31.9 67.2 32.8 79.0 21.0
Teaching strategies in dealing with mixed-ability classes Providing
underachievers with more opportunities to practice and participate in the class
Assigning
peer-tutors to help underachievers
Providing underachievers with after-class remedial instruction
Providing fast-learners with extra learning materials
%
No Yes No Yes No Yes No Yes
School Level N=238 N=238 N=238 N=238
ES 69.6 30.4 55.4 44.6 75.0 25.0 78.3 21.7
JHS 78.8 21.2 65.1 34.9 84.2 15.8 72.6 27.4
Total 75.2 24.8 61.3 38.7 80.7 19.3 74.8 25.2
**p<.01, ***p<.001
More detailed analysis revealed that there was a discrepancy between the two school levels in terms of the teachers’ use of classroom strategies. As illustrated in Table 4.12, “cooperative learning” played a more crucial role in elementary schools.
In junior high schools, on the other hand, “providing fast-learners with extra learning materials” and “setting different assessment standards for different levels of students”
were not uncommon (Table 4.13). Further discussion on how the teachers
implemented the classroom strategies, including “cooperative learning,” “peer
tutoring,” and “providing underachievers with more opportunities to practice and
participate in the class,” were presented in section 4.7.3.
Table 4.12 The five most frequently adopted strategies by elementary school English teachers in dealing with mixed-ability classes
Elementary school English teachers’ teaching strategies (N=92) N % Focusing on the majority of the students with average level of
English ability
48 52.2
Cooperative learning (heterogeneous grouping) 44 47.8 Assigning peer-tutors to help underachievers 41 44.6 Providing underachievers with more opportunities to practice and
participate in the class
28 30.4
Conducting multiple assessment activities 25 27.2
Table 4.13 The five most frequently adopted strategies by junior high school English teachers in dealing with mixed-ability classes
Junior high school English teachers’ teaching strategies (N=146) N % Focusing on the majority of the students with average level of
English ability
107 73.3
Conducting multiple assessment activities 53 36.3 Assigning peer-tutors to help underachievers 51 34.9 Providing fast-learners with extra learning materials 40 27.4 Setting different assessment standards for different levels of
students
36 24.7
Question 20: What are the general effects of your teaching strategies in improving the situation of mixed-ability in your classes?
As illustrated in Table 4.14, the general effects of the five most frequently
adopted strategies were considered by more than half of the subjects to be minor in
enhancing their teaching of mixed-ability classes. Moreover, the Chi-square test
showed a significant difference between responses of two groups of the teachers—
those who focused their teaching on the majority of the students, and those who
adopted other strategies (p=.023). Compared to those teachers using other strategies, a
higher proportion of the subjects whose teaching focused on the majority of the
students evaluated this strategy to be ineffective (8.7%) or to have only short-term
effects (16.8%) in narrowing the gap among the students’ English language abilities,
and still some of the teachers had not made their evaluation yet (10.7%). The results
implied that the problem of students’ mixed-ability in English learning would not be
efficiently solved if the teacher focused their teaching only on the majority of the
students with average level of English ability. Rather, specific classroom strategies
were necessary to enhance the learning of all students (Hess, 2001).
Table 4.14 General effects of the five most frequently adopted strategies in dealing with mixed-ability classes
General effects of the strategies in dealing with mixed-ability classes
%
Remarkable effects
Minor effects
No effects
Only short-term effects
Effects are not yet evaluated Focus on majority N=232
No 18.1 61.4 1.2 12.0 7.2*
Yes 8.1 55.7 8.7 16.8 10.7
Peer-tutors N=232
No 9.9 57.7 7.0 13.4 12.0
Yes 14.4 57.8 4.4 4.4 5.6
Multiple assessment N=232
No 10.2 59.2 7.0 14.0 9.6
Yes 14.7 54.7 4.0 17.3 9.3
Cooperative learning N=232
No 10.1 57.6 8.2 16.5 7.6
Yes 14.9 58.1 1.4 12.2 13.5
More practice
opportunities N=232
No 12.1 55.5 6.4 16.8 9.2
Yes 10.2 64.4 5.1 10.2 10.2
*p<.05
Question 21: In average, how many underachievers in English learning are in your classes?
The numbers of underachievers reported in elementary school and junior high school contexts was different, as in Table 4.15. 88.8% of the teachers in the former school context reported three to five underachievers in each class, and only 10.1%
found more than six in their classes. On the contrary, 40.3% of the teachers in the latter school context had three to five underachievers in their classes, while 58.2%
found more than six. The discrepancy between the two school contexts achieved the
level of significance (p=.000) in that the numbers of underachievers in junior high
schools tended to be more than that of in elementary school context. Besides, on the margin of the questionnaires, not a few numbers of the subjects also noted their observations that the number of underachievers inclined to increase with the students’
grade levels. The possible reasons accounted for this common reported phenomenon were further revealed with the results of the teacher interviews.
Table 4.15 Numbers of underachievers in English learning at different school levels
Numbers of underachievers in English learning
% Less than 3 students
3 to 5 students
6 to 7 students
8 to 10 students
More than 11 students
School Level N=223
ES 1.1 88.8 6.7 3.4 0.0***
JHS 1.5 40.3 20.1 33.6 4.5
***p<.001
Question 22: What are the major factors do you think that lead to the students’
underachievement?
In terms of the leading factors of the students’ underachievement, as shown in Table 4.16, the two factors identified by most of the elementary school teachers were
“lacking learning motivation” (33.7%) and “having weaker learning ability” (26.1%), while in junior high schools, “lacking learning motivation” (44.5%) and “having almost given up on English learning” (26.7%) were the two main factors. Further comparison found a significant difference between the teachers’ responses at the two school levels (p=.000). Though the factor of students’ “lacking learning motivation”
was reported in both contexts, it was more prominent in leading to junior high school
students’ underachievement. Moreover, there was a much higher proportion of the
junior high school teachers (26.7%) who believed the factor to be “having almost given up on English learning,” compared to only 7.6% of the elementary school teachers with the same response. As for the factors reported in the elementary school context, the proportion of “having weaker learning ability,” “not taking private English courses,” “not getting individual attention from the teacher,” and “lacking parental care and attention” were more common than in the junior high school context.
Inferring from the results, it seemed that the students considered to be underachievers in elementary schools were more because of their weaker learning abilities, less English input, or insufficient attention from the teachers and the parents. However, in junior high schools the situations of students’ lack of motivation and their giving up on English leaning were more serious. For the implications of the findings, further discussions were presented in section 4.7, the results of the teacher interviews.
Table 4.16 Major factors leading to underachievement of students at different school levels
Major factors leading to underachievement of students
% Having weaker learning ability
Lacking learning motivation
Not making good use of learning strategies
Having almost given up on English learning
Not taking private English courses
Not getting individual attention from the teacher
Not using appropriate leaning materials
Lacking parental care and attention
School Level N=238
ES 26.1 33.7 4.3 7.6 7.6 6.5 0.0 14.1***
JHS 10.3 44.5 6.2 26.7 3.4 4.8 1.4 2.7
***p<.001
4.4 Teachers’ Perceptions and Knowledge of Remedial Instruction
Question 23: How do you perceive the importance of remedial instruction for
underachievers in English learning?
Question 24: To what extent are you willing to implement remedial instruction?
Question 25: How much do you understand the implementation of remedial instruction?
Question 26: To what degree do you think you need to enrich the knowledge of remedial instruction?
From questions 23 to 26, the subjects were required to identify their perceptions, willingness, and understanding of the implementation of remedial instruction through a four-point scale
8, with 4 points represented the highest degree and 1 point the lowest.
The higher the degree they perceived, the higher the score they would rate. In sum, the mean scores of the subjects’ responses to these four questions were all above the mean score of the four-point scale (2.5), which indicated, in average, the subjects were positive about these four questions. As indicated in Table 4.17, the teachers showed high agreement to the importance of remedial instruction (M=3.5), with more than 90% of the subjects considered remedial instruction to be either very important or important. When asked their willingness to implement remedial instruction, the subjects’ responses reached a mean score of 3.2, which also showed that nearly 90%
of the teachers were quite willing to help the underachievers with remedial instruction.
As for the understanding about the implementation of remedial instruction, a relatively lower score were achieved (M=2.8), which was just slightly above 2.5, the mean score of the four-point scale. The subjects’ responses to this question implied that the teachers’ knowledge about remedial instruction were in need of improvement.
Such an implication echoed the results for question 26 (M=3.1) in that most teachers
8