國 立 交 通 大 學
經營管理研究所
博 士 論 文
台灣金融控股公司管理績效分析
Managerial Efficiency of Financial Holding Companies
in Taiwan
研 究 生:劉 憲 明
指導教授:楊 千 教授
台灣金融控股公司管理績效分析
Managerial Efficiency of Financial Holding Companies
in Taiwan
研 究 生:劉憲明
Student: Hsian-Ming Liu
指導教授:楊 千
Advisor: Chyan Yang
國 立 交 通 大 學
經 營 管 理 研 究 所
博 士 論 文
A Dissertation
Submitted to Institute of Business and Management College of Management
National Chiao Tung University in Partial Fulfillment of the Requirements
for the Degree of Doctor of Philosophy
in
Business and Management May, 2012
Taipei, Taiwan, Republic of China
台灣金融控股公司管理績效分析
研究生:劉憲明 指導教授:楊千博士
國立交通大學經營管理研究所博士班
摘要 自從一系列的金融改革及開放之後,台灣金融市場中機構數量變得更為的密集且 彼此間的競爭亦更加的激烈。雖然金融的改革與開放有助於台灣金融市場整體效率的 提升,然伴隨而來的卻是國內金融機構面臨一個變動相對快速且高度競爭的市場環境。 而這結構性的改變,促使台灣的金融機構必須進一步檢視其經營上優勢與弱點,期獲 得更多得競爭優勢,維持企業的永續發展。 為了能充分了解台灣金控公司的經營效能及其持續性之競爭優勢,本研究採用二 階段資料包絡模式,評估各家金控公司之管理與生產效能,並進一步探討其內部公司 治理機制,乃至於外部風險因子對其經營績效的影響與關連。在管理績效的分析指出, 金控公司的獲利能力在其經營績效上扮演著關鍵的因素,而規模較小的金控公司因具 有較佳的獲利力,故管理績效與競爭優勢上表現較為優異;另獲利來源的剖析亦指出, 多數金控公司的主要獲利來源雖然來自於原本的主要業務,但跨業整合擴充經濟範疇 的策略,確實能擴充獲利的來源及增加經營的競爭優勢。在公司治理機制的研究指出 股權結構及董事會組成等傳統治理變數對於金控公司的管理績效僅具有限的解釋效果。因此,公司外部的投資者必須藉由其他的輔助性指標,如機構投資人的持股與管 理者的直接持股及股權偏離程度,來監控公司的經營狀況及診斷投資價值被管理損害 的可能性。因此,在公司治理議題的研究上指出金控公司的治理機制及投資者保護仍 需回歸至內部營運資訊的揭露程度及管理階層的利益與公司整體價值的收斂程度來 做判斷,亦即兩者相關程度越高之金控公司,其公司的管理績效表現越佳。另在金控 公司經營風險的分析指出信用風險、市場風險及風險傳遞均會對公司的管理績效有顯 著的影響。而透過這些指標的運用,金控公司的管理階層及投資者,不僅可以瞭解公 司的風險偏好及投資組合的風險來源,並可進一步降低公司的風險程度及提高經營的 績效。 關鍵詞:效率、競爭優勢、網絡資料包絡法、公司治理、風險值、條件風險值
Managerial Efficiency of Financial Holding Companies
in Taiwan
Student: Hsian-Ming Liu
Advisor: Dr. Chyan Yang
Institute of Business and Management
National Chiao Tung University
Abstract
Taiwan’s financial industry remains highly fragmented and competitive after a series of financial liberalization and restructuring. With the enforcement of these fiscal policies, domestic financial institutions face a more dynamic, increasingly intense and highly competitive environment even as the banking industry’s overall efficiency has gradually been enhanced. This structural change has further forced financial institutions to inspect the performance of their strengths and weaknesses and to identify improvement directions so as to gain further competitive advantages.
To provide sufficient details of managerial performance and competitive advantage for financial holding companies (FHCs) in Taiwan, a multiple-factors performance model based on two-stage series model is employed to assess managerial performance and subsequently identify determinant governance mechanisms and risk factors of the FHCs in Taiwan by the truncated regression model.
The results of managerial performance indicate that the a FHC’ s profitability plays a critical role in the overall competitive advantage and small-size FHCs are suitable types in
Taiwan’s current fragmented and overcrowded environment due to achieving better performance in profit efficiency and firm value productivity. In addition, the profit niche of all FHCs comes from their main businesses but other sideline activities also play an important role for FHCs’ overall profit, indicating that the cross-business integration of financial institutions can enlarge their business scope and then can create more benefits and profits for their survival and development.
With respect to the effect of governance mechanisms and risk factors, the results of the former indicated that the conventional governance mechanism has been confirmed as having a limited effect on the FHCs’ performance and the protection of shareholder’s rights. Thus, investors can adopt auxiliary governance variables to supervise the operation of invested firms and to help them to diagnose the probability of managerial expropriation for their investment. The latter reveals that the FHC’s managerial performance is significantly influenced by three factors including credit risk, market risk, and risk spillover. By using these risk measures, the FHCs’ management team and investors can not only conduct evaluation for their risk preferences but they can also diagnose the risk source of their investment portfolio and reduce operation risks to enhance managerial performance. This study provides a sufficient and informative perspective for the firm’s managers and investors to explore the FHCs’ managerial performance by considering competitive capability, governance mechanisms and risk factors.
Keywords: Efficiency; Competitive advantage; Network DEA; Corporate governance;
誌謝 人生如樂章,要有旋律般的高低起伏,才能交織出精彩的故事。進入博士學習生 涯是我生命中新開啟的樂章,四年前我離開安逸的職場,為下一階段職涯規劃預作準 備,這事說起來輕鬆簡單,實踐之後卻是艱難重重。我一頭栽進了學術研究之路,其 中的甘苦,正如一句古諺所說「如人飲水,冷暖自知。」過程中面臨的許多挑戰與考 驗,讓原本平淡的生活增添一段令人無法忘懷的經驗與體會,也為自己的人生增加許 多亮點。 人生因緣而聚合,然因事圓則緣散。四年學習生涯匆匆而過,在獲得博士學位的 同時,滿懷深深的謝意。最要感謝指導教授楊千老師,他的學識智慧及處事典範,開 闊我對事物的見解及學術研究之路,謹致以最深之謝意。這一路走來,要感謝的人實 在太多了,研究指導委員會胡均立老師及曾芳代老師之建議與指正;口試委員楊維楨 老師、諶家蘭老師與許芳銘老師在學位口試時給予我相當有用的見解,提升論文的完 整度;而同門學長姐文民、耿杰、凱喻、翠娟及芳萍不時的鼓勵與適時協助;研究室 學長姐乾臨、秀瑩及新風的照顧與陪伴;最後是同窗好友方冠兄、牟姐、雪娥姐、美 吟的患難相伴,當然還有博士班蕭慧娟小姐在這段期間的熱心幫忙。感謝大夥成為我 人生的一部份,因為你們使得這趟的學習之旅程更加的豐富與精彩。這一段的旅程即 將劃上句點,但由您們身上所學習的學識與智慧,將是我朝下一階段的旅程努力邁進 的能量。 最後,謹將本論文呈獻給我的家人,老媽及岳父母的適時關懷、憲忠及珮渝對家 裡的照顧,讓我無後顧之憂,特別感謝老婆大人孟莛的支持與諒解,一路陪我度過這 段的歷程。因為有你們作為我堅強的後盾,讓我能順利完成學業,感謝你們。 憲明 謹誌 民國 101 年 5 月 台北
Table of Content
摘要 ... i
Abstract ... iii
誌謝 ... v
Table of Content ... vi
List of Tables ... vii
List of Figures ... viii
1. Introduction ... 1
2. Literature Review ... 7
2.1 Banking performance ... 7
2.2 Corporate governance and performance ... 12
2.3 Risk factors and performance ... 16
2.4 Network DEA model ... 20
3. Managerial performance issue ... 24
3.1 Performance model ... 25
3.2 Contemporary performance analysis ... 28
3.3 Further efficiency decomposition ... 31
3.4 Intertemporal productivity analysis ... 35
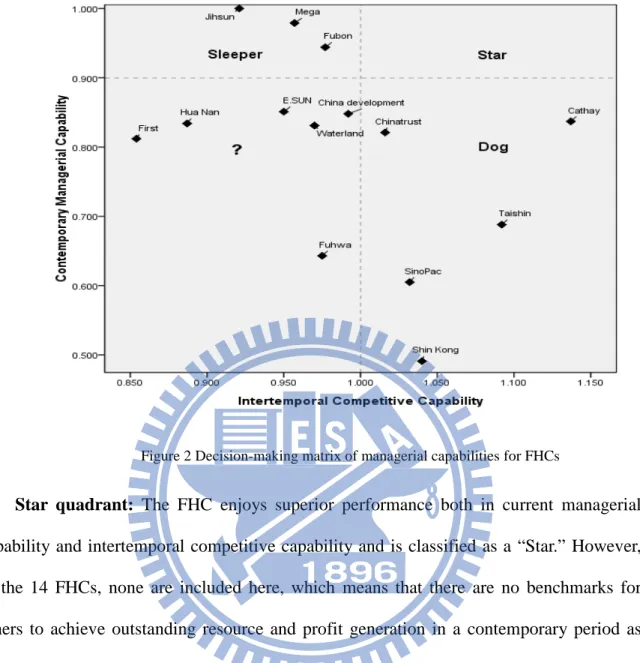
3.5 Decision-making matrix of managerial capabilities ... 39
4. Corporate governance issue ... 42
4.1 Research design ... 44
4.2 Identification of determinant governance mechanisms ... 49
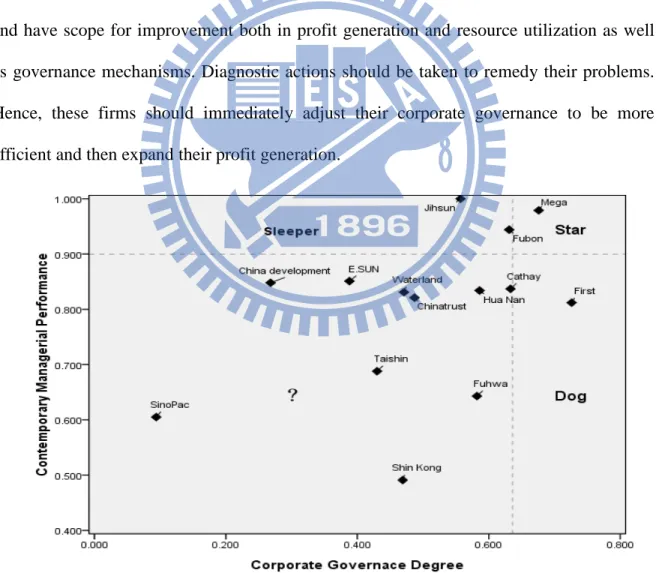
4.3 Decision-making matrix of governance mechanisms ... 54
5. Risk issue ... 58
5.1 Research design ... 59
5.2 Data source and risk estimation ... 60
5.3 Empirical results ... 62
6. Conclusion ... 68
List of Tables
Table 1 Summary of definitions for managerial performance variables ... 27
Table 2 Data description of variables for 14 FHCs’ managerial performance ... 27
Table 3 Contemporary managerial performance for 14 FHCs from 2007 to 2010 ... 29
Table 4 Efficiency decomposition of 14 FHCs... 34
Table 5 Productivity scores and decompositions of 14 FHCs from 2007 to2010 ... 38
Table 6 Summary of definitions for corporate governance variables ... 46
Table 7 Data regarding managerial performance and governance mechanisms ... 48
Table 8 Results of truncated regression for the governance variables ... 53
Table 9 Distribution of governance scores ... 55
Table 10 Risk indicators of 14 FHCs from 2007 to 2010 ... 63
Table 11 ∆CoVaR of 14FHCs conditional on two markets ... 64
List of Figures
Figure 1 Network efficiency model for financial holding companies ... 26 Figure 2 Decision-making matrix of managerial capabilities for FHCs ... 40 Figure 3 Decision-making matrix of the governance mechanism for FHCs ... 57
1. Introduction
Taiwan’s banking industry remains highly fragmented and competitive after a series of financial liberalization and restructuring actions. Starting in the early 1990s, Taiwan’s government embarked on financial reforms to deregulate and restructure the domestic banking industry in order to construct a sound financial system, which is expected to support economic growth and respond to the challenges of powerful competition from international financial groups. Yu (1999) indicated that the financial sector has played a key role in the process of Taiwan’s economic development. To strengthen the efficiency and performance of banking institutions, Taiwan’s financial industry has experienced several important reforms. The first stage in 1991 relaxed the entrance barriers to the financial market when Taiwan’s government announced the Commercial Bank Establishment Promotion Decree. This legislature helped to deregulate barriers and invite private domestic enterprises and foreign investors to participate in domestic banking. Soon afterwards, 27 new commercial banks and mixed ownership banks were set up, and more funds have been attracted into the loanable funds supply market, along with an improvement in banking operation efficiency.
Financial deregulation has also brought about some unsatisfactory effects. An excessive amount of banks make up Taiwan’s banking industry with fierce competition among them leading to several financial crises such as abnormal peaks in the banks’ non-performing loans (NPL) ratio, credit losses, and an inferior capital adequacy ratio. In the second stage, in order to overcome these financial obstacles to sustain industrial competitive advantages, the government decided to embark on various reforms and restructuring programs, referred to as the first financial restructuring (FFR), to reduce bad
debt banking, encourage mergers and acquisitions among banks, and to push for the set-up of financial holding companies (FHCs). Through these polices, Taiwan’s government has successfully controlled banks’ operation costs and risks, seen the sector’s average NPL ratio fall under 5%, the capital adequacy ratio rise above 8%, and approved mergers among some financial institutions as financial holding companies to cope with the problem of over-competition in the overcrowded market.
The third stage involved the second financial restructuring (SFR) in 2004, which continued the reform of the FFR to improve upon the defining characteristics of “too many in number and too small in size” in Taiwan as compared to other Asian countries (Lo and Lu, 2009). The main goals of this stage are to achieve the emergence of one or two particularly large and strong regional financial institutions with a market share of at least 10% each in Taiwan, a reduction of government ownership in financial institutions, and a drop in the number of banking institutions. Although the number of banks in Taiwan fell from 50 in 2004 to 44 at the end of 2006, the goals of the SFR have not been completely achieved and the banking industry still remains highly fragmented and competitive.
With the enforcement of financial liberalization and restructuring, the overall efficiency and competitiveness of Taiwan’s financial industry have gradually improved and several main financial holding companies have gained a greater market share. However, they now face a more dynamic, increasingly intense and highly competitive environment. Such an environment forces these institutions to develop their capabilities to gain and maintain competitive advantages. Hill and Jones (2004) indicated that a firm’s competitive advantages come from both the resources it has and the capabilities to use them. Thus, financial institutions have to identify the inefficient costs of acquiring funds and the efficient functions of generating profits to enhance their competitive advantages in
responding to external changes, which increases their survival.
Some earlier studies (Giokas, 2008; Pastor et al., 2006; Schaffnit et al., 1997) have indicated that the efficiency enhancement of a financial institution mainly depends on if it can identify the inefficiency source and profit niche for improving its competitive advantages. To confront the dynamic financial domestic market and improve their own performances, financial institutions need to define their competitive advantages and relevant capabilities by using the most effective method and sequentially maintain and improve its competitive advantage to ensure their survival and ultimate prosperity in the Taiwan financial market.
Efficiency has been an important topic in banking research for a long time, with data envelopment analysis (DEA) as one of the methods used to evaluate the efficiency of banks and financial institutions. Major academic journals have published special issues on banking efficiency using the DEA method, including the European Journal of Operational Research in 1997 and the journal of Management Science in 1999. Most previous studies evaluate profitability efficiency of a financial institution according to its operation activities using the production approach (Athanassopoulos and Giokas, 2000; Ferrier and Lovell, 1990; Sherman and Gold, 1985), whereby an operation activity is depicted as the production of services using input resources and expenses to produce desired outputs (i.e. deposits and non-interest incomes) or using the intermediation approach (Athanassopoulos and Giokas, 2000; Casu and Molyneux, 2003), and they describe the operation activity as a process of transforming deposit costs into income from loans and investments. In light of the efficiency evaluation, the former places emphasis on how to acquire outputs by using minimum resources, while the latter focuses on generating maximum income by using the available resources. However, performance improvement and competitiveness enhancement
cannot rely on either production or intermediation activities alone. These two types of operational activities occur simultaneously and both are crucial for improving the competitive capabilities of a bank and should not be separately evaluated. Thus, a more accurate way for identifying the profitability performance of a financial institution is to consider the complementary production and intermediation activities under the performance evaluation of financial institutions. In addition to profitability activities, the marketability activity also plays a crucial part and should be included in the performance model (Chakravarthy, 1986; Siford and Zhu, 1999; Zhu, 2000; Lo and Lu, 2009). This is particularly true for published and listed companies because their values are ultimately determined by the stock market. The marketability performance represents the ability that a financial institution can transform operating revenues and profits into the earnings of shareholders and market value in the stock market. Moreover, a firm with superior marketability can attract more capital and investments from the financial market. This is because the operating resources for the profitability performance represent a firm’s profitability and marketability activities. A high dependence in a firm’s value-creating process should be integrated together in performance evaluation. Therefore, this study adopts a two-stage series framework to include two types in the profitability and marketability activities for evaluating their contemporary managerial efficiency and sustained competitive advantage. In addition, in the wake of shock of the Asian Financial Crisis, the collapse of Lehman Brothers, the subsequent financial crisis and the subprime lending fiasco, the mechanisms of corporate governance and risk control have become major issues in the operation of financial institutions. Regarding corporate governance, although the previous studies have indicated that a firm with superior governance mechanisms result in better performance, Claessens and Fan (2002) also indicated that
limited investor protection of minority rights in Asia might allow controlling shareholders to expropriate minority shareholders and conventional governance mechanisms may have a limited effect to reduce agency problems. Therefore, this study first examines whether conventional governance mechanisms still have a significant effect on Taiwan financial institutions. Moreover, the auxiliary variables based on the perceptive of investor self-protection also are included to identify the determinant governance mechanisms and their effects for Taiwan financial holding companies. With respect to the effect of risk factors in financial institutions, the Basel Committee divided it into three parts including credit risk, operating risk and market risk and extant studies indicated that that the efficiency of financial institutions is significant influenced by risk factors (Berger and DeYoung, 1997; Ataullah et al., 2004; Chang and Chiu, 2006). However, owing to the phenomenon of being too interconnected into the global financial market, Taiwan’s financial market has been highly integrated with international markets and is also easily impacted by a specific financial distress which occurred in some international markets. Therefore, for considering the impact of risk factors, this study not only employs credit and market risks to explore their effect on the managerial performance of Taiwan financial institutions, but it also includes the measure of CoVaR to understand the effect of the risk spillover of other financial markets on Taiwan’s financial market and institutions.
The main purposes of this study are to provide sufficient details of managerial performance and competitive advantage for Taiwan financial holding companies and to further explore the relation among the FHC’s managerial performance, governance mechanisms and risk factors. Owing to the complexity of the value-creating process, a multiple-factors performance model based on Seiford and Zhu’s (1999) findings to assess managerial performance and efficiency productivity. Moreover, these efficiency scores are
subsequently employed to identify determinant governance mechanisms and risk factors using the truncated regression model. Finally, the decision-making matrices constructed by the managerial performance and intertemporal productivity as well as the governance mechanism are expected to provide further managerial tools for Taiwan’s financial holding companies.
2. Literature Review 2.1 Banking performance
The evaluation of a financial institution’s performance is a difficult task due to the scarce availability of operations data, diverse operating sizes, offerings of multiple products, and provision of complex service content to various customers. However, such a performance evaluation can be accomplished on the basis of a financial ratio or operation research technology using available financial or accounting data. In the literature, there are several methods used to measure a financial institution’s performance, such as financial ratio analysis, regression analysis, and frontier efficiency analysis (Berger et al., 1993; Paradi et al., 2011b). A financial ratio analysis is employed for assessing the performance of financial institutions primarily based on the use of accounting data. By conducting single input and output analysis, financial ratio analysis provides the management team not only with indicators to monitor operation conditions and financial performance, but also further information to make better managerial decisions. Regression analysis is an alternative method to measure a financial institution’s performance using the central trend method to identify the interaction between input and output variables. If a satisfactory regression model is found, it can assist a financial institution’s management in identifying the determinants of the production or cost function. The management can also use it to estimate the performance gap between the actual and expected values and then translate the values into a ratio of an actual value to an expected value for identifying relative efficiency.
Although effective in many business areas, financial ratio analysis and regression analysis have many inherent limitations making them unsuitable for the evaluation of financial institutions’ performance. For example, financial ratio analysis takes into account only single inputs and outputs in each evaluation, leaving out of the analysis situations with
multiple inputs and outputs (MIMO). Moreover, it is difficult to provide a useful aggregated performance score for comparative purposes. Each financial ratio has its specific function in diagnosing different aspects of a financial institution’s operation, and simply subjectively aggregating these ratios together may result in a misleading indicator of overall performance and provide little contribution for identification of benchmarking policies. As for the limitations of regression analysis, this method is suitable only for the evaluation model with a single dependent variable (input or output) and cannot be used to deal with analytical situations with MIMO systems. Second, regression analysis is a parametric method that requires specifying a particular function from between the dependent and explanatory variables and the residuals of the evaluation model should follow the assumptions of normal distribution. Third, owing to the use of the central trend technique in regression analysis, the estimates using this method is a mean relationship providing less information to directly identify each institution’s performance.
A recent alternative method for measuring the performance of financial institutions that surpasses the application of traditional methods is the frontier efficiency method, which estimates how well a financial institution performs relative to the frontier formed by the best institutions under the same operational conditions. The major advantage of this method is that it removes the effects of price differences in analytical variables as well as other external market factors and provides the institution’s management a determined quantitative tool to identify best practices in a complex operational environment (Bauer et al., 1998). The methodology for frontier efficiency can be divided into parametric and non-parametric methods, including the Data Envelopment Analysis (DEA), the Stochastic Frontier Approach (SFA), the Free Disposal Hull (FDH), the Thick Frontier Approach (TFA), and a Distribution Free Approach (DFA). The primary differences among these
approaches are the restrictions imposed on the specification of the best practice frontier, the assumptions of random errors and inefficiencies, and the existence of random errors (Bauer et al., 1998; Paradi et al., 2011a). Compared to other approaches, DEA is a non-parametric approach which is recognized as being a better and more robust efficiency analysis tool since it uses actual data from evaluated units to construct the efficiency frontier without setting up a specific functional form, which reduces the possibility of a bias measure of efficiency due to specification errors. In addition, it permits efficiency to change over time and allows for the existence of random errors. It also has the capability of dealing with the analysis of MIMO systems without requiring an explicit specification of the relationship between input and output variables (Berger and Humphrey, 1997).
Ever since the development of DEA technology, numerous studies have applied this approach and its extended models to analyze the efficiency of banking and financial institutions. A survey of DEA applications in financial institutions and the banking industry can be found in studies by Berger and Humphrey (1997) and Fethi and Pasiouras (2010). However, apart from using diverse DEA models for exploring the performance of banking industries around the world, another ongoing discussion in the banking literature is how to select appropriate inputs and outputs for conducting the evaluation of a bank or branch performance. By considering different dimensions of banking performance, Berger and Humphrey (1997) indicated that two main approaches are widely applied in evaluating the efficiency of banking profitability: the production approach and the intermediation approach. The former assumes that banking or financial institutions are a production unit that produces variables related to transaction services as outputs based on the use of capital and labour expenses as inputs (Sherman and Gold, 1985; Ferrier and Lovell, 1990), while the latter regards financial institutions as the entity between savers and investors,
transforming deposit costs into income from loans and investments (Miller and Noulas, 1996; Haslem et al., 1999). Fethi and Pasiouras (2010) in their recent survey identified that 30 studies use DEA-like techniques to estimate branch level efficiency, in which 16 adopt the production approach, 10 adopt the intermediation approach, and only four concurrently use both approaches. This review also discovers that most previous studies have focused on a single performance dimension and only a few have tried to evaluate branch performance from different dimensions. However, in evaluating two types of activities for banks, banks as financial transaction providers or financial intermediaries, they occur simultaneously and should not be evaluated separately. Berger and Humphrey (1997) presented that neither the production approach nor the intermediation approach can fully capture the overall activities in a financial institution. Although some studies (Fethi and Pasiouras, 2010) try to assess a bank’s profitability performance from different perspectives using production, intermediation, or even other extended approaches in their evaluation framework, they still assume that these activities are independent and estimate a small portion of their performance separately from each perspective. Hence, for performance evaluation robustness, the major activities within a financial institution should be integrated on one side rather than as an individual activity in evaluating banking profitability performance.
In addition to profitability efficiency, the marketability performance also plays a crucial part and should be included in the performance model, especially for published and listed companies because their values are ultimately determined by the stock market. For the marketability performance of a financial institution, it represents the ability that a firm can transform operating revenues and profits into the earnings of each shareholder and market value in the stock market. Moreover, a firm with superior marketability can also attract more capital and investments from the financial market as operating resources for
profitability performance. Therefore, a firm’s profitability and marketability performance are highly dependent on a firm’s value-creating process and should be integrated in the performance evaluation.
In response to the complexity of a firm’s value-creating process that cannot be measured by just a single criterion, a number of studies have used a multi-factor performance model to evaluate firm performance (Chakravarthy, 1986; Siford and Zhu, 1999; Zhu, 2000; Lo and Lu, 2009). Seiford and Zhu (1999) initially proposed a two-stage production process using the DEA technique to measure the efficiency of the top 55 U.S. commercial banks. Zhu (2000) employed the same framework proposing a multi-factor performance measure model to examine the performance of Fortune 500 companies, and Lo and Lu (2009) employed a framework to evaluate the performance of financial holding companies in Taiwan. This study adopts the same model as the performance framework to evaluate Taiwan financial holding companies. Moreover, in order to understand the competitive advantage of a financial holding company, this study further decomposes a firm’s overall profit into those of its financial subsidiaries as the intermediary variables to connect profitability and marketability efficiency. By using this performance model and efficiency decomposition technique, all financial holding companies can be evaluated to identify the specific inefficiency source and profit niche and then enable the firm’s management to assess their competitive capability to take remedial actions.
2.2 Corporate governance and performance
In the wake of widespread corporate distress at Enron, WorldCom, Adelphia, and other industry giants, corporate governance has become a major issue in contemporary management theories and practices. We deal with the ways in which shareholders can assure themselves of making a return on their investment and provide further exploration of the relationship between corporate and shareholder value and governance mechanisms related to agency problems. Extant studies on corporate governance show that the phenomenon of ultimate corporate ownership is extensive in the listed companies of most countries (La Porta et al., 1999; Claessens et al., 2000), and controlling ownership may do harm to shareholder value depending on whether they have enough incentives to expand their intentions to expropriate outside investors. Shleifer and Vishny (1997) showed that controlling shareholders prefer to exploit firm resources to generate private interest without sharing with minority shareholders when they fully control the corporation. La Porta et al. (1999) also indicated that controlling shareholders typically direct the firm through pyramidal structures and may have more power and incentives to seek out private interests at the expense of minority shareholders.
Compared to the uncertainties of managerial expropriations when outside investors finance a corporation, the return on their investment is limited and may never reap returns from the invested firms (Shleifer and Vishny, 1997). Specifically, outside investors do not receive any promise of return for their investment and do not have any claims to the firm’s assets or rights to the firm’s collateral. Moreover, they do not even possess any information or financial data when the firm is liquidated. Therefore, the protection mechanism for investors and shareholders is crucial.
financial markets, and corporate governance. La Porta et al. (2000) discussed the difference between legal investor protection and the effectiveness of law enforcement to corporate governance among countries, indicating that investor protection matters in the ownership of firms and the development of financial markets. La Porta et al. (2002) examined a large sample of firms from 27 wealthy economies to test the effect of legal protection for investors on the valuation of firms, providing evidence that firms in countries with better legal protection for shareholders as well as investors would have higher valuations. Although the consequences of legal shareholder protection for firm valuation and financial development have been well discussed, the issue of investor self-protection has received less attention.
La Porta et al. (2002) indicated that outside investors could take corporate governance as a set of mechanisms that protect themselves against expropriation by the controlling shareholders and managers. Gompers et al. (2003) suggested that minority investors could use corporate governance mechanisms, such as monitoring directors and officers, as protection against managerial expropriation. Previous research studies focusing on firm-level governance mechanisms tried to predict determinant governance mechanisms, indicating that board size (Bonn, 2004), CEO duality (Boyd, 1995), outside directors (Cho and Kim, 2007), blockholders (Sánchez-Ballesta and García-Meca, 2007), independent directors (Liu and Yang, 2008), and supervisory directors (Huang, 2010) could provide better explanatory power for firm performance and thus enhance shareholder value. However, a survey of corporate governance conducted by Claessens and Fan (2002) indicates that limited investor protection of minority rights in Asia might allow controlling shareholders to expropriate minority shareholders and conventional governance mechanisms have a limited effect to reduce agency problems. Shleifer and Vishny (1986)
reported that minority shareholders might be able to confront the risks of managerial expropriation by exerting direct monitoring. Claessens and Fan (2002) presented that alternative corporate governance mechanisms might be employed to mitigate the expropriation of minority rights and have better predictability for firm performance. Thus, based on the perspective of considering the investor monitoring and corporate governance mechanism, governance variables related to financial supervisory of a firm’s management as well as separation of ownership and control are employed, including institutional shareholding, firm leverage, board pledge, excess shareholding of controlling owners, divergence of voting rights to cash-flow rights, and control-affiliated directors and supervisors are regarded as alternative governance mechanisms to be appended with conventional governance mechanisms trying to explore their influence on minority shareholder value and further supervise managerial expropriation.
Regarding the evaluation of a firm’s value, Rappaport (1997) indicated that value assigned by shareholders might differ from those of a firm or management in some situations. The measurement of a firm’s value not only focuses on a firm’s actual performance, but one should also consider the expected value of investors. Shleifer and Vishny (1997) indicated that the investors’ objective of parting with their money to invested companies without controlling rights is to increase their wealth stock in the future, including market value, dividends, and capital appreciation. Therefore, a firm’s value, usually measured by the proxy variables of Tobin Q, might not fully represent the value of outside investors and shareholders. In addition, although the literature on corporate governance generally adopts a single indicator (Tobin’s Q) as the measure of firm value, Zhu (2000) indicated that a firm’s value-creating process is a complex phenomenon requiring more than a single measure and a multi-factor performance measurement model
to capture it. In response, this study uses multiple indicators related to a firm’s profitability and marketability as proxy variables and the DEA model to measure the managerial and operating performance.
2.3 Risk factors and performance
Taiwan’s financial industry became highly fragmented and competitive after a series of financial liberalization and restructuring. This evolution not only encourages financial institutions to operate more efficiently, but it also exposes their operations with a higher risk level. Hence, it is important to evaluate the relationship between managerial performance and risk factors related to the efficiency of financial institutions.
Regarding the calculation of risk factors related to banking efficiency, the Basle Committee in 2001 divided it into three parts including credit risk, operating risk and market risk. Hence, two major research avenues are used to explore the impact of risk factors on the performance of financial institutions. One adopts the indicators related to credit and operating risks as an internal effect to calculate the risk impact, while the other considers the factors related to risk volatility of the external market as a market risk to analyze their impact on the efficiency of financial institutions. For the effect of credit risk, most extant research in the literature usually adopt nonperforming loans, capital adequacy ratio and allowance for loan losses as proxy indicators and then applied the two-stage approach to explore the impact of credit risk on the efficiency of financial institutions. The results indicated that efficiency scores are significantly influenced by internal risk factors. (Cebenoyan et al., 1993; Berger and DeYoung, 1997; Ataullah et al., 2004).
With respect to the measure of market risk, the most common indicator used by financial institutions is Value-at-Risk (VaR), which is defined as a threshold value with a maximum dollar loss (within the p% confidence interval) over a given time horizon (Jorion, 2006). VaR is widely used to evaluate the loss risk of specific assets or portfolio and converts the downside risk of an asset or portfolio into a single number, which can be regarded as an efficient measure to manage the exposure of risk assets held by financial
institutions. Regarding the calculation of VaR, there are several methods which are applied to estimate the value at risk in the literature including simple moving average, the exponentially weighted moving average, historical simulation, the Monte Carlo simulation and the extreme value theory (Jorion, 2006). Because these approaches are widely used in the financial field to determine the market value for a specific portfolio or institution (Beder, 1995; Hendtricks, 1996), Chang and Chiu (2006) adopt value at risk calculated from historical simulation as a measure of market risk combined with bank efficiency obtained from the DEA model to explore the relationship between banking efficiency and market risk in the Taiwan banking industry. The results indicated that the risk factors have significant impact on bank efficiency. That is, banks with a higher level of market value lead to lower managerial efficiency in the Taiwan banking industry.
Due to financial liberalization, the Taiwan capital market and financial instruments such as futures, options and other derivatives have greatly increased over the past few decades. This empowered the Taiwan financial market to be highly integrated with the international markets which form an interconnected financial system. Therefore, the evaluations of market risk and risk transmission between the different financial markets have become important components of financial institutions. Traditionally, extant literature uses VaR to estimate the market risk. However, the methodological nature of VaR approaches is that they evaluated the risk of portfolios or markets in isolation and does not consider the interconnected effect among these assessed portfolio or financial markets (Wong and Fong, 2011; Sheu and Cheng, 2012). Using the VaR to estimate the market risk of a specific asset or market, it seems to be unable to fully capture the risk transmission between different financial markets and this led the true risk to often be underestimated. Since the high interconnection of financial markets is a common phenomenon, the
evaluation of market risk not only should consider the risk of a market’s economic activities itself, but it should also include the risk impact from other financial markets. Thus, to compensate for the drawbacks of VaR for evaluating market risk, Adrain and Brummermeier (2008) propose a comprehensive measure, “CoVaR”, to capture the interconnected nature of different financial markets.
The concept of CoVaR is defined as the VaR of a financial market conditional on some other financial markets under consideration to measure the severity of risk transmission. After the CoVaR model was proposed, several studies have applied this model to measure the risk spillover from a market to markets and an institution to a market (Acharya et al., 2010; Chan-Lau, 2008; Fong et al., 2009). Sheu and Cheng (2012) indicated that CoVaR has several advantageous properties including the ability of evaluating market risk more comprehensively, the ability of decomposing the marginal risk or risk spillover from the entire risk and the ability to help investors to focus on important risk factors. Following the study by Adrain and Brummermeier (2008), three steps are used to estimate market risk and risk spillover. The first step is to measure the VaRs of each of the analyzed financial markets and institutions, respectively. Next, the CoVaR model is employed to assess market risk which is conditional on external specific financial markets or institutions being in consideration. The final step is to calculate marginal risk contribution of a specific financial market or institution to overall market risk, denoted asΔCoVaR , which is defined as the difference between VaR and CoVaR. By using CoVaR andΔCoVaR , the market risk which is conditional on a specific financial market and its risk transmission which can be explored, provides a very useful tool to monitor the effect of market risk factors on financial institutions’ performance. Therefore, Boyson et al. (2010) and Jorion and Zhang (2009) indicated that the CoVaR model is a valid approach to evaluate market risk and risk
spillover.
Hence, due to the severe interdependence in the global financial environment and the appearance of varieties of derivatives, it is important for assessing the performance of financial institutions not only by considering the credit risk of financial institutions but also by incorporating the external market risk and risk transmission between different financial markets. Therefore, this study employs these risk factors to explore the relation between risk factors and managerial performance in Taiwan’s financial holding companies.
2.4 Network DEA model
Data Envelopment Analysis (DEA), as developed by Charnes et al. (1978), provides a measure of the relative efficiency of peer decision-making units (DMUs) when considering the conversion of inputs into outputs. The methodology of DEA is to determine a set of multipliers of outputs and inputs in order to reduce the multi-output and multi-input into a single aggregate measure of the relative efficiencies of units. Therefore, a particular DMU’s relative efficiency score is defined as the ratio of weighted outputs to weighted inputs. The major characteristic of DEA allows the individual DMU to select multipliers with maximal flexibility to reach a perfect performance. Since DEA provides satisfactory procedures to assess the relative efficiencies of operation units, a widespread application of efficiency and productivity in both public and private sector activities has been found. The literature has also reported several bibliographies, including those of Seiford (1997), Gattoufi et al. (2004), and Emrouznejad et al. (2008).
As the DEA has gradually become one of the most powerful approaches in the operational research and management sciences, several alternative models have been presented to compute different performance measures, including the multiplicative model (Charnes et al., 1982), the BBC model (Banker et al., 1984), the additive model (Charnes et al., 1985), the FDH model (Tulkens, 1993), the SBM model (Tone, 2001), and others. However, Färe and Grosskopf (1996, 2000) indicated that the common underlying assumption among these models treats their reference technologies as “black boxes,” in which the transformation processes of converting input resources into output products are not explicitly modeled. In other words, performance management simply specifies what enters the box and what exits, but ignores the transformation processes structures that consist of several interrelated subcomponents in some applications. To measure the
efficiency of such an interrelated system, the network DEA models, proposed by Färe and Grosskopf (1996, 2000), provide fuller access to the underlying diagnostic information of the black box and measure the overall and corresponding subcomponent performance of the DMUs.
According to the structure of the black box’s transformation process, the network DEA model has several forms. Färe and Grosskopf (1996, 2000) classified the network DEA into three models. First, the static model replicates the black box as the production process. In this production process, some outputs of one process are transformed as the inputs of the other process. Second, the dynamic model takes the outputs of the process at one period, which is then consumed by the process in the next period as the inputs. The third model is composed of several parallel processes in the black box, and thus the inputs have to be allocated into these processes and the outputs are an aggregation of these processes.
On combining the evaluation of a firm’s performance and the concept of network model, Seiford and Zhu (1999) indicated that a firm’s value-creating process is a complex phenomenon and a multi-stage performance model is an appropriate model to evaluate a firm’s overall performance. Hence, Seiford and Zhu (1999) initially propose a two-stage series model, named as profitability stage model and marketability stage, to examine the overall and stages efficiencies of the top 55 US commercial banks. Drawing on the methodology of transformation process in DEA models, one has access to look into the underlying diagnostic information of efficiency measurement and to evaluate the overall and subcomponent performance
In responding to the purpose of evaluating the managerial efficiency for Taiwan financial holding companies, this study adopts Seiford and Zhu’s (1999) two-stage
transformation process as performance model to evaluating a FHC’s overall, profitability stage, and marketability stage efficiencies. In the two-stage performance model, it is composed of a profitability stage and a marketability stage in a series. For any DMU𝑘R
(k=1, … ,n), it uses m inputs 𝑥𝑖𝑘R (i=1, … ,m) to produce intermediate products 𝑧𝑝𝑘R
(p=1,…,q) in the first stage, which are then consumed in the second stage to finally generate outputs 𝑦𝑟𝑘R (r=1,…,s). In addition, by considering the impact of negative output
data and subsequent translation, this study follows the Lovell and Pastor’s (1995) suggestion using the output-oriented BBC model to conduct the evaluation of each stage’s performance due to its character of translation invariant. Therefore, the efficiencies of the two stages for DMUk are measured by the BBC model (Banker et al., 1984):
1 1 1 1 1 min s.t. 1 0 (2.1) 1,..., ; 1,..., ; 1,..., m k i i ik q p pk p m q i ij p pj i p v x z v x z i m p q j n q v η η v = = = = = + = − + ≥ = = =
∑
∑
∑
∑
ηp,vi ≥ >e 0 ; v is free 2 1 1 1 1 min s.t. 1 0 (2.2) 1,..., ; 1,..., ; 1,..., q k p p pk s r rk r q s p pj r rj p r z u y z u y r s p q j n q η v η v = = = = = + = − + ≥ = = =∑
∑
∑
∑
,ur ηp ≥ >e 0; v is freeWhere: θ𝑘1 of model (2.1) is the efficiency of first stage, which represents the efficiency of Dmu𝑘 using inputs x𝑖𝑘R to produce intermediate products 𝑧𝑝𝑘 while θ𝑘
2 of model (2.2)
represents of second stage’s efficiency for using intermediate products 𝑧𝑝𝑘R to generate
intermediate products 𝑧𝑝𝑘 are the outputs in first stage and also the inputs of second stage, Therefore, the overall efficiency (𝜃𝑘), representing the overall performance of Dmu𝑘, is estimated by the product of two-stage efficiencies (𝜃𝑘1, 𝜃𝑘2).
3. Managerial performance issue
The Taiwan financial market has become highly competitive after the introduction of financial liberalization and restructuring. This evaluation results in an excessive amount of financial institutions and fierce competition among these institutions in the Taiwan market, which compel them to diagnose their competitive advantages and market positions. According to the elaboration of Hill and Jones (2004), a firm’s competitive advantages come from both the resources it has and its capabilities to use these resources. Thus, to increase their survival and future development, the Taiwan financial institutions have to identify inefficient sources of using extant resources and efficient functions of generating profits and then they try to enhance and improve their strengths and weaknesses, respectively. Furthermore, different from contemporary managerial performance, the financial institutions also have to explore their long-term advantages that are not easily replicated and are defined as sustainable competitive advantages. Barney (1991) indicated that a firm’s sustainable competitive advantage comes from its resources and capability that cannot be duplicated or imitated by other firms. Bharadwaj et al. (1993) propose that a firm with a sustainable competitive advantage will lead to superior business performance in the service industries.
The purpose of this section is to identify the managerial performance of financial holding companies in Taiwan. Due to the complexity of the value-creating process, a multiple-factors performance model is employed to assess firm performance, which is sequentially employed to diagnose competitive capabilities of FHCs’ operation for determining inefficient costs and profit niches by conducting efficiency decomposition. In addition, the Malmquist index (MI) represents the change of total factor productivity
between two different periods. Thus, the MI is applied to evaluate the long-term competitive capabilities of financial institutions for their future development.
3.1 Performance model
This study uses 14 financial holding companies as the research sample. In Taiwan, a financial holding company is established containing more than two other financial subsidiaries. Therefore, according to their operating main body, 14 FHCs in Taiwan are divided into three groups. The first group focuses on the bank as a major body which includes China Development, Chinatrust, E.SUN, First, Hua Nan, Mega, SinoPac, and Taishin. The second group is the insurance company as the major body, which is composed of Cathay, Fubon and Shin Kong. The last group uses securities as the main body, and it is represented by companies such as Fuhwa, Jihsun and Waterland. In addition, a FHC’s value-creating process is a complex phenomenon. The evaluation of a firm’s value should consider not only profitability efficiency evaluated by the production or the intermediation approach but should also involve marketability efficiency. Previous studies have indicated that a multi-factor performance model is appropriated for evaluating a firm’s overall performance (Chakravarthy, 1986; Siford and Zhu, 1999; Zhu, 2000; Lo and Lu, 2009). Thus, this study employs a two-stage series model to analyze FHCs’ managerial performance, where each of these FHCs is treated as a decision making unit (DMU) in the DEA analysis. Moreover, a financial holding company is composed of more than two other financial subsidiaries and the performance of these financial subsidiaries also play a critical role in improving a firm’s overall performance and competitive capability. Therefore, this study adopts Seiford and Zhu’s (1999) two-stage series model but decomposes a FHC’s overall revenue and profit into the financial subsidiaries’ profit as intermediary variables of
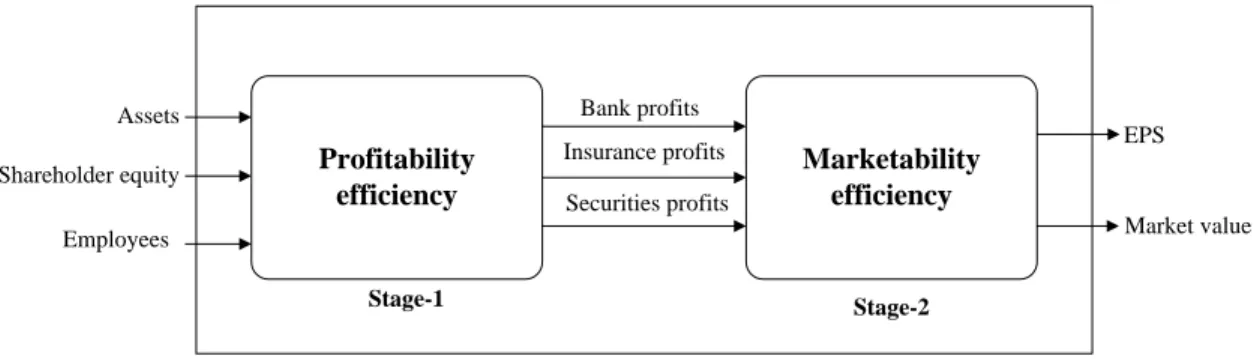
a performance model for estimating a FHC’s overall performance, profitability and marketability efficiency, as shown in Figure 1.
Profitability efficiency Marketability efficiency Stage-1 Stage-2 Assets Shareholder equity Employees
Insurance profits EPS
Market value Securities profits
Bank profits
Figure 1 Network efficiency model for financial holding companies
Therefore, the overall performance model contains two stage activities, namely, a profitability activity and a marketability activity. The efficiency of the first stage is denoted as the profitability efficiency, which evaluates the ability about how a FHC utilizes its capital and labor resources to generate subsidiaries’ profits. In this stage, three major costs consisting of assets, shareholder’s equity, and employees are used to produce three intermediate outputs including the profits generated from banking, insurance and securities. The efficiency of the second stage is marketability efficiency, which describes transformational activities of converting operating results into earnings of shareholders and stock prices in the stock market. In this stage, the three intermediate outputs generated from the first stage are consumed to eventually generate outputs including earnings per share (EPS) and market value. The input and output variables used in this study are defined as follows.
Table 1
Summary of definitions for managerial performance variables
Variables Definitions
Input variables
Asset A firm’s total economic value of resources at year-end
Shareholder equity The amount of share capital plus retained earnings minus treasury shares Employee All staff members in a financial holding company
Intermediary variables
Bank profits After-tax profits from banking subsidiary Insurance profits After-tax profits from insurance subsidiary Securities profits After-tax profits from securites subsidiary
Output variables
EPS A company's earnings allocation per share of outstanding common stock. Market value The total dollar value of a company's outstanding common shares in the last exchange date of the year
Table 2
Data description of variables for 14 FHCs’ managerial performance
Year Stat. Asset Equity Employee Bank
profits Insurance profits Securites profits EPS Market value 2007 Avg. 14446.14 1165.93 11103.07 61.40 32.83 24.05 1.22 1591.19 Max. 36866.94 2298.90 38033.00 188.70 256.61 100.63 3.34 6271.26 Min. 2459.30 256.07 1287.00 -30.80 -0.04 1.53 0.03 201.88 S.D. 9701.34 606.14 9579.15 74.89 78.05 26.16 0.84 1500.72 2008 Avg. 14774.72 1003.32 11350.71 30.20 -19.79 4.43 -0.19 999.33 Max. 37461.65 1780.34 42219.00 143.41 45.52 132.15 1.51 3554.20 Min. 1805.82 216.18 1351.00 -41.52 -256.29 -40.26 -3.80 64.90 S.D. 10148.49 491.21 10495.96 66.90 70.80 40.03 1.48 898.91 2009 Avg. 16,412.95 1,182.08 12,034.71 39.21 16.08 16.08 0.69 1,572.92 Max. 42,955.36 2,154.23 43,340.00 166.34 142.31 51.78 2.47 5,773.51 Min. 1,851.57 256.09 1,603.00 -70.39 -1.18 0.18 -1.45 226.96 S.D. 11,915.51 626.56 11,515.20 55.78 39.31 14.25 0.88 1,451.17 2010 Avg. 17,626.48 1,235.34 12,237.00 76.79 -0.15 15.55 1.03 1,742.15 Max. 46,889.37 2,224.75 42,605.00 218.00 96.84 77.70 2.10 5,249.83 Min. 2,117.20 283.45 1,615.00 6.76 -92.69 -0.19 0.32 301.01 S.D. 12,829.72 644.56 11,366.46 65.82 37.64 19.92 0.43 1,314.84
3.2 Contemporary performance analysis
An evaluation of a FHC’s profitability and marketability efficiencies is conducted from 2007 to 2010 and relevant data description is depicted in Table 2. The inputs for each FHC in the profitability stage are assets, shareholder equity, and employees. The intermediates are profits generated from financial subsidiaries. The marketability stage outputs are EPS and market value. The stage’s efficiencies (𝜃𝑘1, 𝜃𝑘2) and the corresponding overall efficiencies θ𝑘 of 14 FHCs are calculated by equations 2.1 to 2.2. Table 3 shows all the results.
The mean score of the all FHCs computed from 2007 to 2010 is 0.799. In a performance analysis, just one of the 14 FHCs which performed efficiently in both stages is Jihsun, which can be regarded as a benchmark and niche player for other non-efficient units. This followed by an overall score of 0.979 which was recorded by Mega. The mean scores for the profitability and marketability stages based are 0.881 and 0.905, respectively. For the profitability stage, three FHCs: Fubon, Waterland, and Jihsun are FHCs that perform efficiently, which can be regarded as a benchmark of other inefficient FHCs in using the existing resources to create profits. Four FHCs: namely Cathay, Fuhwa, Chinatrust, and Jihsun are at perfect efficiency in the marketability stage, which is the marketability benchmark of other inefficient FHCs in transferring profits of financial subsidiaries to create more shareholders’ earnings, stock prices and market value. To make comparisons among the FHCs’ operation scale and operating main body, the average values of the overall performance, profitability and efficiency scores are calculated and shown in Table 3.
Table 3
Contemporary managerial performance for 14 FHCs from 2007 to 2010
FHCs Overall efficiency Profitability efficiency Marketability efficiency Hua Nan 0.834( 7) 0.884( 7) 0.938( 8) Fubon 0.944( 3) 1.000( 1) 0.944( 7) Cathay 0.837( 6) 0.837(11) 1.000( 1) China development 0.848( 5) 0.998( 4) 0.851(10) E.SUN 0.851( 4) 0.863( 9) 0.988( 6) Fuhwa 0.643(12) 0.643(14) 1.000( 1) Mega 0.979( 2) 0.987( 5) 0.991( 5) Taishin 0.688(11) 0.908( 6) 0.762(13) Shin Kong 0.491(14) 0.655(13) 0.772(12) Waterland 0.831( 8) 1.000( 1) 0.831(11) SinoPac 0.605(13) 0.858(10) 0.681(14) Chinatrust 0.821( 9) 0.821(12) 1.000( 1) First 0.812(10) 0.879( 8) 0.906( 9) Jihsun 1.000(1) 1.000( 1) 1.000( 1) Average scores Overall mean 0.799 0.881 0.905 By scale large 0.797 0.879 0.902 Small 0.800 0.884 0.907 By main body Banking 0.805 0.900 0.890 Insurance 0.757 0.831 0.905 Securities 0.825 0.881 0.944
The overall efficiencies reveal that small-size FHCs (with a mean value of 0.800) operate better than large-size FHCs (with a mean value 0f 0.797). A further decomposition of overall performance indicates that the small-size FHCs perform better in both the profitability and marketability stages. These results show that large-size FHCs show less capability to generate higher profits and firm value with their large scale assets. Moreover, this finding also reflects the dilemma of Taiwan's financial industry - that is, under a fragmented financial environment, the large-size FHCs not only cannot take advantage of economies of scale to achieve better operating results, but they dilute their profitability and
marketability due to the inefficiency of excess assets. Hence, the small-size FHCs on average operate better than the large-size ones. This finding is consistent with Akhigbe and McNulty (2003) in that small-size financial institutions offer more profit efficiency than large-size ones, and perhaps the small-size FHCs scale are more suitable in Taiwan’s fragmented and overcrowded market due to having better competitive capability in terms of profits and market efficiency. In terms of the FHCs’ operation main body, the overall performance indicated that the securities-based FHCs (with a mean value of 0.825) operate better than the banking-based FHCs (with a mean value of 0.805) and insurance-based FHCs (with a mean value of 0.757). A further decomposition of overall performance indicates that the securities-based FHCs perform better than other types in both the profitability and marketability stages. This result might arise from two aspects. One is that the demand for financial services has recovered rapidly from the failure of subprime securities and credit default swaps of financial institutions leading to securities-based FHCs enjoying significant positive revenue and profits in this period. The other is that securities-based FHCs have better capabilities of using existing resources to create satisfactory profits. Hence, under high competition in the Taiwan financial market, the capability of efficiently using existing resources for creating profits might play a critical role in the FHCs’ competitive advantage, which leads to superior profitability performance as well as subsequent marketability performance. In general, the results of contemporary performance analysis indicates that the competitive advantages of three types of financial subsidiaries in the current Taiwan financial market provides the FHCs’ management with a direction of business planning and resource allocation.
3.3 Further efficiency decomposition
By adapting the two-stage series model such as in Figure 1, the performance of each FHC can be decomposed into the profitability and marketability stages. The results of the above section indicate that the profitability stage has an inferior average score than the marketability stage, indicating that a lower overall performance of these FHCs may be attributed to their worse performance in the profitability stage. This implies that the performance of profitability for each FHC plays a critical role in the overall performance although they present a better performance in the marketability stage. In order to provide investors and firm management with a better understanding of the operation of the FHCs, Table 4 draws a further decomposition of the efficiency scores to provide additional insights. The multipliers obtained from the DEA methodology represent the measure for the importance of the input, intermediary and output variables and they also represent the relative contribution of the corresponding variables to efficiencies. Thus, the main purpose of decomposition is to realize the importance of variables to further determine the FHC’s managerial focus and competitive capabilities.
With respect to the capability to use of the firm’s resources, the decomposition of profitability efficiency for FHC𝑘 indicates the contributions from assets, employees, and shareholder equity by the ratio of vixik/ ∑ vmi=1 ixik. These ratios also reflect the importance of input variables to the profitability efficiency, which is the managerial focus of a FHC operation. Regarding the importance of these input variables; shareholder equity has the largest contribution, which accounts for 57.3% of the average profitability cost. The input variable of asset is second, and accounts for approximately 31.1% of the average profitability cost. The third input variable is employee with 11.6% contribution. By referring to these ratios, a FHC’s management team further identifies the managerial focus
of cost-controlling and resource allocation in enhancing the profitability efficiency.
In the marketability sage, identifying the profit niche is a major concern in the efficiency decomposition. The marketability efficiency decomposition is composed of the contributions from intermediary outputs and eventually outputs. The former are the results of the profitability stage as well as the inputs in the marketability stage including profits created from financial subsidiaries. The latter represents eventual output in the marketability stage including EPS and market value. According to equations 2.1-2.2, their efficiency decomposition can be calculated by the ratios of ηpzpk/ ∑qp=1ηp𝑧pk and uryrk/ ∑sr=1uryrk, respectively. Regarding the contribution of these intermediary output
variables to the profitability efficiency score, a profit of the banking subsidiary has the largest contribution, which accounts for 53.2% of the average profitability score. Second is the profit of the insurance subsidiary which accounts for 33.9% of the average profitability score. The last is the profit of the securities subsidiary with a 12.9% contribution to the average profitability score. With respect to the contribution of final output variables to the marketability efficiency score, the EPS has the largest contribution, which accounts for 87.0% of the average marketability performance and market value with a 13.0% contribution. Hence, investigating the contribution of the intermediary and output variables is very helpful for FHCs to identify their main profit niche and determinant factors of their marketability performance.
In addition, a further decomposition based on the operation scale indicates that the profit niche of small-size FHCs is same with the large-size FHCs. That is, the major profit resources of all FHCs come from the banking and insurance subsidiaries. However, the profits for securities have more contribution in small scale FHCs than in large scale ones.
The decomposition of the operation main body shows that the main profit niche of banking-based and insurance-based FHCs come from their main business while profit niche of the securities-based FHCs comes from sideline businesses. However, the results also demonstrate the importance of sideline businesses. For example, sideline businesses accounts for 83.1% contribution of securities-based FHCs’ overall profit and it also contributes 47.3% and 37.6% to overall profit of insurance-based and of banking-based FHCs, respectively. Therefore, by maintaining existing financial market scale invariant, the cross-business integration of financial institutions not only can enlarge their business scope but also can create more benefits and profits for their survival and development in overcrowded and competitive environment. By using the results of efficiency decomposition, the FHCs’ management teams are able to detect the major variables contributing to the overall performance, profitability and marketability efficiencies. They can also identify the areas where the greatest gains can be acquired from improvements and suggest to the FHCs some adjustments for resource reallocation and business strategy.
Table 4
Efficiency decomposition of 14 FHCs
FHCs
Input variables Intermediary variables Output variables
Asset Equity Employee Bank
profits Insurance profits Securities profits EPS Market value Hua Nan (7) 0.034 0.781 0.185 0.185 0.741 0.221 0.038 0.899 Fubon (2) 0.427 0.573 0.000 0.000 0.137 0.839 0.024 0.964 Cathay (1) 0.000 1.000 0.000 0.000 0.550 0.379 0.071 0.823 China development (12) 0.750 0.231 0.019 0.019 0.298 0.445 0.257 0.668 E.SUN (10) 0.000 1.000 0.000 0.000 0.558 0.442 0.000 1.000 Fuhwa (11) 1.000 0.000 0.000 0.000 0.479 0.492 0.029 1.000 Mega (3) 0.099 0.000 0.901 0.901 0.755 0.245 0.000 0.933 Taishin (4) 0.175 0.825 0.000 0.000 0.697 0.243 0.060 1.000 Shin Kong (5) 0.000 1.000 0.000 0.000 0.435 0.362 0.202 0.500 Waterland (14) 0.750 0.211 0.039 0.039 0.844 0.156 0.000 1.000 SinoPac (9) 0.000 0.842 0.158 0.158 0.217 0.190 0.593 0.686 Chinatrust (8) 0.750 0.250 0.000 0.000 1.000 0.000 0.000 1.000 First (6) 0.060 0.774 0.166 0.166 0.727 0.213 0.060 0.955 Jihsun (13) 0.314 0.535 0.151 0.151 0.006 0.518 0.477 0.750 Average scores Overall mean 0.311 0.573 0.116 0.532 0.339 0.129 0.870 0.130 By scale Large 0.114 0.708 0.179 0.577 0.357 0.065 0.868 0.132 Small 0.594 0.371 0.035 0.531 0.342 0.127 0.903 0.097 By main body Banking 0.233 0.588 0.179 0.624 0.250 0.126 0.893 0.107 Insurance 0.142 0.858 0.000 0.374 0.527 0.099 0.762 0.238 Securities 0.688 0.249 0.063 0.443 0.389 0.169 0.917 0.083