Application of perceived value model to identify factors
affecting passengers’ repurchase intentions on city bus:
A case of the Taipei metropolitan area
WILLIAM JEN* & KAI-CHIEH HU
Department of Transportation Technology and Management, National Chiao-Tung University, No. 1001, Ta Hsueh Road, Hsin Chu, 30050, Taiwan (*Author for correspondence: E-mail: [email protected])
Key words: perceived benefits, perceived costs, perceived value, repurchase intentions, service
quality
Abstract. This paper establishes and tests the perceived value model, which is applied to identify
the factors affecting the passengers’ repurchase intentions on city bus. In this study, perceived value is a trade-off between perceived benefits and perceived costs. And the main part of per-ceived benefits is service quality. We (1) measured service quality using a multiple-items scale, (2) integrated perceived non-monetary price as a part of perceived costs, and (3) simultane-ously incorporated the attractiveness of alternative modes. Data was collected via a questionnaire survey in the Taipei metropolitan area and the model was tested using path analysis performed by LISREL. The results indicate that all causal relationships are statistical significant. Finally, this study concludes by discussing managerial implications and making suggestions for future research.
1. Introduction
Travel activity analysis has received increasing attention from various disci-plines during the past two decades, including urban planning, sociology and psychology, and, more recently, transportation (Kuppam & Pendyala 2001). Travel behavior models have been successful in predicting travel demand and mode choice. Many researchers have been applied related theories and methods to develop various choice models (Ben-Akiva & Morikawa 1990; Hensher 1994; Koppelman & Wen 1998; Ortuzar & Iacobelli 1998 . . . etc). They found variables that significantly affect the traveler behavior and determined which type of service satisfied passengers. However, those vari-ables, such as fare, frequency, traveling time and waiting time, are objective and easy to quantify. Consequently, related studies could not successfully explain passengers’ purchase intentions or motivations for their behavior. With respect to marketing research, determining what and how factors affect consumer behavioral intentions can explicate the rationality of a purchase.
Transportation 30: 307–327, 2003
More than one of these factors are subjective and hard to quantify latent variables. For example, how do passengers perceive the service quality? Do they perceive the costs to be acceptable? Is the service offered valuable? Are they willing to ride again? Previous research on public transportation has been deficient in exploring conceptual variables derived from those ques-tions and the causal relaques-tionships among them. Exploring a causal model that elucidates the relationship between perceived value and behavioral intentions is important.
Customer repurchase intentions are frequently determined by perceived value (Dodds 1991; Teas & Agarwal 1997; Cronin et al. 2000). Perceived value is based on customers’ careful evaluation of a product or service (Zeithaml 1988), and can be summarized as a trade-off between perceived benefits and perceived costs (Lovelock 2000). Thus, the basic framework of the perceived value model is as follows. 1. Perceived value positively affects repurchase intentions. 2. Perceived benefits positively affect perceived value. 3. Perceived costs negatively affect perceived value. When the perceived benefits enjoyed by passengers outweigh the perceived costs, passenger repurchase intentions tend to be high (Dickson & Sawyer 1990; Lee & Cunningham 1996; Sweeney et al. 1997; Cronin et al. 2000; Brady et al. 2001). Perceived benefits typi-cally include functions, quality, form and brand; quality is the most commonly considered. Many studies have concluded that service quality positively affects perceived value (Cronin et al. 2000). Most past researches on service quality in a model of perceived value have measured customer perceptions via single-item. However, single-item measurement approach does not allow opportunities to assess the reliability of the construct as well as the overall model (Oh 1999). Since service quality is known to be multidimensional, and thus should be measured using multiple items to yield more accurate results.
Generally, perceived costs include perceived monetary price and perceived non-monetary price (such as time, effort, search and psychic) (Zeithaml 1988). Most previous research, however, has focused on actual price, since per-ceived non-monetary price is hard to quantify. Hence, few studies have explored and verified perceived non-monetary price from the passengers’ perspectives.
Furthermore, the effects of alternatives on repurchase intentions have not been taken into account in previous research. Jones et al. (2000) found that the influence of core-service satisfaction on repurchase intentions is slight under when highly attractiveness of alternatives are available. In urban areas, alternative modes of transport, such as private transit (including automobile or motorcycle) and paratransit, can replace city buses. Accordingly, the influ-ence of the attractiveness of alternative modes should be considered when analyzing the relationship between passengers’ perceived value and repurchase intentions.
Although several scholars have devoted themselves to investigating the effects of perceived value on consumer behavioral intentions, the relation-ship between perceived value and repurchase intentions remains incompletely understood and further measurements must to be made and refined according to the characteristics of specific industries (Oh 1999). This study establishes and tests the perceived value model, which is applied to identify the influ-ence factors of the passengers’ repurchase intentions on city bus. In particular, service quality was measured using a multiple-items scale. Moreover, the research model presented in this study integrated perceived non-monetary price as a part of perceived costs and simultaneously incorporated the attractive-ness of alternative modes.
This study applied path analysis to test causal models that specify causal relationships between particular variables. The method of linear structural rela-tions (LISREL) was employed to confirm the fitness of the research model and the cause-effect relationships among the variables. The data was collected via a questionnaire survey in the Taipei metropolitan area.
The rest of this paper is organized as follows. Section 2 briefly reviews pertinent literature on service quality, perceived costs, and perceived value, and thus establishes a basic direction for this research. Next, a research model and hypotheses are presented to identify the relationships among the latent variables. Section 4 then presents the research method and research vari-ables. Next, Section 5 summarizes the results of the model fitness test and estimation, respectively. Finally, discussing the managerial implications and the suggestions for future research makes the conclusions in this study.
2. Conceptual background
Service quality and perceived benefits
Perceived benefits significantly influence perceived value (Lovelock 2000). Perceived benefits usually involve product or service elements, such as func-tions, quality, form and brand, among which quality is most commonly discussed. Some studies have concluded that service quality is an important variable of perceived value and perceived benefits (Bolton 1991). However, service quality is even harder to measure in the service industry, because of intangibility, inseparability, variability and perishability (Parasuraman et al. 1985, 1988). Therefore, Parasuraman, Zeithaml and Berry (PZB) developed a scale, called SERVQUAL, which comprises five dimensions and 22 items for measuring service quality, with the five dimensions including tangibility, reliability, responsiveness, assurance and empathy. Nevertheless, Babakus and Boller (1992), Carman (1990), Finn and Lamb (1991), Cronin Jr. and
Taylor (1992) and Triplett et al. (1994) found no consistency in dimensions when SERVQUAL is applied. Carman (1990) even suggests that the ques-tionnaires should be redesigned based on PZB’s procedures and the original ten dimensions. The characteristics of different industries should be consid-ered to ensure accurate results.
The authors have study the service quality of the public transportation system, and apply a three-staged procedure of scale and dimension simplifi-cation (Jen & Hu 2001). It concludes by deriving a set of 20 questions and obtaining four quality dimensions. The dimensions are as follows: (1) Interaction with passengers: Passengers feel respect and care when inter-acting with service providers. The bus companies responded to passengers’ problems friendly and reasonably. (2) Tangibility Service Equipment: The bus companies offered the passengers comfort. (3) Convenience of service: Mass transit is accessible. There is sufficient bus (route) information and a convenient network. (4) Operation management support: Bus companies’ support, including bus schedules, service periods and dispatching of attendants, passenger demand was satisfactory (Jen & Hu 2001). This scale can be used to evaluate the service quality of Taipei city bus service.
Perceived costs
How much consumers must give up or sacrifice in making a purchase gen-erally affects their assessment of perceived value (Zeithaml 1988; Bolton & Drew 1991). The sacrifice made in the purchase is the perceived cost of the consumer, and includes perceived monetary price (PMP) and perceived non-monetary price (PNMP) (Zeithaml 1988; Murphy 1986). PMP refers to the actual sum of money consumers must pay to acquire a product or service, while PNMP refers to the time, search and psychological costs associated with a purchase. However, most studies limit themselves to considering only the perceived monetary price, not the non-monetary price. Oh (1999) suggests that future studies should consider PNMP in different industries.
Perceived value
Perceived value has been judged to be one of the most important marketing strategies in differentiation, and is a significant factor in maintaining corpo-rate competitiveness (Treacy & Wiersema 1993; Heskett et al. 1994; Ravald & Gronroos 1996). Customer perceived value comes evaluating services or products from two perspectives, received and given; namely, perceived value comes from a trade-off between perceived benefits and perceived costs (Dodds & Mornoe, 1985; Mornoe & Chapman 1987; Rys et al. 1987; Zeithaml 1988; Teas & Agarwal 1997). Presently, most researchers agree that perceived value 310
is determined by comparing perceived benefits and perceived costs (Lovelock 2000).
Many researchers have found that customer perceptions of value directly and significantly influence their buying decisions (Teas & Agarwal 1997; Dodds 1991), and purchases become more likely when the benefits gener-ated exceed the costs (Dickson & Sawyer 1990). Zeithaml’s study (1988) also demonstrated that perceived value is influenced by perceived service quality, and correlates positively with purchasing decisions. Lee and Cunningham (1996) indicated that in the airline industry, company service correlates positively with consumer loyalty. Meanwhile, Swait and Sweeney (2000) analyzed the retailing industry and identified the influences on customer selection behavior, revealing that group selection behavior altered with per-ceived value. Salter (1997) and Parasuraman (1997) also found perper-ceived value to be important in understanding customer purchasing behavior.
Zeithaml (1988) used the Means-End model to analyze the relationships among price, quality and perceived value, and demonstrated that service quality significantly influences perceived value. Based on experience of interaction with customers, Fredericks and Salter (1995) confirm four influences on per-ceived value: price, quality, innovation and company image. Meanwhile, Bojanic (1996) explained the relationship among perceived value, price, quality and satisfaction, and noted that price and quality determine perceived value, which correlates positively with satisfaction. Sweeney et al. (1997) also find a close correlation between service quality and perceived value. Furthermore, Cronin et al. (2000) investigated the direct and indirect influences of quality, value and satisfaction on consumer purchasing intentions, and showed that the indirect influences must also be considered to thoroughly explain repur-chase intentions. Oh (1999) conducted an experimental study of the hotel industry, exploring the relationship among service quality, value and satis-faction, and found that perceived value and perceived service quality do not correlate significantly, and nor do service quality and satisfaction. Oh further suggested that each model construct or variable should be measured using multiple items. Meanwhile, studies should consider different influences with different industries, variables should be clearly defined, and price should not be the only determinant of perceived costs.
Attractiveness of alternatives
Passengers’ repurchase intentions are not determined by the perceived value of only one vehicle, and competitive alternatives are another significant influ-ence. Attractiveness of alternatives refers to customer perceptions regarding the extent to which viable competing alternatives are available in the mar-ketplace (Jones et al. 2000). The lower attractiveness of alternatives is
associated with higher repurchase intentions. Therefore, attractiveness of alter-natives has negative influence on customer behavioral intentions.
3. Research model
Model formulate
Based on the above literature review, this study summarizes that many researchers derive the same conclusion of a positive correlation between per-ceived value and repurchase intention. Offer customers a valuable service means offering perceived benefits which exceed the perceived costs, and per-ceptions of value directly influence willingness to buy (Dodds et al. 1991), with customers being increasingly attracted to repurchase when the perceived value exceeds the perceived costs. In accordance with the findings of previous studies, passenger perceived value is defined as the tradeoff between perceived benefits and perceived costs, and thus is affected by perceived benefits and perceived costs. Customers acquire and receive perceived value, and make a sacrifice of perceived costs to do so.
However, most past studies focused on the retail industry, and usually make product prices the only variable for perceived costs because of the difficulty of measuring non-price factors. For service businesses, price alone is inadequate to explain all the costs paid by customers in purchasing a service. Consequently, this study proposes a more objective and sophisticated model, which incorporates the non-price variables that characterize the bus service.
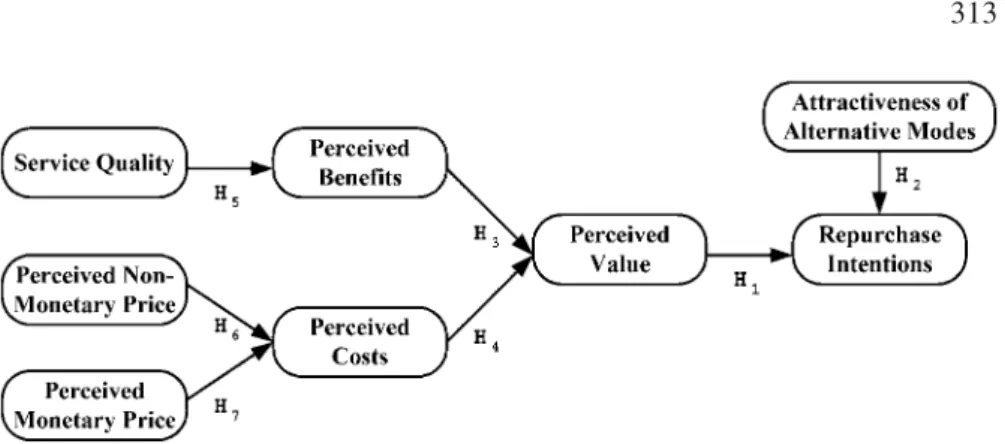
Alternative transport services should also be considered in research model. The competing alternatives of city bus service include other bus companies and various modes, such as taxi, automobile, and motorcycle. Thus this latent variable in this study is named as “attractiveness of alternative modes”. As the attractiveness of alternative modes decreases, passenger repurchase inten-tions will increase (Jones et al. 2000). A model for a bus service should incorporate the influence of alternative modes because passengers generally desire transportation systems with better services and fewer prices. Figure 1 presents a proposed model of passenger perceived value.
Hypotheses
First, passenger repurchase intentions increase and decrease along with per-ceived value. Meanwhile, choices on various modes also disturb people’s repurchase intentions. From the above, this study deduces the first two hypotheses, as follows.
H1: Passenger perceived value is positively and directly related to
repur-chase intentions.
H2: Attractiveness of alternative modes is negatively and directly related
to passenger repurchase intentions.
Second, perceived value is the results from comparing perceived benefits and perceived costs. That is, perceived value results from passenger evalua-tion of costs incurred and benefits received. The third and fourth hypotheses are stated as follows.
H3: Passenger perceived benefits are positively and directly related to
per-ceived value.
H4: Passenger perceived costs are negatively and directly related to
per-ceived value.
Service quality is used here as an exogenous variable for perceived benefits, and has positive effect on perceived benefits. The following is our fifth hypoth-esis.
H5: Perceived quality is positively and directly related to perceived
benefits.
Finally, existing studies have consistently demonstrated that perceived costs include both non-monetary and monetary prices. Monetary costs simply refer to the money passengers spend in taking a bus while the non-monetary price includes time costs, search costs and the psychological costs. Perceived cost increases with ticket price, as well as with trip time, difficulties in obtaining information on the service or long waits for services to arrive. The following are our final two hypotheses about the perceived costs:
H6: Perceived non-monetary price is positively and directly related to
perceived costs.
H7: Perceived monetary price is positively and directly related to perceived
costs.
4. Methods
Data collection
This investigation focuses on Taipei City bus passengers. The Taipei metro-politan Area has one government agency and thirteen private companies, with over three hundred city bus routes, three thousand buses and two thousand bus stations. Four of thirteen private companies, however, operate less than 14 bus lines and were excluded in this study. Questionnaires were distrib-uted at bus stops or stations, and 75 were given to each of 10 bus companies, for a total of 750 questionnaires.
Measurements
This study employed 26 manifest variables as multiple indicators for 8 con-structs (or latent variables) of the research model. Among these 26 manifest variables, 4 manifest variables relating to service quality are operationalized via a 20-item scale. The Likert 5-point scale is used to measure a total of 46 items.
The first construct, repurchase intentions, is measured using four ques-tions (see Appendix A, Item 1–4) that assess the willingness of respondents to patronize the service again. The wordings of the questions are based on the studies of Dodds et al. (1991) and Brown et al. (1993). Perceived value is expected to influence passenger repurchase intentions. The current study measured perceived value using three items (see Appendix A, Item 5–7), selected based on a literature review (Bolton and Drew 1991; Dodds et al. 1991; Brown et al. 1993). Perceived value results from comparing perceived benefits and perceived costs (Zeithaml 1988), which are the third and forth constructs in this study, and are both measured using three items (see Appendix A, Item 8–10 and Item 11–13). As defined by Heskett et al. (1990) and Zeithaml (1988), perceived benefits represent the “take” component of service value, while perceived costs represent the “give” component. This study employs indicators from Brown (1993), which are also used in other studies (Chapman & Wahlers 1999; Oh 1999; Sweeney et al. 1997, 1999; Swait & Sweeney 2000; Cronin et al. 2000; Brady et al. 2001)
The fifth construct, service quality, has been widely discussed. PZB defines 314
service quality as the comparison results on both the expected service and perceived service. This study adopts Jen and Hu’s (2001) scale for measuring public transportation service quality to design appropriate questions. This scale includes four dimensions, interaction with passengers, tangibility, ease of access to service and operating management support (see Appendix A, Item 14–17), and these four dimensions are also the manifest variables used in this study to measure the latent variable “service quality”. Among the four dimensions, 6 questions relate to “interaction with passengers”, 6 to “tangible service equipment”, 5 to “convenience of service” and 3 to “operating management support”. The values of these four manifest variables are determined by calculating the averages in the dimensional questions.
The sixth construct, perceived non-monetary price, comprises the search, psychological and time costs that consumers incur in making their purchase (Zeithaml 1988). In the current study, search costs are the passengers’ per-ceptions regarding whether they can easily reach the bus stations or not. Meanwhile, the psychological costs include waiting time, while time costs refer to travel time. Therefore, the manifest variables of this latent variable include: convenience of accessing stations, waiting time, and travel time (see Appendix A, Item 18–20). Perceived monetary price, the seventh construct in the current study, is the amount of money that passengers spend to acquire a product or service. However, passenger perceptions of ticket prices are varied, with some passengers seeing paying more for better service as reasonable, while others disagree. Therefore, this study adopts three items to measure perceived monetary price (see Appendix A, Item 21–23).
The final construct used in this study is attractiveness of alternative modes. Attractiveness of alternative modes refers to passenger perceptions of the alter-native bus companies or vehicles available for them to choose in the market. When customers have a lower preference for alternatives, then their repurchase intentions are likely to be higher. The manifest variables of this latent variable used in this study (see Appendix A, Item 24–26) are derived from Rusbult (1980), Ping (1993), Sirohi (1998), and Jones et al. (2000).
Analysis
Path analysis is frequently applied to test causal models that specify causal relationships between particular variables (Hatcher 1998). Structural equation models (SEM) are the most powerful instruments for path analysis in mar-keting and consumer research (Davies et al. 1999), and have been widely applied in activity and travel behavior research during recent decades (Kuppam & Pendyala 2001). LISREL, a computer program, has become the most popular software for performing structural equation modelling (Davies et al. 1999). LISREL enables the estimation of measuring error in multiple regression
equations and allows all the relationships among residuals (Oh 1999). Furthermore, LISREL allows the simultaneous estimation of all direct and indirect effects.
The research model in Figure 1 was path analyzed using the Maximum Likelihood estimator of LISREL, with the correlation coefficient matrix (see Appendix B) of the measured variables as input (Joreskog & Sorbom 1993). This study applies the SAS System’s CALIS procedure to perform LISREL (SAS Institute Inc. 1989). The analysis followed a two-step procedure based partly on an approach recommended by Anderson and Gerbing (1988). The first step employed confirmatory factor analysis to develop a measurement model that achieves an acceptable fit to the data. The second step then tests the theoretical model (or structural model) by path analysis to demonstrate a meaningful and statistically acceptable structural model.
5. Results
This study sent out 750 questionnaires to investigate the city bus service. The number of valid questionnaires returned was 235, and the valid response rate was 31.3%. Among the respondents, 63.4% were aged 16–35, females out-numbered males (representing 61.5% of the sample), and students were the dominant group at 45.5%, compared to 37.8% for workers. Most of the subjects were college graduates or had higher degrees.
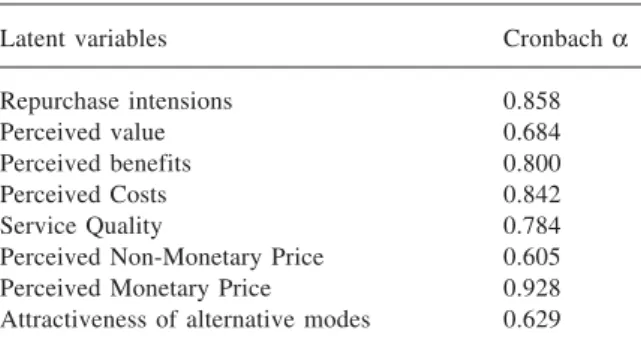
Table 1 illustrates data reliability using Cronbach α. All dimensions for city
bus services have high reliability, with a Cronbach α of over 0.6. Although
PNMP and AAM present 0.584 and 0.565 respectively, they are still within acceptable limits. Generally, the data has acceptable reliability.
316
Table 1. Results of reliability analysis.
Latent variables Cronbach α
Repurchase intensions 0.858
Perceived value 0.684
Perceived benefits 0.800
Perceived Costs 0.842
Service Quality 0.784
Perceived Non-Monetary Price 0.605
Perceived Monetary Price 0.928
Confirmatory factor analysis
Before processing path analysis of latent variables, the measurement model should first be validated with manifest variables that measure the latent vari-ables. Path coefficients could be accurately estimated, since latent variables can be accurately measured. In the measurement model, each indicator variable is predicted to load just one factor; that is, none of the indicators are complex variables (measuring multiple latent variables) (Hatcher 1998).
The psychometric properties of the measures used in this study are assessed via confirmatory factor analysis, and two complex variables are kicked off, namely Item 17 (operating management support) and Item 24 (whether other alternative modes exist). The left items are allowed to load on only one factor
and cannot cross-load on other factors (Brady et al. 2001). The x2 of the
modified measurement model is 409.017 (p-value < 0.0001), and its degree of freedom (df ) is 224. Technically, when the proper assumptions are met,
the x2may be statistically insignificant. However, in practice the x2is extremely
sensitive to sample size and departures from multivariate normality, frequently resulting in the rejection of a well-fitting model (Hoyle 1995). Consequently,
it has been recommended that a model, with below x2relative to df, has a better
goodness of fit (James et al. 1982; Joreskog & Sorbom 1989). The common
level of the x2/df ratio is less below 5 (though below 3 is better) (Joreskog
& Sorbom 1993), and some studies suggest that the x2/df ratio should be less
below 2 (Hatcher 1998). The x2/df ratio for the modified measurement model
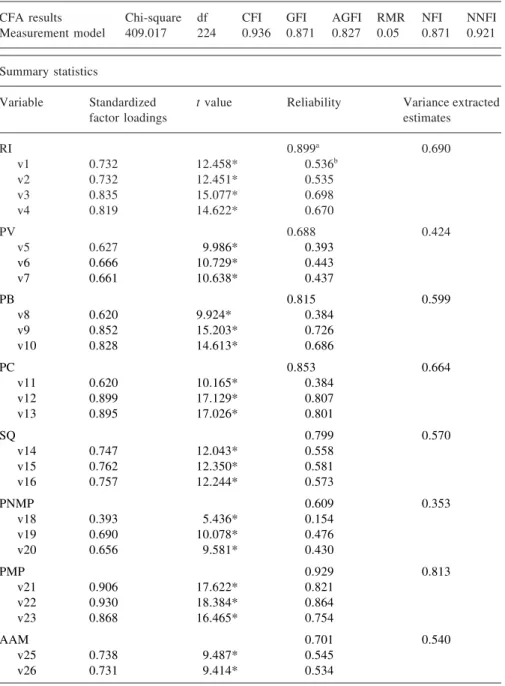
in this study is 1.823 (409.017/224), which indicates an acceptable fit in this sample. Furthermore, the model fit also use CFI, GFT, AGFI, NFI, NNFI, and RMR estimates listed in Table 2. The results in Table 2 indicate a good fit to the data, as the fit indices are exceeded or approach 0.9 and the RMR estimate is 0.05.
The reliability of the measures is assessed using composite reliability and variance extracted estimates, as listed in Table 2. The composite reliability of each construct exceeded 0.6 in this study, satisfying the minimally accept-able level (Hatcher 1998). On the other hand, Fornell and Larcker (1981) suggest that variance extracted estimates should exceed 0.5. However, this test is quite conservative, and variance extracted estimates will often be below 0.5 in practice, even given acceptable reliability (Hatcher 1998). All indices in Table 2 exceed 0.5, except for perceived value (0.424) and perceived non-monetary price (0.353). However, taken as a group the constructs in this model perform fairly well.
Table 2 also employs the t values of the factor loadings to assess validity. All indicator t values range from 5.436 through 18.384, indicating that all factor loadings are significant (p < 0.001). This fact provides evidence supporting
318
Table 2. Summary measurement statistics.
CFA results Chi-square df CFI GFI AGFI RMR NFI NNFI
Measurement model 409.017 224 0.936 0.871 0.827 0.05 0.871 0.921
Summary statistics
Variable Standardized t value Reliability Variance extracted
factor loadings estimates
RI 0.899a 0.690 v1 0.732 12.458* 0.536b v2 0.732 12.451* 0.535 v3 0.835 15.077* 0.698 v4 0.819 14.622* 0.670 PV 0.688 0.424 v5 0.627 09.986* 0.393 v6 0.666 10.729* 0.443 v7 0.661 10.638* 0.437 PB 0.815 0.599 v8 0.620 9.924* 0.384 v9 0.852 15.203* 0.726 v10 0.828 14.613* 0.686 PC 0.853 0.664 v11 0.620 10.165* 0.384 v12 0.899 17.129* 0.807 v13 0.895 17.026* 0.801 SQ 0.799 0.570 v14 0.747 12.043* 0.558 v15 0.762 12.350* 0.581 v16 0.757 12.244* 0.573 PNMP 0.609 0.353 v18 0.393 05.436* 0.154 v19 0.690 10.078* 0.476 v20 0.656 09.581* 0.430 PMP 0.929 0.813 v21 0.906 17.622* 0.821 v22 0.930 18.384* 0.864 v23 0.868 16.465* 0.754 AAM 0.701 0.540 v25 0.738 09.487* 0.545 v26 0.731 09.414* 0.534
N = 235. GFI = goodness of fit index; AGFI = GFI adjusted for degrees of freedom; RMR = root mean square residual; NFI = normed-fit index; NNFI = non-normed-fit index; CFI = Bentler’s comparative fit index;
* Denotes a significant value (p < 0.001).
a
Indicates the composite reliability.
the convergent validity of all indicators which effectively measure the same construct (Anderson & Gerbing 1988).
Path analysis
From the above, theoretical model testing is conducted with path analysis via the use of LISREL, while V17 and V24 are dropped as measures of com-mitment (consistent with our findings in analyzing the measurement model).
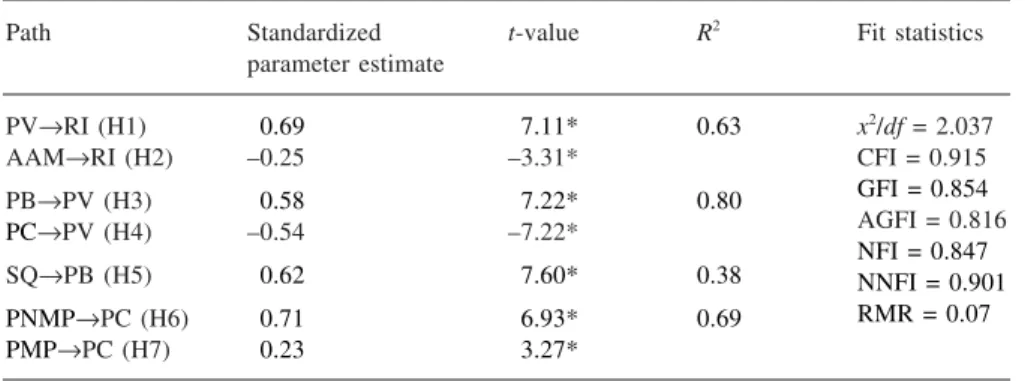
Table 3 lists the goodness of fit for the theoretical model. The x2/df ratio is
2.037(486.75/239), the CFI, GFI, AGFI, NFI, NNFI exceed or are close to
0.9 and the RMR estimate is 0.07. The R2 value in Table 3 indicates the
ability of the research model to explain variation in the four endogenous
variables. Meanwhile, the R2 values for the repurchase intentions, perceived
value, perceived benefits and perceived costs are 0.63, 0.80, 0.38 and 0.69. The research model achieves a fairly good fit (Joreskog & Sorbom 1993).
Table 3 summarizes the results of path analysis. All path coefficients in the current model are statistically significant (p < 0.01) and are as hypothe-sized. Hypothesis 1 indicates that passenger perceived value positively and directly affects their repurchase intentions, and this path reflects that perceived value is important in understanding customer purchasing behavior (Salter 1997; Parasuraman 1997). The result of path testing indicates that the path is statistically significant with a positive relationship, as predicted in Hypothesis 1. Hypothesis 2 predicts that the attractiveness of alternative modes is nega-tively and directly related to passenger repurchase intentions. This path is also statistically significant and represents that the attractiveness of alterna-tive modes negaalterna-tively influences repurchase intentions.
Hypothesis 3 predicts that passenger perceived benefits passengers are positively and directly related to perceived value. Meanwhile, hypothesis 4 predicts that passenger perceived costs are negatively and directly related to
Table 3. Results of the theoretical model tests.
Path Standardized t-value R2
Fit statistics parameter estimate PV→RI (H1) 00.69 07.11* 0.63 x2/df = 2.037 AAM→RI (H2) –0.25 –3.31* CFI = 0.915 PB→PV (H3) 00.58 07.22* 0.80 GFI = 0.854 PC→PV (H4) –0.54 –7.22* AGFI = 0.816 SQ→PB (H5) 00.62 07.60* 0.38 NFI = 0.847 PNMP→PC (H6) 00.71 06.93* 0.69 NNFI = 0.901 PMP→PC (H7) 00.23 03.27* RMR = 0.07
perceived value. As listed in Table 3, these two paths are both significant and consistent with Hypothesis 3 and 4, supporting the hypothesis that per-ceived value is based on a comparison of perper-ceived benefits and perper-ceived costs (Lovelock 2000). Perceived benefits positively influence perceived value, while perceived costs exert a negative influence.
Hypothesis 6 and Hypothesis 7 indicate that perceived non-monetary and monetary prices are positively and directly related to perceived costs. These two hypotheses are supported by the fact that the path coefficients of
PNMP→PC and PMP→PC are statistically significant. Furthermore, perceived
non-monetary price influence perceived costs more than perceived monetary costs, though the difference is minimal (0.71 for PNMP; 0.23 for PNMP).
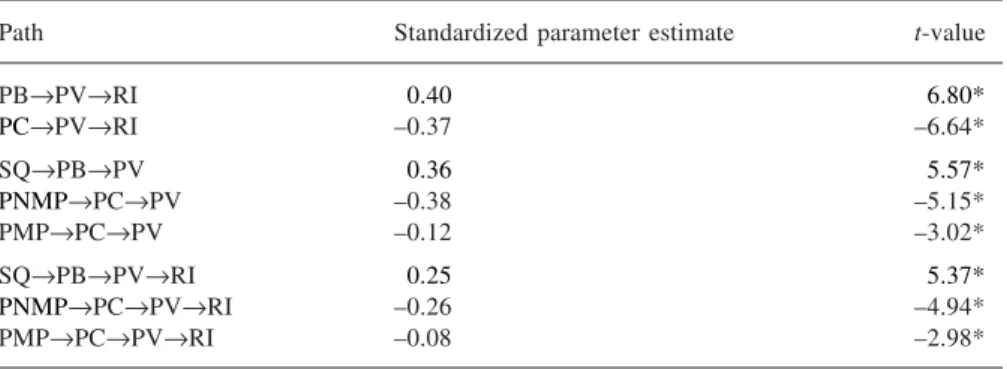
The SAS output also indicates the indirect effects among endogenous and exogenous variables, as listed in Table 4. The model contains eight statistically significant indirect causal paths, and both the perceived benefits and perceived costs have similar effects on passenger repurchase intentions over the perceived value. However, perceived non-monetary price has a greater indirect effect on repurchase intentions than do service quality and perceived monetary price (–0.26 for PNMP; 0.35 for service quality; –0.08 for PNMP).
6. Discussion
Managerial implications
Previous studies demonstrate that the cost of building relationships with new customers considerably exceeds that of maintaining relationships with old ones (Desatnick & Detzel 1993). Thus, given that bus companies are currently losing passengers, holding onto existing customers and creating high repurchase inten-tions is an urgent problem. Furthermore, it is not enough to seek to attract passengers by service quality alone, and companies must also be very respon-sive to customer needs and desires (ECMT 1999).
320
Table 4. Standardized total and indirect effects.
Path Standardized parameter estimate t-value
PB→PV→RI 00.40 06.80* PC→PV→RI –0.37 –6.64* SQ→PB→PV 00.36 05.57* PNMP→PC→PV –0.38 –5.15* PMP→PC→PV –0.12 –3.02* SQ→PB→PV→RI 00.25 05.37* PNMP→PC→PV→RI –0.26 –4.94* PMP→PC→PV→RI –0.08 –2.98*
Passenger repurchase intentions are typically determined by their per-ceived value of the service. Perper-ceived value stems from a comparison between what passengers acquire and what they pay to acquire it (Zeithaml 1988), and the research results verifies hypotheses 3 and 4, that perceived value is a trade-off between perceived benefits and perceived costs. Passengers are con-cerned with the extra value that they can obtain. That is, they are concon-cerned about whether the benefits are sufficient in comparison to the perceived costs. Given identical perceived benefits, perceived value declines with increasing perceived costs, for example higher ticket prices, thus reducing repurchase intentions and causing reduced passenger numbers.
Perceived benefits are influenced by service quality, while perceived costs are a combination of perceived monetary and non-monetary prices. Perceived benefits increase with service quality. Meanwhile, to improve service quality, managers should analyze and understand passenger needs and perceptions, and besides improving tangible facilities, city bus services should stress customer interaction and convenience of service.
According to the research results, perceived monetary and non-monetary prices may increase passenger perceived costs and reduce perceived value. The research results confirm that monetary price is not the only influence on passengers’ repurchase intentions, and thus price cuts are only one ways of reducing perceived costs. Passengers care more about perceived non-monetary price, such as search, psychological and time costs than about prices, and do not like to have to expend great efforts in searching for passenger infor-mation. Furthermore, long waiting times may also waste their patience and spirit. If in-vehicle-travel-time is also a consideration, customers may choose other bus companies or alternative modes of transport, which have similar or better service quality but lower perceived costs (include non-monetary price).
Furthermore, this study indicates that passenger repurchase intentions in city bus services are influenced by perceived value and the attractiveness of alter-natives. More specifically, perceived value exerts a great impact than the attractiveness of alternative modes, indicating that passenger desire to repur-chase the service is influenced by the value of the service offered. Conse-quently, bus companies should focus their efforts on creating valuable services. Repurchase intentions can be increased through valuable and satisfactory services that passengers can perceive. Increasing passenger perceived value would increase repurchase intentions. Meanwhile, if the service is unquali-fied and perceived value declines, bus companies will inevitably face no competition from other bus companies, since passengers will begin to use other vehicles.
Suggestions for future research
This study establishes an integrative model explaining the relationship of passengers’ perceived value and repurchase intentions for a city bus service. The path analysis achieves significant results by applying LISREL, and verifies the hypotheses of the current study, thus demonstrating the worth of the novel perceived value model.
Perceived non-monetary price is included in the analysis as a latent variable. These hypotheses were not rejected in this study. However, previous studies have not discussed and analyzed the three variables of “convenience”, “waiting time” and “vehicle travel time”. Future studies may further explore the defi-nition and measurement of perceived non-monetary price to learn more about passenger perceptions.
Unlike previous studies that mostly employed several general questions to assess service quality, this study measures bus service quality using a modified scale on which scale dimensions serve as the manifest variables. The scale is practical and explains the models well. Future studies may adopt the same way to apply an appropriate scale and enhance model accuracy.
Besides, this study adopts the attractiveness of alternative modes as a factor for repurchase intentions, and finds that this variable does indeed have a significant effect. Future studies could analyze the competitive advantages of different alternative vehicles, perhaps shedding some light on how these vehicles influence repurchase intentions.
Finally, achieving a greater understanding of passengers’ behavioral inten-tions requires replicating the proposed model using different public transportation systems. Although this study achieves encouraging results for the Taipei city bus service, further investigations are needed to verify and test the applicability of the proposed model to other cities or public trans-portation systems. The social classes and traveling types of passengers vary among public transportation systems. A replication of the proposed model could collect more information from different sample groups, passengers’ behavioral intentions.
322
Appendix A. The manifest variables of each latent variable
Latent variable Manifest variable
Repurchase V1 The possibility to ride again
Intention V2 The possibility to ride the same vehicle with the same costs
(RI) V3 The possibility to ride the same vehicle with the same ticket price
V4 The willingness to ride again
Perceived V5 The service offered is valuable.
Appendix A. (Continued)
Latent variable Manifest variable
(PV) V7 It is worthier to ride the bus than the other vehicles.
Perceived V8 The schedule and routes satisfy customers’ needs.
Benefits V9 Customers are served well.
(PB) V10 The service is better than expected.
Perceived Costs V11 The price is lower than expected. (reverse coding)
(PC) V12 Costs (time, money and psychic) are reasonable. (reverse coding)
V13 It is acceptable to pay the price. (reverse coding)
Service Quality V14 Interaction with passengers (6 questions)
(SQ) 01. Drivers appreciate the safety of passengers when they get on/
off the vehicle.
02. Drivers are polite and friendly to communicate with passengers.
03. Drivers drive smoothly, and his road craft is fine.
04. Drivers drive on right route and never fail to stop when
passengers want to get on.
05. The company deals with accidents quickly and reasonably.
06. The company deals with passengers’ opinions and complaints
sufficiently.
V15 Tangible Service Equipment (6 questions)
07. Companies provide safe and brand new vehicles.
08. Vehicles are clean inside.
09. Noise on the vehicle isn’t too loud.
10. The equipment in the vehicle satisfies passengers’ needs. 11. The air conditioning is very comfortable.
12. The stop’s layout is fine.
V16 Convenience of services (5 questions)
13. The places of stops or stations are proper and convenient. 14. The transshipping on the network is convenient.
15. The information about routes is marked clearly.
16. The company will have notification on the cars in short time when the routes and schedule are changed.
17. The company will correct the information at stops or stations in short time when the routes and schedule are changed.
V17 Operating Management support (3 questions)
18. I don’t have to worry that there is no bus. 19. It’s not good if I have to wait for a long time.
20. The company dispatches buses according to the schedule.
Perceived Non- V18 Search costs: convenience to reach stations
Monetary Price V19 Psychic costs: Time to wait for the arrival is appropriate.
(PNMP) V20 Time costs: The travel time is appropriate.
Perceived V21 The fare is too expensive to me. (Reverse Coded)
Monetary Price V22 The fare is unreasonable with this level of service. (Reverse Coded)
(PMP) V23 The fare is unacceptable. (Reverse Coded)
Attractiveness V24 If I need to change bus companies, there are other good bus
of Alternative companies to choose from.
Modes (AAM) V25 I would probably be happy with the services of another bus company.
V26 Compared to this bus company, there are other bus companies with
324
Appendix B. Corr
elation coefficient matrix
Mean 0 3.881 0 3.481 0 3.821 0 3.685 0 3.328 0 3.200 0 3.051 0 3.523 0 3.047 0 2.898 0 2.957 0 2.855 0 2.672 Std. 0 0.967 0 1.047 0 0.883 0 0.912 0 0.910 0 0.856 0 0.994 0 0.907 0 0.859 0 0.856 0 0.846 0 0.968 0 0.974 v1 0 1.000 v2 0 0.572 0 1.000 v3 0 0.621 0 0.597 0 1.000 v4 0 0.592 0 0.580 0 0.688 0 1.000 v5 0 0.365 0 0.336 0 0.371 0 0.434 0 1.000 v6 0 0.339 0 0.297 0 0.426 0 0.442 0 0.475 0 1.000 v7 0 0.442 0 0.580 0 0.521 0 0.428 0 0.373 0 0.425 0 1.000 v8 0 0.339 0 0.328 0 0.421 0 0.350 0 0.268 0 0.283 0 0.273 0 1.000 v9 0 0.352 0 0.403 0 0.445 0 0.515 0 0.451 0 0.505 0 0.368 0 0.533 0 1.000 v10 0 0.326 0 0.365 0 0.428 0 0.440 0 0.465 0 0.518 0 0.428 0 0.476 0 0.716 0 1.000 v11 –0.194 –0.305 –0.342 –0.305 –0.337 –0.307 –0.363 –0.310 –0.403 –0.395 0 1.000 v12 –0.398 –0.458 –0.470 –0.459 –0.422 –0.429 –0.485 –0.434 –0.465 –0.441 0 0.577 0 1.000 v13 –0.387 –0.432 –0.506 –0.482 –0.486 –0.541 –0.495 –0.410 –0.457 –0.440 0 0.522 0 0.807 0 1.000 v14 0 0.197 0 0.229 0 0.300 0 0.346 0 0.337 0 0.372 0 0.331 0 0.181 0 0.420 0 0.373 –0.246 –0.269 –0.275 v15 0 0.265 0 0.214 0 0.263 0 0.310 0 0.355 0 0.323 0 0.278 0 0.246 0 0.336 0 0.351 –0.212 –0.235 –0.239 v16 0 0.225 0 0.232 0 0.297 0 0.268 0 0.240 0 0.345 0 0.300 0 0.303 0 0.300 0 0.288 –0.255 –0.313 –0.307 v17 0 0.296 0 0.280 0 0.328 0 0.343 0 0.388 0 0.351 0 0.349 0 0.423 0 0.377 0 0.407 –0.279 –0.407 –0.376 v18 –0.130 –0.222 –0.155 –0.095 –0.251 –0.174 –0.138 –0.325 –0.154 –0.135 0 0.198 0 0.245 0 0.216 v19 –0.156 –0.259 –0.263 –0.228 –0.380 –0.252 –0.296 –0.447 –0.316 –0.328 0 0.307 0 0.440 0 0.426 v20 –0.283 –0.349 –0.289 –0.334 –0.250 –0.268 –0.345 –0.377 –0.391 –0.316 0 0.343 0 0.470 0 0.468 v21 –0.185 –0.140 –0.283 –0.244 –0.125 –0.274 –0.263 –0.271 –0.174 –0.178 0 0.336 0 0.427 0 0.434 v22 –0.186 –0.126 –0.279 –0.210 –0.170 –0.248 –0.216 –0.212 –0.147 –0.118 0 0.313 0 0.422 0 0.405 v23 –0.162 –0.184 –0.331 –0.247 –0.122 –0.217 –0.225 –0.292 –0.167 –0.195 0 0.297 0 0.420 0 0.450 v24 –0.185 –0.123 –0.146 –0.158 0 0.004 0 0.065 –0.276 0 0.121 0 0.050 0 0.119 –0.037 –0.093 –0.052 v25 –0.222 –0.292 –0.315 –0.318 –0.118 –0.157 –0.360 –0.133 –0.168 –0.095 0 0.188 0 0.312 0 0.274 v26 –0.253 –0.302 –0.234 –0.272 –0.111 –0.088 –0.335 –0.012 –0.111 –0.032 0 0.145 0 0.279 0 0.218 N = 235. –1.360 –1.323 –1.293 –1.838 2.187 2.843 2.817 2.583 2.443 2.264 3.911 3.379 0 3.566 0 0.742 0 0.830 0 0.851 0 1.152 0 0.942 0 1.061 0 1.032 0 0.899 0 0.943 0 0.861 0 1.088 0 1.045 0 0.999 0 1.000 00.559 0 1.000 0 0.559 0 0.592 0 1.000 0 0.432 0 0.534 0 0.556 0 1.000 –0.040 –0.097 –0.259 –0.239 0 1.000 –0.160 –0.286 –0.344 –0.580 0 0.406 0 1.000 –0.121 –0.187 –0.259 –0.252 0 0.167 0 0.430 0 1.000 –0.165 –0.080 –0.268 –0.228 0 0.123 0 0.218 0 0.323 0 1.000 –0.184 –0.081 –0.268 –0.190 0 0.123 0 0.198 0 0.268 0 0.844 0 1.000 –0.126 0 0.001 –0.176 –0.184 0 0.107 0 0.228 0 0.247 0 0.783 0 0.808 0 1.000 –0.024 –0.033 0 0.044 0 0.032 –0.096 –0.127 –0.007 –0.235 –0.165 –0.225 0 1.000 –0.199 –0.138 –0.127 –0.120 –0.020 0 0.189 0 0.271 0 0.164 0 0.137 0 0.131 0 0.150 0 1.000 –0.170 –0.171 –0.078 –0.034 –0.004 0 0.060 0 0.262 0 0.050 0 0.037 –0.010 0 0.412 0 0.539 0 1.000
Acknowledgements
The authors would like to thank the National Science Council of the Republic of China in Taiwan for financially supporting this research (under Contract No. NSC89-2416-H-009-032). We are also thankful to the anonymous Transporta-tion reviewers for providing very useful comments and guidance.
References
Anderson JC & Gerbing DW (1988) Structural equation modeling in practice: a review and recommended two-step approach. Psychological Bulletin 103(3): 411–423.
Babakus E & Boller GW (1992) An empirical assessment of the SERVQUAL scale. Journal
of Business Research 24(3): 253–268.
Ben-Akiva M & Morikawa T (1990) Estimation of switching models from revealed prefer-ences and stated intentions. Transportation Research 24A:485–495.
Bojanic DC (1996) Consumer perceptions of price, value and satisfaction in the hotel industry: an exploratory study. Journal of Hospitality and Leisure Marketing 4(1): 5–22.
Bolton RN & Drew JH (1991) A multistage model of customers’ assessments of service quality.
Journal of Consumer Research 17(4): 375–384.
Brady MK, Robertson CJ & Cronin JJ (2001) Managing behavioral in diverse cultural envi-ronments: an investigation of service quality, service value, and satisfaction for American and Ecuadorian fast-food customers. Journal of International Management 7: 129–149. Brown TJ, Churchill Jr GA & Peter JP (1993) Research note: improving the measurement of
service quality. Journal of Retailing 69(1): 127–139.
Carman JM (1990) Consumer perceptions of service quality: an assessment of the SERVQUAL dimensions. Journal of Retailing 66(1): 33–55.
Chapman J & Wahlers R (1999) A revision and empirical test of the extended price-perceived quality model. Journal of Marketing Theory and Practice 7(3): 53–61.
Cornin Jr JJ & Taylor SA (1992) Measuring service quality: a reexamination and extension.
Journal of Marketing 56(3): 56–68.
Cornin Jr JJ, Brady MK & Hult GTM (2000) Assessing the effects of quality, value and customer satisfaction on consumer behavioral intentions in service environments. Journal of Retailing 76(2): 193–218.
Davies F, Goode M, Mazanec J & Moutinho L (1999) LISREL and neural network modeling: two comparison studies. Journal of Retailing and Consumer Services 6(4): 249–261. Desatnick RL & Detzel DH (1993) Managing to Keep the Customer: How to Achieve and
Maintain Superior Customer Service Throughout the Organization. Revised edition: San
Francisco Jossey-Bass.
Dickson PR & Sawyer AG (1990) The price knowledge and search of supermarket shoppers.
Journal of Marketing 54(3): 42–53.
Dodds WB & Mornoe KB (1985) The effect of brand and price information on subjective product evaluations. Advances in Consumer Research 12: 85–90.
Dodds WB, Mornoe KB & Grewal D (1991) Effects of price, brand and store information on buyers’ product evaluations. Journal of Marketing Research 28(3): 307–319.
ECMT (1999) Regular interurban coach services in Europe: Report of The 114th Round Table on Transport Economics. Paris: OECD.
Finn DW & Lamb CW (1991) An evaluation of the SERVQUAL scales in A retailing setting.
Fredericks JO & Salter JM (1995) Beyond customer satisfaction. Management Review 84(5): 29–32.
Fornell C & Larcker DF (1981) Evaluating structural equation modles with unobservable vari-ables and measurement error. Journal of Marketing Research 18(1): 39–50.
Hatcher L (1998) A Step-by-Step Approach to Using the SAS System for Factor Analysis and
Structural Equation Modeling 3rd. SAS Institute Inc.
Hensher DA (1994) Stated preference analysis of travel choices: the state of practice.
Transportation 21: 107–133.
Heskett JL, Sasser WE & Hart CWL (1990) Service Breakthroughs: Changing the Rules of the
Game. New York.
Heskett JL, Jones TO, Loveman GW, Sasser WE & Schlesinger LA (1994) Putting the service-profit chain to work. Harvard Business Review 72(2): 164–174.
Hoyle RH (1995) Structural Equation Modeling: Concepts, Issues, and Applications. Newbury Park: Stage.
James LR, Mulaik SA & Brett JM (1982) Causal Analysis. Beverly Hills: Sage.
Jen W & Hu KC (2001) Development and assessment of a service quality for mass transit – take Taipei Bus for an example. Transportation Planning Journal Quarterly 30(2): 371–408. Jones MA, Mothersbaugh DL & Beatty SE (2000) Switching barriers and repurchase
inten-tions in services. Journal of Retailing 76(2): 259–274.
Joreskog KG & Sorbom D (1993) LISREL8: User’s Reference Guide. Chicago, IL: Scientific Software International.
Joreskog KG & Sorbom D (1989) LISREL 7: A Guide to the Program and Applications 2nd. Chicago: SPSS Inc.
Koppelman FS & Wen CH (1998) Alternative nested logit models: structure, properties and estimation. Transportation Research 32B(5): 289–298.
Kuppam AR & Pendyala RM (2001) A structural equations analysis of commuters’ activity and travel patterns. Transportation 28(1): 33–54.
Lee M & Cunningham LF (1996) Customer loyalty in the airline industry. Transportation
Quarterly 50(2): 57–72.
Lovelock CH (2000) Services Marketing 4ed. Prentice Hall International.
Mornoe KB & Chapman JD (1987) Framing effects on buyers’ subjective evaluations. Advances
in Consumer Research 14: 193–197.
Murphy PE & Enis BM (1986) Classifying products strategically. Journal of Marketing 50(3): 24–42.
Oh M (1999) Service quality, customer satisfaction, and customer value: a holistic perspective.
International Journal of Hospitality Management 18(1): 67–82.
Ortuzar JdeD & Iacobelli A (1998) Mixed modeling of interurban trips by coach and train,
Transportation Research 32A(5): 345–357.
Parasuraman A, Zeithaml VA & Berry LL (1985) A conceptual model of service quality and its implications for future research. Journal of Marketing 49(4): 41–50.
Parasuraman A, Zeithaml VA & Berry LL (1988) SERVQUAL: a multiple-item scale for measuring consumer perceptions of service quality. Journal of Retailing 64(1): 12–40. Parasuraman A (1997) Reflections on going competitive advantage through customer value.
Journal of The Academy of Marketing Science 25(2): 154–161.
Ping RA (1993) The effects of satisfaction and structural constraints on retailer exiting, voice, loyalty, opportunism, and neglect. Journal of Retailing 69(3): 320–352.
Ravald A & Gronroos C (1996) The value concept and relationship marketing. European Journal
of Marketing 30(2): 19–30.
Rusbult CE (1980) Commitment and satisfaction in romantic associations: a test of the invest-ment model. Journal of Experiinvest-mental Social Psychology 16: 172–186.
Rys ME, Fredericks JO & Luery DA (1987) Value=Quality? Are service value and service quality 326
synonymous: a decompositional approach. In: Add Value to Your Service (pp. 25–28). Carol Supernat, American Marketing Association.
SAS Institute Inc. (1989) SAS/STAT users guide 4ed. Cary, NC: SAS Institute Inc.
Salter SF (1997) Developing a customer valued-based theory of the firm. Journal of The Academy
of Marketing Science 25(2): 162–167.
Sirohi N, Mclaughlin EW & Wittink DR (1998) A model of consumer perceptions and store loyalty intentions for a supermarket retailer. Journal of Retailing 74(2): 223–245.
Swait J & Sweeney JC (2000) Perceived value and its impact on choice behavior in a retail setting.
Journal of Retailing and Consumer Services 7: 77–88.
Sweeney JC, Soutar GN & Johnson LW (1997) Retail service quality and perceived value: a comparison of two models. Journal of Retailing and Consumer Service 4(1): 39–48. Sweeney JC, Soutar, GN & Johnson LW (1999) The role of perceived risk in the quality-value
relationship: a study in a retail environment. Journal of Retailing 75(1): 77–105.
Teas RK & Agarwal S (1997) Quality cues and perceptions of value: an examination of the mediation effects of quality and sacrifice perceptions. Iowa State University Working Paper #37.6: Iowa State University.
Treacy M & Wiersema F (1993) Customer intimacy and other value disciplines. Harvard Business
Review 71(1): 84–93.
Triplet JL, Yau OHM & Neal C (1994) Assessing the reliability and validity of SERVQUAL in a longitudinal study: the experience of an Australian organization. Asia Pacific Journal
of Marketing & Logistics 6(1,2): 41–62.
Zeithaml VA (1988) Consumer perceptions of price, quality and value: a means-end model and synthesis of evidence. Journal of Marketing 52: 2–22.
About the authors
William Jen is an associate professor at Department of Transportation Technology and
Management, Chiao-Tung University, Taiwan, where he teaches and conducts research in transportation management. His current research interests include transportation management, service management, strategic management, and performance measure-ment.
Kai-Chieh Hu is a PhD Candidate at Department of Transportation Technology and
Management, Chiao-Tung University, Taiwan. His research subjects include trans-portation marketing, consumer behavioral intentions, and advanced statistical analysis methods.