國立臺灣大學生物資源暨農學院森林環境暨資源學系 (所)
碩士論文
School of Forestry and Resource Conservation College of Bio-Resources and Agriculture
National Taiwan University master thesis
噴墨列印所需之纖維素奈米微晶的膠體性質與尺寸特 性探討
Colloidal and Dimensional Properties of Cellulose Nanocrystals for Applications in Inkjet Printing
林冠萱 Kuan-Hsuan Lin
指導教授﹕張豐丞 博士、江前 敏晴 博士 Advisor: Dr. Feng-Cheng Chang, Dr. Toshiharu Enomae
中華民國 106 年 8 月 August 2017
Colloidal and Dimensional Properties of Cellulose Nanocrystals for Applications in
Inkjet Printing
A Dissertation Submitted to
Graduate School of Life and Environmental Sciences, University of Tsukuba
in Partial Fulfillment of the Requirements for the Degree of Master of Bioresource Engineering
(Master’s Program in Agro-Bioresources Science and Technology)
Kuan-Hsuan LIN
Acknowledgement
This thesis is a compilation of studies carried out from 2015 September to 2017 June under the supervision of Prof. Feng-Cheng Chang and Prof. Toshiharu Enomae at National Taiwan University and University of Tsukuba. I would like to express my deepest respect and gratitude to my advisors for their guidance, supports and continuous encouragements throughout this study. I would like to thank those who created the Double-Degree Master Program as well for providing me such a precious experience studying in Taiwan and Japan.
I would like to thank the Industry Technology Research Institute for the financial support and materials supplied, as well as Prof. Shang-Tzen Chang and his research group form National Taiwan University for the technical assistance for experiments.
Also, I would like to thank Prof. Motoyoshi Kobayashi and Mr. Takuya Sugimoto from University of Tsukuba for teaching me and helping me in colloidal properties analysis and giving me valuable suggestions. Furthermore, I want to give sincere gratitude also to Prof. Akiko Nakagawa and Prof. Chun-Han Ko for fruitful discussion.
Then, I would like to thank my laboratory members from National Taiwan University and University of Tsukuba for suggestions and encouragements. In addition, I thank my friends for accompanying me overcoming the challenges.
Last, I thank my family for their devoted support and encouragements.
Kuan-Hsuan Lin
摘要
纖維素為地表蘊藏量最為豐富的可再生、生物可降解資源。而將纖維素微纖 維中的結晶區萃取而出,則可以得纖維素奈米微晶。本研究關注以噴墨列印法將 纖維素奈米微晶應用於可設計規則性排列之商品,所需探討的纖維素奈米微晶水 溶液的相關性質。本研究以纖維素奈米微晶之製程著手:試驗不同的製備條件、
尋找最適者。成功於特定條件下製備尺寸落在奈米維度,近似於商用纖維素奈米 微晶的產品。亦發現產品顏色會隨處理溫度與處理時間的拉長而轉深,並於熱分 析中得到較多殘餘,應是較強的水解條件會帶給纖維素奈米微晶更多硫酸基所造 成。其次為纖維素奈米微晶溶液之膠體性質探討,並與理論模型比對。模型比對 可以證實商用的及自製纖維素奈米微晶的表面有酸水解造成之強負電荷,並其棒 狀型態與硫酸基造成之表面化學特性亦須納入考量。此外,也探討其黏度性質。
除剪切稀釋特性需考慮外,以黏度結果與噴墨印表機之墨水要求進行比對與篩選,
進行噴墨列印測試。結果顯示纖維素奈米微晶墨水於紙材上乾燥時,會形成內縮 力,進而導致紙材表面塗層的破壞與紙張彎曲。因此,若不希望產品具有設計之 外的彎曲,有好塗層的紙材較適合做為纖維素奈米微晶墨水之噴墨基材。
關鍵字:纖維素奈米微晶、膠體性質、噴墨列印
Abstract
Cellulose is the most abundant of renewable and biodegradable polymer on Earth.
Cellulose nanocrystals, in short, CNCs, are the crystalline region of cellulosic chains on nanoscale. As to a new application of CNCs to inkjet printing for patterning type products, exploring properties of CNC suspensions would be necessary. Thus, a CNC preparation test was conducted and provided an optimal acid hydrolysis condition. The resulting CNCs exhibited nanoscale dimensions, and a crystallinity index similar to the commercial one. A gradient of color changes of CNCs was found with an increasing hydrolysis duration and hydrolysis temperature. Introduction of sulfate groups was assumed by sulfuric acid hydrolysis. Strong conditions are supposed to introduce more sulfate groups on CNCs, which may act as flame retardants and thus increase the amount of char residue. Colloidal properties of CNCs obtained via sulfuric acid hydrolysis were investigated. A strong negative surface charge caused by sulfuric acid hydrolysis was confirmed by fitting the data spots to theoretical equations; in addition, a cylindrical shape and a high-charged surface morphology caused by sulfate groups of CNCs were suggested. Results from viscosity measurements showed obvious shear thinning phenomena of CNC suspensions at high concentrations. A specific concentration of CNC which were suitable for inkjet use in terms of the viscosity requirements of inkjet printers was applied in printing tests. Finally, a paper substrate with a mechanically strong surface coating is suggested to be applied for prevention from destruction due to shrinkage force.
Keywords: Cellulose nanocrystals, Colloidal properties, Inkjet printing
Content
Acknowledgement ... I 摘要 ... I
Abstract ... II Content ... I
1. Introduction ... 1
2. Cellulose nanocrystals preparation ... 3
2.1 Literature review: Cellulose nanocrystals preparation ... 5
2.2 Experimental ... 7
2.2.1 Materials and methods ... 8
2.2.1.1 CNC preparation: Sample “F” ... 8
2.2.1.2 CNC preparation: Sample “P” ... 8
2.2.1.3 Information about dimensions ... 10
2.2.1.4 Crystallinity index ... 11
2.2.1.5 Surface morphology ... 12
2.2.1.6 Thermal degradation temperature ... 12
2.3 Results and discussion ... 12
2.3.1 Assumed sulfate groups on the surface of CNCs... 12
2.3.2 Outward appearance... 14
2.3.3 Dimension studies ... 16
2.3.4 Crystalline index ... 19
2.3.5 Surface morphology ... 20
2.3.6 Thermal degradation temperature ... 21
2.4 Summary of CNC preparation task ... 24
3. Properties of cellulose nanocrystals suspensions ... 26
3.1 Literature review: Colloidal properties ... 26
3.2 Theories ... 28
3.2.1 Methods of calculating zeta potential (ζ) and electrophoretic mobility (EPM) 28 3.2.2 Theories to link electrophoretic mobility with zeta potentials ... 30
3.3 Experimental ... 32
3.3.1 Sample preparation for colloidal properties measurements ... 32
3.3.2 Zeta potential and electrophoretic mobility measurements ... 32
3.3.3 Size distribution ... 33
3.3.4 Viscosity ... 33
3.4 Results and discussion ... 34
3.4.1 Size distribution of CNCs ... 34
3.4.2 Charging properties of CNCs ... 36
3.4.3 Theories comparisons of CNC suspensions ... 36
3.4.4 Viscosity of CNC suspensions ... 38
3.5 Summary of properties of cellulose nanocrystals suspensions ... 40
4. Printing test ... 42
4.1 Experimental section ... 42
4.2 Results and discussion ... 44
5. Comprehensive conclusion ... 46
Reference ... 47
Figures
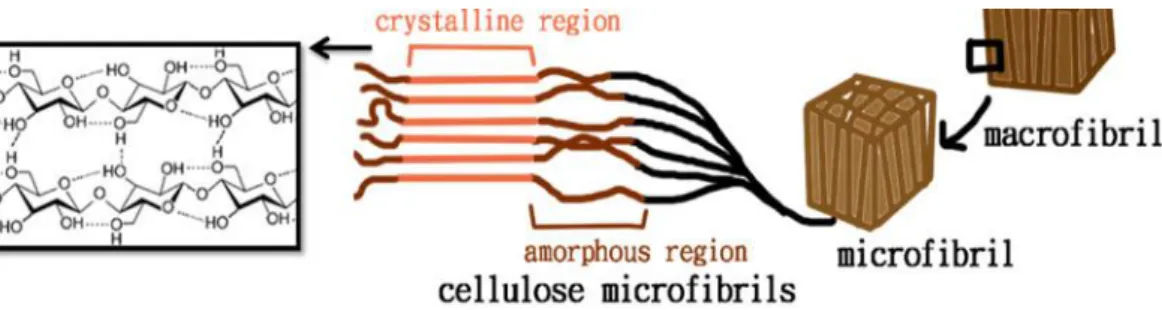
Figure 1 The scheme of the crystalline region in a lignocellulose material ... 3
Figure 2 The numbering system of an anhydroglucose unit of cellulose ... 4
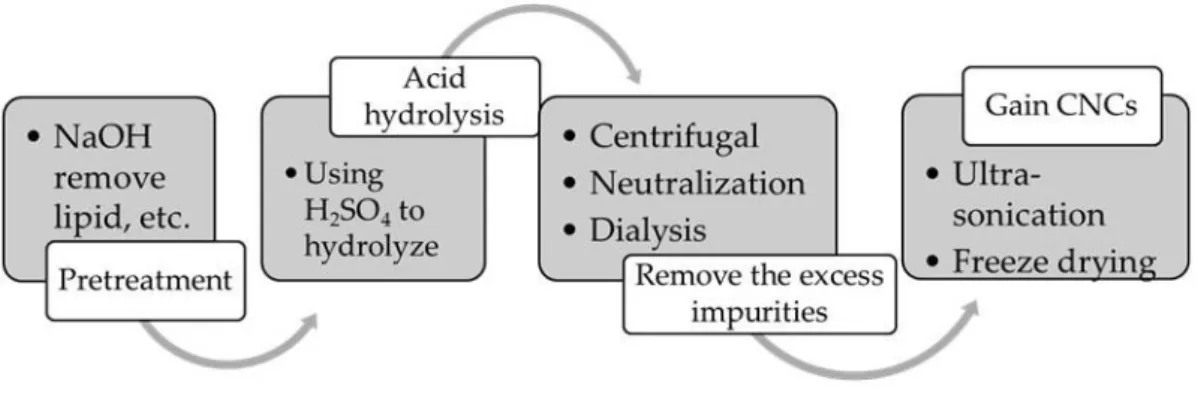
Figure 3 Manufacturing procedure of CNCs ... 9
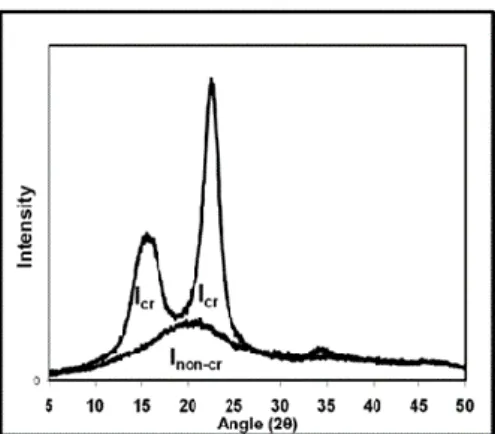
Figure 4 XRD spectrum of a cellulose I sample, for Ruland-Vonk X-ray diffraction method... 11
Figure 5 Schematic diagram of a sulfate group attached on C6 (Dong and Gray 1997) ... 13
Figure 6 The CNC aqueous suspension after a treatment of homogenizer ... 13
Figure 7 The CNC aqueous suspension became gel-like after adding some divalent ions ... 14
Figure 8 A gradient of color changes with an increasing hydrolysis temperature ... 15
Figure 9 A gradient of color changes with an increasing hydrolysis duration ... 15
Figure 10 TEM micrographs of samples (a) C and (b) F ... 16
Figure 11 Length distribution of samples C and F ... 17
Figure 12 Sample “200P”, prepared at 65°C by 63% (w/w) sulfuric acid hydrolysis for 2 h ... 18
Figure 13 Cr.I. of CNC preparation test (P) ... 20
Figure 14 FT-IR spectrum of “SA6345-2PN” ... 21
Figure 15 FT-IR spectrum of CNCs from reference: Khan et al. 2012 ... 21
Figure 16 The TGA diagram of 200P prepared at 45°C by 63% sulfuric acid hydrolysis for 2 h ... 22
Figure 17 The series of 63% sulfuric acid hydrolysis (P) ... 23
Figure 18 TGA diagram of “SA6345-2PN” ... 23
Figure 19 Thermal degradation temperature of CNC preparation task (P) ... 24
Figure 20 Relationship between salt concentration and intensity-weighted
hydrodynamic diameter ... 35
Figure 21 Size distribution of suspended CNCs at various salt concentrations for sample C... 35
Figure 22 Relationship between electrolyte concentrations and ζ of sample C at various pH values ... 36
Figure 23 Fitting of theoretical equations ... 38
Figure 24 Relationship between viscosity and shear rate of CNCs at 0.1% (w/w) for sample C. Numerical values for symbols denote NaCl concentration in mM ... 39
Figure 25 Relationship between viscosity and shear rate of CNCs at 0.1% (w/w) for sample F. ... 39
Figure 26 Influence of CNC concentration (sample C) on suspension viscosity ... 40
Figure 27 Printing papers: Epson KA450PM (a) and Epson KA4100PGP (b) ... 43
Figure 28 Single cartridge system printer (Dimatix DMP-2831 Fujifilm) ... 43
Figure 29 Scheme of pipette dropping ... 44
Figure 30 CNC/KA100PGP: A CNC spot on the paper substrate “KA100PGP”... 45
Figure 31 CNC/ KA450PM: A CNC spot on the paper substrate “KA450PM” ... 45
Tables
Table 1 Hydrolysis conditions and sample names ... 10 Table 2 Dimensional data of CNC preparation (P) ... 19 Table 3 Results of hydrodynamic size measured by TEM and DLS ... 34
1. Introduction
Cellulose is one of sustainable bio-resources and of enormous affluence in nature.
Due to its unique characteristics, cellulosic materials have recently gained highly global attention in the material science field, particularly in exploring and applying for industrial use. Cellulose is a polymer which consists of β-1, 4 linked D-glucose. Due to hydroxyl groups, cellulose chains are arranged in highly ordered structure called crystalline region;
whereas the disordered structure is called amorphous region. With the nanometric size effect, the crystalline regions, extracted to be cellulose nanocrystals (CNCs), have recently been studied in developing biocomposites (Bondeson et al. 2006). When designing a CNC composite, CNCs have potentials to be applied as a functional reinforcement because they provide unique thermal, mechanical, optical and gas-barrier properties due to their highly-ordered nanostructure (Sehaqui et al. 2010).
As to applications of CNC composites, the efficacy of composition is affected by the dispersion of CNCs in a matrix and the compatibility between them. Functional groups grafting is the most common strategy to achieve the purpose (Lin et al. 2012). A suitable functional group can be freely designed, and then be introduced on to the surface of CNCs through several ways. In addition, the design of CNC surface morphology would also be considered with the strategy to produce CNC composites. For example, CNC composites tend to be fabricated layer-by-layer when applying impregnating and coating methods, having a potential to be a 2-dimensional homogeneous structure. In addition, CNC-matrix mixture can be prepared by molding or casting, being designed as a 3-dimensional homogeneous structure. Also, CNC composite sheets can be produced by introducing CNC composite fibers in weaving or electrospinning. Then, printing is appreciated to achieve a purpose to produce CNC composites in a patterned type by preparing CNC
composites as inks. A wet environment is suitable for the manufacturing methods mentioned above, and then produce solid products by evaporating the extra moisture (Dufresne 2013a). An aqueous system is thus preferred because of the prevention of emitting volatile organic compound. On the other hand, an optimal surface morphology and strategy to manufacture CNC composites should be further considered for manufacturing methods and application purposes.
In this study, inkjet printing technology was chosen considering its industrial advantages and a potential to prepare patterned type products. Inkjet printing has been developed for a long time. That means the equipment and principles are well-developed and widely used, decreasing the cost and obstacles while manufacturing. Thus, by applying inkjet printing technology, CNC trials can be freely designed. Further, a paper- based electronic device has potentials to be manufactured with designed patterns by printing conductive CNC ink.
In the following parts, a general introduction of “cellulose nanocrystals, CNCs” was illustrated before the detail of the first experiment “CNC preparation”. Then, samples with good quality were chosen and their colloidal properties were investigated. Finally, certain conditions of CNC suspensions were tried in printing test, evaluating the potential for applying inkjet printing technology in conductive CNC ink.
2. Cellulose nanocrystals preparation
As a sustainable and natural material, cellulose has been considered to be applied as functional reinforcements to develop biocomposite materials. Hydroxyl groups at C2, C3, and C6 positions provide intra- and inter-molecular hydrogen bonds, arranging cellulose chains in highly ordered structure in regions of cellulose microfibrils so called crystalline regions, and in disordered structure called amorphous regions. Cellulose does not melt or dissolve in common solvent owing to hydrogen bonds between cellulose chains (Dufresne 2013b). CNCs are extracted from the crystalline region of cellulose microfibrils (Figure 1).
Figure 1 The scheme of the crystalline region in a lignocellulose material
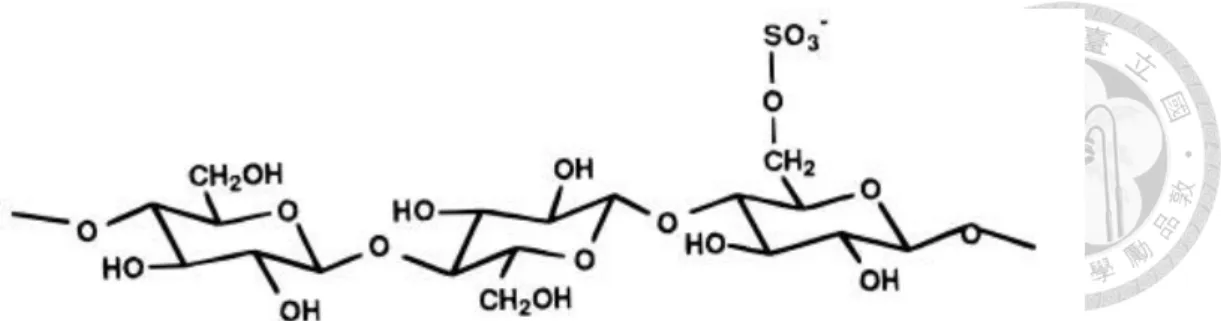
Due to the steric effect, the hydroxyl groups on cellulose chains exhibit different reactivity. When the carbon atoms are named by the numbering system (Figure 2), the locations of hydroxyl groups are determined in an anhydroglucose unit of cellulose. As to the hydroxyl group at the 6 position (C6 position), it acts as a primary alcohol with only one attached alkyl group; whereas the hydroxyl groups in 2 and 3 position (C2 and C3 positions) act as secondary alcohols with 2 joined alkyl groups. Thus, from previous studies about esterification, a reactivity 10 times faster than hydroxyl groups in 2 and 3 position was found at the hydroxyl group in the 6 position (Dufresne 2013b).
Figure 2 The numbering system of an anhydroglucose unit of cellulose (Dufresne 2013b)
The hydroxyl groups on the surface of cellulose can react with various chemicals, becoming derivatives with designed functions. However, the extraction procedure of CNC plays a primary role in modifying the surface chemistry of the particles. To produce proper CNCs for further usage in composites, several properties are required to be analyzed for engineering process design due to different features between extracting routes, which will be explained in the following paragraphs.
Regarding cellulose sources of CNCs, wood (Hubbe et al. 2008), agriculture wastes (Hubbe et al. 2008; Moran et al. 2008), and bacterial cellulose (Yano 2005;
Hubbe et al. 2008) have been studied as raw materials of CNCs.
The outward appearance, dimensions, elastic moduli, crystallinity, degree of polymerization, and other fundamental structures are influenced by the raw materials (Habibi et al. 2010; Klemm et al. 2011; Lin et al. 2012; Stokke et al. 2014). In addition, through different isolation treatments, CNCs exhibit different surface functional groups and preparation effectiveness. To produce CNCs with the same surface property as their raw materials, mechanical methods are the most suitable routes (Amin et al. 2015). For obtaining CNCs with less corrosion and toxicity, enzymatic hydrolysis is an optimal way to be chosen (Siqueira 2010). Chemical hydrolysis, especially acid hydrolysis, is an optimal way to produce high-purity CNCs (Bondeson et al. 2006; Espinosa et al.
2013; Pan et al. 2013; Chen et al. 2015)
In this series of studies, the related previous researches were reviewed, including the three main routes to produce CNCs and analysis of the properties. Filter papers and dry pulps were the two raw materials studied in this research. The resulted properties were compared with commercially available CNC.
2.1 Literature review: Cellulose nanocrystals preparation
As mentioned before, there are three main routes for CNC preparation: mechanical method, enzymatic hydrolysis, and chemical hydrolysis. Details of these methods would be explained in the following part.
Mechanical methods are often used to produce CNCs directly or as the pretreatment of acid hydrolysis and enzyme hydrolysis, including ultrasonication, micro-fluidization, high-pressure homogenization, and ball milling. These methods introduce no additive functional group on CNCs, showing low energy and time consumptions and limiting chemical solvent requirement (Amin et al. 2015).
CNCs isolated by mechanical methods remain the same surface property as their raw materials. Besides, they are spindle-like particle with average aspect ratios ranging between 20 and 26, the high degree of crystallinity which is around 85%. Furthermore, they also exhibit good thermal stability, whose degradation temperatures are around 250°C (Amin et al. 2015).
An alternative way to produce CNCs at low utility cost is enzymatic hydrolysis.
This method shows highly substrate specific; moreover, comparing with acid hydrolysis, it exhibits the advantage to reduce corrosion and toxicity. Based on the different functional purpose, there are three types of cellulose enzymes which involve endo and exoglucanase and β-glucosidases. Endoglucanase (E.C. 3.2.1.4) hydrolyze the low
crystallinity regions and the amorphous regions of the cellulose fiber. Exoglucanase (E.C. 3.2.1.91) release cellobiose units from the free chain ends. β-glucosidases (E.C.
3.2.1.21) hydrolyze cellobiose units to glucose (Siqueira 2010).
After enzymatic treatment outputs CNC products with c.a. 500 nm in length and aspect ratio c.a. 40, which will be appropriate to be named as microfibrillated cellulose, MFC, are obtained. MFC can further be used to prepare CNCs with low cost (Siqueira 2010).
The last is chemical hydrolysis, especially acid hydrolysis, which is a well-known process to produce high-purity CNCs efficiently. Researchers gain individualized CNCs via sulfuric, phosphoric, hydrochloric, or hydrobromic acid hydrolysis (Bondeson et al. 2006). After acid treatments, various functional groups were introduced to CNCs, letting the CNCs products have different surface properties which can be suitable in various applications (Bondeson et al. 2006; Espinosa et al. 2013; Pan et al. 2013; Chen et al. 2015).
The most common chemical used in hydrolysis is sulfuric acid hydrolysis. With negatively charged surface sulfate groups introduced by sulfuric acid treatment, CNCs display the electrostatic stabilization in aqueous media and promote a tendency to disperse homogeneously. However, protonated acid-form CNCs (H-CNCs) freeze- dried powder obtained directly after acid hydrolysis followed by dialysis are not dispersible in water because intermolecular hydrogen bonds between CNCs in dried H- CNCs are stronger and more than those in dried salt-form CNCs. Thus, comparing with H-CNC, salt-form CNCs display homogeneous colloidal dispersions and easily be swelled (Beck et al. 2012).
Unfortunately, there is another problem with the sulfate groups on the resultant
products. The residual sulfate groups make CNCs show a negative influence on their thermal stability; also, they will bring about the degradation of CNCs. To deal with the problem, researchers often use dialysis to remove sulfate groups, and they can modify the surface properties of CNCs, such as replacing the surface functional groups with another one. For example, carboxyl groups can be introduced onto the surface through (2,2,6,6-tetramethylpiperidin-1-yl)oxyl, TEMPO, oxidation, and make CNC particles more stable, improving the dispensability in water, having low oxygen permeability, low thermal expansion coefficients, and high optical transmittances (Habibi et al. 2006;
Fukuzumi 2011; Lagerwall et al. 2014).
2.2 Experimental
For realizing the relationship between conditions of the manufacturing process and resulting properties, several measurements are taken to analysis. Also, different raw materials, filter papers and dry pulps, were chosen for preparation tests. Therefore, the suitable parameter and condition can be selected for the proper usage in composite engineering. In this study, several techniques, such as transmission electron microscopy, wide-angle X-Ray Diffraction, etc., were applied for the evaluation of the morphology, dimension, surface morphology, crystallinity index, and thermal stability. Also, properties of a commercially-available CNCs (named as “C”) provided by University of Maine was analyzed and set as the reference for comparison with laboratory-made CNCs. At the final, a test for assumed sulfate groups on the surface of CNCs was conducted.
2.2.1 Materials and methods
2.2.1.1 CNC preparation: Sample “F”
Sulfuric acid hydrolysis was chosen to isolate CNCs from filter paper. Pre- shredded Whatman #1 filter paper was hydrolyzed with 63% (w/w) sulfuric acid (H2SO4) solution at 45°C for 2 h. Following hydrolysis, a large volume of distilled water was added to stop the reaction. Then, the slurry was transferred to falcon tubes with fresh distilled water. To obtain CNCs with no impurity from the process, the slurry was centrifuged at 5,000 rpm for 10 minutes with repetition at least three times.
Afterward, to prepare salt-form CNCs for a higher redispersibility than CNCs obtained directly after sulfuric acid hydrolysis (H-CNCs), a conductometric titration was driven out (Beck et al.2012). A CNC suspension was titrated with a 10% (w/w) sodium hydroxide (NaOH) solution for the purpose of water re-dispensability. Dialysis membranes having a molecular weight cutoff of 12,000-14,000 (Membrane Filtration Products Inc.) was applied to remove extra ions. Finally, CNC powders were obtained by freeze drying (Kingmech Co. Ltd.) after an ultra-sonicating bath for 20 minutes (Crest Ultrasonics Corporation).
2.2.1.2 CNC preparation: Sample “P”
Dry pulp, provided by Chung Hwa Pulp Corporation, was a mixture of Eucalyptus (Eucalyptus spp.) and other hardwood (Bixa spp.). The chemical composition of the dry pulp was cellulose (85-89%), hemicellulose (8-10%) and slight impurities such as lignin (<1%), ash (<0.5%) and lipid (<0.5%). A dry pulp board was mechanically treated into two sizes: fibers with a length around 200 nm, and strips with c.a. 3 cm in length and 1 cm in width. NaOH with the concentration of 3% (w/w) was chosen for
pretreatment, and which with the concentration of 10% (w/w) was applied for neutralization after acid hydrolysis. H2SO4 (95-98%, w/w) was purchased from Scharlau and prepared into various concentrations for hydrolysis. Water used for this purpose was distillation-distillation water (DD water).
The dry pulp was first cut into strips; then the following steps are shown in Figure 3. In the beginning, strips of pulp (5 g) were treated by 3% (w/w) NaOH at 50°C for 2 h, removing fatty acids, residual lignin, hemicellulose, resin, and other impurities. At the same time, the amorphous region also swelled so that it would improve the effectiveness of acid hydrolysis later.
Figure 3 Manufacturing procedure of CNCs
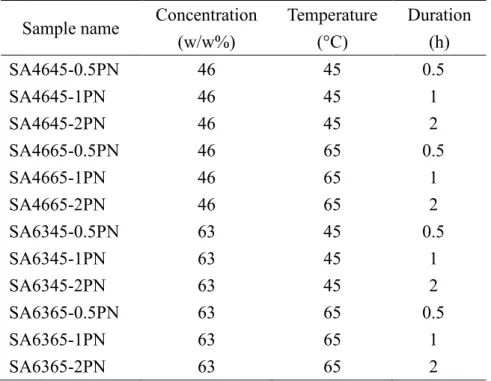
Afterwards, they were filtered and hydrolysis with several conditions which sulfuric acid concentration, hydrolysis temperature and duration were varied in ranges between 46–63% (w/w), 45–75°C, and 0.5–2 h, as shown in Table 1. With a 1:20 ratio (g/mL) for dry weight of pulp to the acid solution, CNCs were obtained after acid hydrolysis. Following hydrolysis, 300 mL DD water was added to stop the reaction.
The suspension was transferred to a 50 mL falcon tube, washed with DD water, and then treated with centrifuge at 5,000 rpm for 10 minutes at least three times.
A conductometric titration was also processed by using 10 percent (w/w) NaOH
to neutralize CNC suspensions before dialyzing against water through membranes with a molecular weight cutoff of 12,000–14,000 (Membrane Filtration Products Inc.).
Finally, CNC powders were obtained by freeze drying (Kingmech Co. Ltd.) after an ultra-sonicating bath for 20 minutes (Crest Ultrasonics Corporation).
Table 1 Hydrolysis conditions and sample names
Sample name Concentration (w/w%)
Temperature (°C)
Duration (h)
SA4645-0.5PN 46 45 0.5
SA4645-1PN 46 45 1
SA4645-2PN 46 45 2
SA4665-0.5PN 46 65 0.5
SA4665-1PN 46 65 1
SA4665-2PN 46 65 2
SA6345-0.5PN 63 45 0.5
SA6345-1PN 63 45 1
SA6345-2PN 63 45 2
SA6365-0.5PN 63 65 0.5
SA6365-1PN 63 65 1
SA6365-2PN 63 65 2
Thus, an apparent interaction between concentrations of sulfuric acid, hydrolysis temperature and duration was observed. Later, several properties, such as the dimension, surface morphology, crystallinity index and thermal stability, were measured to evaluate the relationship between the conditions of the manufacturing process and resulting properties.
2.2.1.3 Information about dimensions
CNC suspensions at 0.1% (w/w) were dropped on 20 mesh carbon-coated transmission electronic microscopy (TEM) copper grids. The samples were observed using the TEM (JEOL, JEM-1200 EXII and H7650, Hitachi) at 60 kV. Dimensions of at least 30 particles were analyzed using ImageJ (https://imagej.nih.gov/ij/index.html).
Only individual particles with clear edges were measured, and the width in the center of each particle was determined as the diameter. On the other hand, a zetasizer (Malvern, Nano S90) was applied for measuring the hydrodynamic size distribution, observing the dispersion status of CNC suspensions.
2.2.1.4 Crystallinity index
As for the structure of crystalline regions, wide-angle X-ray diffraction (WAXD;
X'Pert Pro Panalytical, X-ray diffractometer) was used to evaluate the crystallinity index (Cr.I.) of CNCs. A method called Ruland-Vonk X-ray diffraction method (Terinte et al. 2011), which is similar to “amorphous subtraction method” in several studies (Park et al. 2010), was applied to calculate Cr.I. by the ratio of the area of crystalline phase and the total area, including the non-crystalline region, as shown in Figure 4 and Equation1. In the equation of Cr.I. calculation (Equation 1), ICr is the integrated intensity of the crystalline phase, and Inon-Cr is the integrated intensity of the non- crystalline background.
Figure 4 XRD spectrum of a cellulose I sample, for Ruland-Vonk X-ray diffraction method (Terinte et al. 2011)
)
% ( 100 .(%)
.
Cr non Cr
Cr
I I I I
Cr (1)
2.2.1.5 Surface morphology
Surface functional groups of the CNC powder were detected by a diffuse reflectance infrared Fourier transform spectroscopy (BIO-RAD FTS-40), within the spectral region of 400–4000 cm-1. The Fourier-transform infrared (FT-IR) spectrum was scanned after water vapor and carbon dioxide were balanced.
2.2.1.6 Thermal degradation temperature
For further usage degradation temperature is an important index for making processing design for CNC composites. Thus, the information should be kept in mind through the composite material selecting and engineering process designing for the proper manufacturing method. The thermal gravimetric analyzer (TGA; METTLER TGA/SDTA 851) was applied to observe the degradation behavior of CNCs while heating. A degradation diagram was collected by putting around 2 mg CNCs into an alumina crucible and heating to 800°C from 80°C with a heating rate of 20°C.
2.3 Results and discussion
2.3.1 Assumed sulfate groups on the surface of CNCs
A test was proceeded for the assumed sulfate groups on the surface of CNCs (Figure 5), making sure the sulfate groups form a covalent bond with CNCs, but not attach on the surface by hydrogen bonds instead.
Figure 5 Schematic diagram of a sulfate group attached on C6 (Dong and Gray 1997)
After a treatment of homogenizer, hydrogen bonds are expected to be destroyed, in the case of assumed covalent bonding, a CNC particle should disperse in water as the form of CNC-OSO3-; whereas the case of hydrogen bonds, a CNC particle would become sulfate ions and CNC-OH, which might be sediments. The result of sample “C”
showed no sediment with the CNC aqueous suspension as Figure 6, which agreed the assumption of a covalent bonding between sulfate groups and CNCs.
Figure 6 The CNC aqueous suspension after a treatment of homogenizer
On the other hand, a CNC suspension with a covalent bond between CNCs and a sulfate is expected to become gel-like after adding some divalent ions like Ca2+ since two CNC-OSO3- molecules might be linked together by a divalent ion. Otherwise, the sulfate ions would react with Ca2+ and become white sediment deposit (CaSO4). The result of sample “C” showed a gel without any sediment after adding some CaNO3 and CaCl2 powder into CNC aqueous suspension (Figure 7), which also confirmed the assumption of covalent bonds between sulfate groups and CNCs.
Figure 7 The CNC aqueous suspension became gel-like after adding some divalent ions
However, as to samples “F” and “P”, unlike “C”, both of them showed sediments in tests above though each samples were treated with a conductometric titration before freeze drying. That means the commercially available CNCs (“C”) were salt-form CNCs, but “F” and “P” remained protonated acid-form CNCs (H-CNCs). Since the titration was only done with indicator paper, a conductometric titration revised with more careful design and processed by equipment with high precision is required in the future to deal with the problem.
2.3.2 Outward appearance
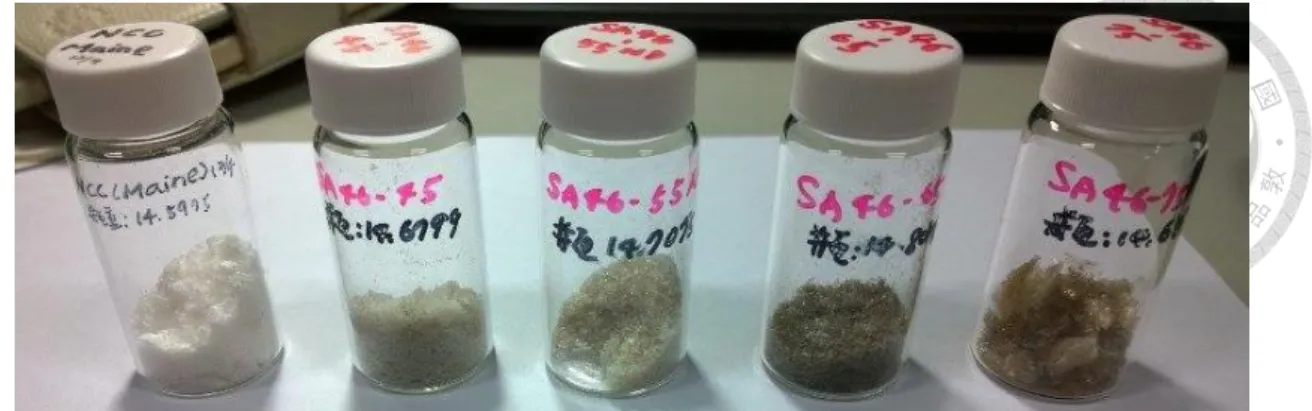
Owing to the excessive hydrolysis, there were oligomers or levoglucosans remained in the cases of strong hydrolysis conditions. It showed a gradient of color changes with an increasing hydrolysis temperature from white to brown of the series of sample “P” (Figure 8). Taking sample “C” (commercially-available one, the left sample in Figure 8) as reference, CNCs hydrolyzed at 45°C showed a white color which was more close to C than others. The results showed an obvious change from white to dark brown when increasing the hydrolysis temperature from 45 to 75°C (from left to right are 45, 55, 65, 75°C in Figure 8).
Figure 8 A gradient of color changes with an increasing hydrolysis temperature
Also, a gradient of color changes was found with an increasing hydrolysis duration of the series of sample “P” (Figure 9). Samples treated with a temperature as high as 65°C (the down, SA6365-X h) showed more obvious color change than those treated with a low temperature (45°C, the up, SA6345- X h) with an increasing duration X h, where X is 0.5, 1, 2 from left to right in Figure 9.
Figure 9 A gradient of color changes with an increasing hydrolysis duration
2.3.3 Dimension studies
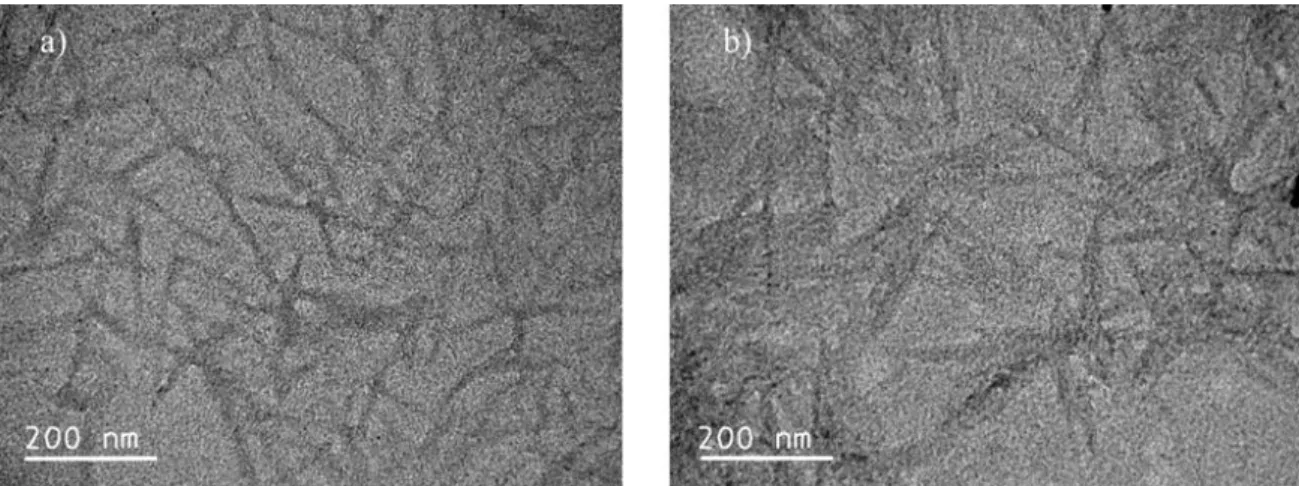
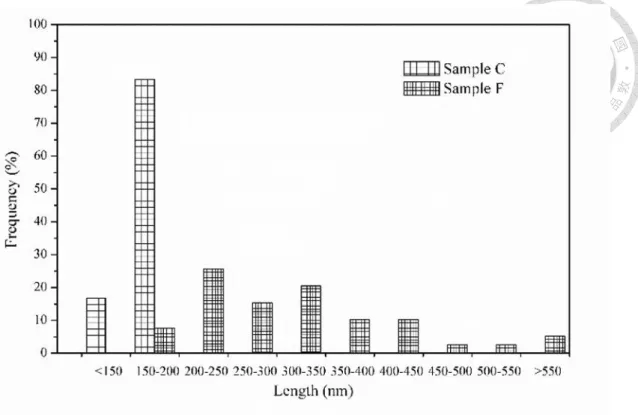
Information about dimensions were acquired based on the outer appearance of the CNCs such as Figure 10. Spindle-shaped CNCs were observed by TEM, indicating that the dimensions of sample C were smaller and more uniform than those of sample “F”
(Figure 11). The average length and width of sample C were 168±3 nm and 13.5±0.5 nm respectively, whereas those of sample F were 332±24 nm and 28.6±1.4 nm respectively. That means it requires a higher level of filtration than what did in this study to select CNC particles in a narrow range for obtaining CNC products with uniform dimensions.
Figure 10 TEM micrographs of samples (a) C and (b) F
Figure 11 Length distribution of samples C and F
The reason causing the dimensional difference between the two samples “C” and
“F” might be the unsuccessful counterion exchange. Some CNC particles of F remained protonated acid-form, and were not dispersible in water after fully dried. While drying, there were stronger and more numerous intermolecular hydrogen bonds of H-CNCs, which made them become aggregated. Hence, aggregated CNC particles were observed in the measurement of F, being thicker and longer than CNC particles of C. As to the uneven dimensional range of F, it might suggest to add an improved filtration in the end process of preparation.
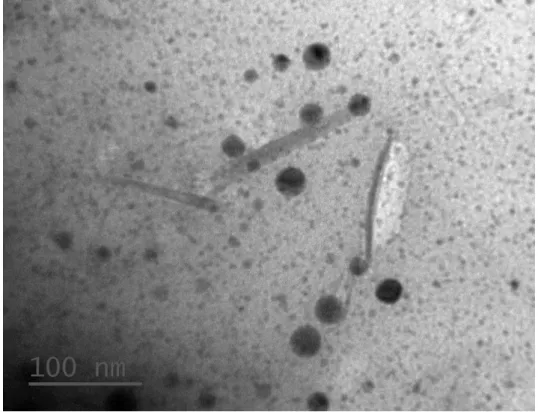
To prepare CNCs with short dimensions, a preparation task called “200P” was done with the usage of pre-milled pulp powder. A dry pulp board was ball milled to fibers with a hydrodynamic size around 200 nm. Then, a process as same as “2.2.1.2
CNC preparation: Sample “P”” was used. The result showed a length around 100 nm via TEM measurement (Figure 12). However, there were lots of impurities (black
spots in Figure 12) in each hydrolysis condition of 200P. On the other hand, a low yield (around 20%) and low crystallinity index (around 50%) were found after measurements.
When it comes to the cost of ball milling, it was not recommended as a way for CNCs preparing to pre-mill raw materials to c.a. 200 nm.
Figure 12 Sample “200P”, prepared at 65°C by 63% (w/w) sulfuric acid hydrolysis for 2 h
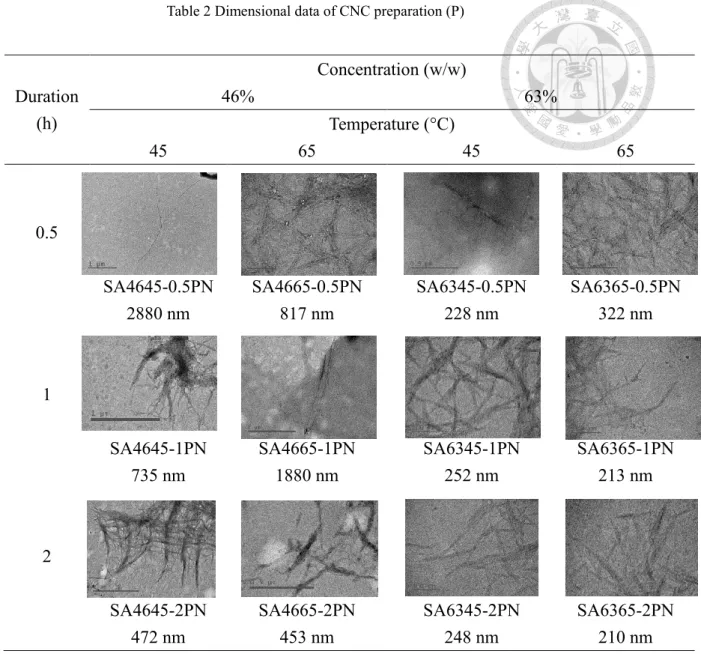
The detail of dimensional data from sample “P” is shown in Table 2. Samples prepared via the high sulfuric acid concentration (63%) were shorter in length than those obtained from the low concentration (46%). The length of CNCs is preferred to be shorter than 500 nm; therefore, a sulfuric acid concentration as high as 63% (w/w) was suggested to apply in the procedure of CNC preparation. However, regarded to quality reports provided by the zetasizer, P showed the worst quality that was too poly- dispersed, presented large or sedimenting particles. Also, the suspension of P showed low transparency. Thus, in the following study of suspension properties and inkjet printing test, P was excluded.
Table 2 Dimensional data of CNC preparation (P)
2.3.4 Crystalline index
The data of Cr.I. was calculated from the patterns of WAXD by the Ruland-Vonk X-ray diffraction method as mentioned before. An averaged Cr.I. of 200P was around 50%. The pre-milling treatment was suspected as a reason of such low Cr.I. since milling would destroy crystalline regions. As to the others, C, F, and P showed an averaged Cr.I. around 70–80%. The result of hydrolysis condition task (P) exhibited in Figure 13. Moreover, samples prepared with longer duration exhibited higher Cr.I. than those with shorter duration (2 h≥ 1 h> 0.5 h), which suggested the longest hydrolysis
Concentration (w/w) Duration
(h)
46% 63%
Temperature (°C)
45 65 45 65
0.5
SA4645-0.5PN 2880 nm
SA4665-0.5PN 817 nm
SA6345-0.5PN 228 nm
SA6365-0.5PN 322 nm
1
SA4645-1PN 735 nm
SA4665-1PN 1880 nm
SA6345-1PN 252 nm
SA6365-1PN 213 nm
2
SA4645-2PN 472 nm
SA4665-2PN 453 nm
SA6345-2PN 248 nm
SA6365-2PN 210 nm
duration of around 2 hours is suitable of the three durations for CNC products with a high crystallinity.
Figure 13 Cr.I. of CNC preparation test (P)
2.3.5 Surface morphology
All CNCs in this study (C, F, 200P, P) showed a FT-IR spectrum as Figure 14, which is similar to a typical spectrum (Figure 15). That means all of them had a similar surface morphology. The peak at 3,600-3,200 cm-1 was the stretching vibration of O-H and the peak at 2,900 cm-1 was symmetric and asymmetric C-H stretching vibration of aliphatic chain. As for peaks around 1,100-1,300 cm-1, they were ascribed to C-O, C-C, and ring structures. Others at 1,000-1,500 cm-1 remained deformational vibration of C- H, C-OH, C-CO, and C-CH groups (Khan et al. 2012).
Figure 14 FT-IR spectrum of “SA6345-2PN”
Figure 15 FT-IR spectrum of CNCs from reference: Khan et al. 2012
2.3.6 Thermal degradation temperature
The TGA diagram of 200P showed two-step degradation as shown in Figure 16.
The first degradation period started at around 140°C, and then entered a short stable stage when about half of CNCs (weight ratio) were degraded at around 240°C followed by the second degradation period started at around 270°C.
The result had a potential to explain that the Cr.I. of 200P were about 50%, which means the ratio of amorphous region and crystalline region was about 1 to 1. Since the
decomposition temperature of glucose started at around 158°C was researched (Hurtta et al. 2004), the first degradation period of 200P was suspected as the degradation of non-crystalline regions; whereas the second one might be contributed by crystalline regions.
Figure 16 The TGA diagram of 200P prepared at 45°C by 63% sulfuric acid hydrolysis for 2 h
In the series of 63% sulfuric acid hydrolysis in P (Figure 17), all of them exhibited a degradation temperature close to C (black line). The results exhibited only one degradation period owing to the relatively homogeneous structure with a high Cr.I., and the degradation temperatures higher than 300°C were contributed by the crystalline regions. However, strong conditions such as high hydrolysis temperature and long duration are assumed to introduce more sulfate groups on CNCs, which may act as flame retardants. Thus, CNCs obtained via 65°C hydrolysis (marked as “*” in Figure 17) remained more char residue than those obtained via 45°C (marked as “**” in Figure 17).
Figure 17 The series of 63% sulfuric acid hydrolysis (P)
Taking the sample “SA6345-2PN” as an example (Figure 18). The degradation temperature was defined as the point of secondary differentiation (the arrow in Figure 18). After making a comparison of the data as Figure 19, the thermal degradation temperature decreased with increasing hydrolysis temperatures and treatment durations.
Accordingly, low hydrolysis temperatures and short treatment durations were suitable for preparing CNCs with high thermal degradation temperature.
Figure 18 TGA diagram of “SA6345-2PN”
*
**
Figure 19 Thermal degradation temperature of CNC preparation task (P)
2.4 Summary of CNC preparation task
In this part, both filter paper and dry pulp were studied for CNC preparation test.
Also, dry pulp was applied with modified hydrolysis condition and the resulted products were evaluated with the dimension, Cr.I., and thermal degradation temperature. The result of dimensional data was driven out from TEM observation and analyzed using ImageJ, showing an averaged length shorter than 500 nm when the samples were prepared through a high sulfuric acid concentration (63%, w/w). Then, a longer hydrolysis duration (2 h) was suggested to be applied for gaining CNCs with a Cr.I.
higher than those obtained from shorter hydrolysis duration (0.5 h or 1 h). The FT-IR spectrum did not show any differences between samples, which means they had similar surface functional groups. Finally, with the concern of thermal stability, a low hydrolysis temperature (45°C) was preferred to prepare CNCs with higher thermal degradation temperature than those prepared via a high hydrolysis temperature like 65°C. The fundamental properties influenced by raw materials and preparation conditions may affect the colloidal behavior of certain suspension. As to the application in inkjet printing, colloidal properties such as surface charging properties, size distributions, as well as the viscosity were required to be investigated, However, the
quality of suspensions prepared by sample “P” was too low, as explained in the part
“2.3.1 Dimension studies”. Thus, in the following study about colloidal properties, “P”
was excluded.
3. Properties of cellulose nanocrystals suspensions
Properties of a CNC colloidal particle are predominantly determined by the condition of the electrolyte concentration and pH value. The first purpose of this part is to compare the dimensional data from a method of dynamic light scattering (DLS) and TEM to comprehend the aggregation state. The second one is to observe the effects of electrolyte concentrations and pH values on CNC suspensions and fit the data into theoretical models for discussing the surface properties of CNC colloidal particles. The third one is to find out the optimal condition of CNC suspensions for inkjet printing from the data related to the viscosity and size distribution.
3.1 Literature review: Colloidal properties
By controlled acid hydrolysis, cellulose nanocrystals (CNCs) are extracted from cellulosic materials, exhibiting unique properties due to its nanoscale, highly ordered- structure, as well as special surface morphology. Many applications have been investigated in the past decades, such as mechanical reinforcements (Oksman et al.
2006), bio-medical products (Rees et al. 2014), and so on. As to a new application of CNCs to inkjet printing for patterned type products, exploring the colloidal properties of CNC suspensions would be necessary. CNC aqueous suspensions tend to be electrostatically stabilized due to highly charged sulfate groups introduced on the surface; therefore, those suspensions exhibit various aggregation phenomena and other colloidal behavior at different CNC concentrations and conditions (Shafiei-Sabet et al.
2012; Zhong et al. 2012; Peddireddy et al. 2016).
Zeta potential (ζ), defined as the electric potential at the slipping plane in an interfacial electrical double layer, is usually an index for evaluating the dispersing level
of colloidal suspensions. The zeta potential could be calculated from the electrophoretic mobility (EPM) through a proper theory connecting EPM and the zeta potential. The applicability of the theory of the EPM depends om the concentration and type of ions, the size and shape of particles, and the magnitude of zeta potential. Several theories were proposed to connect ζ and EPM. From the measured EPM in different salt addition and pH values, the effect of the shape of CNC colloidal particles and their surface environment are investigated through the theoretical analysis.
Properties of CNC colloidal particles are determined by the condition such as electrolyte concentrations and pH values via two ways. First, the electrical double layer of a particle is influenced by the electrolyte concentration: the higher the concentration, the thinner the layer thickness. On the other hand, the dissociation level of the chargeable groups on the particles is affected by pH values, and particles acquire more negative/positive charges after adding a base/acid solution such as NaOH/HCl.
Charged particles are induced to migrate in the solution electrophoretically under the influence of applied electric field. By using a laser doppler velocimetry (DLV), the migration velocity of particles is measured. Then, EPM is calculated from the ratio of the velocity to the field intensity, reflecting the surface potential of colloidal particles.
The ζ of CNCs in several conditions are calculated from EPM through theoretical equations. Suspensions of colloidal particles with a magnitude of zeta potential higher than 30 mV are regarded as well-dispersed. Thus, we can determine the most suitable condition for particles to achieve an appropriately stable colloidal system after ζ measurement.
Besides, CNC particles are constantly moving in the solution due to Brownian motion. The Stokes-Einstein equation is applied to determination of the relationship
between the diffusion coefficient due to Brownian motion and the particle size measured by DLS. The larger the particle is, more slowly it moves. In order to observe the moving pattern, laser is used to irradiate to the suspended particles and the particles scatter light. Then, the temporal fluctuation of the intensity of scattered light is detected.
By analyzing the decay rate of the autocorrelation of the intensity fluctuation by the instrument, the diffusion coefficient and the hydrodynamic size of particles are estimated. Through this method, aggregates would be regarded as a big particle. Then, the degree of aggregation would be determined by comparing the dimension estimated by TEM, and further applied for determining the life time of CNC inks.
Then, the possibility of applying CNC suspensions to inkjet printing is discussed also based on the measurement of viscosity. A critical concentration was found for trouble-free inkjet printing. If the inkjet ink has too high viscosity or too large aggregates, it would not be applicable to print it out smoothly. Thus, the suitable condition for inkjet printing can be clarified after analyzing the results of colloidal properties.
3.2 Theories
3.2.1 Methods of calculating zeta potential (ζ) and electrophoretic mobility (EPM)
Zeta potential (ζ) was estimated based on the scaled surface potential (ys) by using the solution of Poisson-Boltzmann equation for a thin cylinder when the slipping plane is assumed to be located at the surface of a particle. The surface potential can be calculated from a reduced surface charge density (I) and surface charge density (σ) obtained by using the approximate analytical solution of the Poisson-Boltzmann (PB)
equation (Ohshima 1998) The relationship between I and σ is denoted by Equation 2, where εr and ε0 are the relative permittivity of water and vacuum permittivity at 20°C, respectively. 1/κ is the Debye-Hückel length, which is related to the valence and concentration of ions and is regarded as the thickness of electrical double layer. The Boltzmann constant, absolute temperature, and elementary charge are referred to as k, T, and e, respectively. On the other hand, I is a function of ys as denoted by Equation 3, where β is defined by Equation 4, a is the radius of a colloidal particle, and Kn(z) is the modified Bessel function of the second kind of order n.
e I
r kT
0 (2)
2 1
2 2
cosh 4 1 1
1 1 sinh 2
2
s s
y I y
(3)
) (
) (
1 0
a K
a K
(4)
Then, the equations also provided by Ohshima (1998) were applied to express the potential distribution around a cylinder immersed in a 1-1 electrolyte solution, such as sodium chloride. xs was used to refer the location of slipping plane. The potential distribution around a cylinder is
8 1 1
8 1 1
8 1 1
8 1 1
ln 2 )
( Ye Ye
Ye Ye
c
y
, (5)
where
a KX a
c K s
0
0
, (6)
and
1 2
tanh2 4 121 1
tanh 4 8
s s
y y Y
. (7)
After considering the relationship between the surface potential (y) and electric potential (Ψ) as defined by Equation (4), ζ was found as the electric potential at the slipping plane xs. A programming language “Python” was applied to do the calculation and introduce ζ into theories provided later.
kT y e
(8)
3.2.2 Theories to link electrophoretic mobility with zeta potentials
Due to the limitation in determination of required parameters, the Smoluchowski theory (Equation 9) is widely applied,
r 0 , (9)
, where η is the solvent viscosity.
However, the Somoluchowski equation is suitable in the case of large particles with low ζ. CNCs are supposed to be cylindrical particles in water. Therefore, the EPM depends on the orientation relative to the applied electric field. Thus, Ohshima (2015) applied Smoluchowski theory for a cylinder oriented parallel to an applied electric field and Henry’s equation (Equation 10) for the one oriented perpendicular to an applied electric field. In this equation, κ was taken into consideration, and κa could be regarded
as the ratio of the particle radius to the Debye length, which is related to the contribution from curvature with cylindrical geometry. The average mobility is given by μ𝑎𝑣 =
( μ∥+2μ⊥)
3 . In this study, “OH av.” was used to name the results calculated by this method, μ𝑎𝑣𝑂𝐻= ( μ∥+2μ3 ⊥𝑂𝐻).
0
2
1 1
2 2.55
1
1 exp
OH r
a a
(10)
In addition, when considering about the supposed sulfate groups on the surface of a CNC, the relaxation effect is required to be processed during calculation. To solve the problem, equations were derived by Ohshima (2015) with a consideration of the valence of counterions (Ζ) and dimensionless ionic drag coefficient (m±): Equation 11 is the EPM for a cylinder in the perpendicular orientation with the relaxation of double layer named as “OO”). The averaged EPM is μ𝑎𝑣𝑂𝑂 =( μ∥+2μ3 ⊥𝑂𝑂) . According to Ohshima, μ𝑎𝑣𝑂𝑂 is closet to the EPM for a sphere given byEquation 12. These equations are applicable for low to moderately high zeta potential (< 100 mV).
2
0 0
2
3 2
3 2
2 1 1
2 3
1 2.55
1 exp 0.612
2 9.94 1.87 0.147 exp 9.41
9 0.361exp 0.475 0.0878
2 8 10.8 18.2 0.0633
OO r r Ze
kT
a a
a a
a a a a
a a a
m m
a a a
(11)
2
0 0
3
3 3
2 1 2
3 1 3
2 1 2.5
1 2 exp
1.3exp 0.18 2.5 9 5.2 exp 3.9 5.6
2 1.2 exp 7.4 4.8 2 8 1.55 exp 0.32 6.02
OO r r
sphere
Ze kT
a a
a a a m m a a a
a a a a
(12)
3.3 Experimental
3.3.1 Sample preparation for colloidal properties measurements
In this study, commercially-available CNCs (“C”, provided by University of Maine) and laboratory-made CNCs prepared from filter paper (“F”) were used for measurement.
Samples were prepared as follows: Freeze-dried CNC powders were mixed with distilled water to be 0.1 % (w/w). Then, 1 mM hydrochloric acid (HCl) or sodium hydroxide (NaOH) was added to adjust the pH value to 3,5,7,9, and 11. After preparing CNC suspensions with specified pH values, different amounts of sodium chloride (NaCl) were added to each of them. Those samples were named “C/F-pH-salt (#)”, where “#” indicates the salt concentration in mM. In addition, a sample named “C/F- na-salt” was prepared without any acid or base for adjusting the pH value but with fresh distilled water. Each sample was tested in 2 days after preparation.
3.3.2 Zeta potential and electrophoretic mobility measurements
Zetasizer (Malvern, nano-ZS) was applied to measure EPM at 20°C and, in some cases, convert the EPM data to the zeta potential ζSmol based on the Smoluchowski
theory from 20 data after 3 runs. The conversion was conducted also through several theories provided above in the “theory” part.
3.3.3 Size distribution
The dynamic light scattering technique was applied for measuring the hydrodynamic size distribution by usging the zetasizer. Samples used were a series without pH adjustment, and the data are called “DLS-measured size”.
For comparison, the method provided by Ueno et al. (2014) was introduced to convert the hydrodynamic size (dh,av) from TEM images according to Equations 13 and 14, where L is the length, P is the aspect ratio, and v is calculated according to Equation 15. ImageJ was applied to more than 30 CNC particles for measuring the length and width of CNCs, and the converted hydrodynamic size are referred to as “TEM- estimated size”.
P v
dh L
ln (13)
5 6
,
h h av
h d
d
d (14)
2
100 . 0 565 . 312 0 .
0 p p
v (15)
3.3.4 Viscosity
Viscosity of CNC suspensions was measured using a capillary viscometer (μVISC, RheoSense) at 20°C, and applied shear rates were between 9500 and 500 s-1. Besides, CNC samples at high concentrations such as 1 and 3% (w/w) were also measured. These samples were named “C01p”, “C1p”, “C3p”, and so on for the concentrations of 0.1 % (w/w), 1 % (w/w), 3 % (w/w), and so on, respectively. A probe-type sonication (Ultra-
sonic homogenizer, UH-600S) was introduced to several samples before measurements.
3.4 Results and discussion
3.4.1 Size distribution of CNCs
The CNC dimensions of the samples C and F in TEM images were analyzed to estimate the hydrodynamic sizes. The difference between the TEM-estimated and DLS- measured sizes, as shown in Table 3, might be caused by the aggregation and the rotational diffusion of particles during the DLS measurement. The results were compared with the data obtained by Shafiei-Sabet et al. (2012) who performed DLS measurement of CNCs prepared from black spruce using the same type of instrument with that used in the present study. The difference between TEM-estimated and DLS- measured sizes in their study is smaller than ours. This means that samples C and F contain irreversible aggregates, which cannot be disaggregated, in water, even considering that the rotational diffusion of a long object might affect the fluctuation of scattering light.
Table 3 Results of hydrodynamic size measured by TEM and DLS
Sample C Sample F Shafiei-Sabet et al. (2012)
TEM-estimated (nm) 61 231 31
DLS-measured (nm) 111 392 35
Also, the aggregation phenomenon of both samples C and F is observed by DLS with an increasing salt addition as shown in Figure 20. The group 1C was measured without a sonication pretreatment; whereas the groups 2C and 3C were measured with it. CNCs in the suspension samples with salt addition levels higher than 25 mM show obvious aggregation, which could be re-dispersed by treating with sonication as 2C and
3C samples show
Figure 20 Relationship between salt concentration and intensity-weighted hydrodynamic diameter
Accordingly, Figure 21 shows that the size distribution becomes broader with an increased salt concentration, suggesting the formation of larger aggregations of CNCs in the suspension.
Figure 21 Size distribution of suspended CNCs at various salt concentrations for sample C
3.4.2 Charging properties of CNCs
The electrolyte concentrations played a more important role in influencing the value of ζSmol than pH values as shown in Figures 22. CNCs showed low ζ values with more additional electrolyte due to the compressed electric double layer. Although the surface charge is constant, the ζSmol of CNCs decreased with increased salt concentration due to the compressed electric double layer.
Figure 22 Relationship between electrolyte concentrations and ζ of sample C at various pH values
When the constant surface charge density of -19 and -16 mC/m2 for sample C and sample F, respectively, was taken into account, there might be some sulfate groups (- OSO3-), providing pH-independent charge on the surface of CNCs as mentioned in literatures (Dong and Gray 1997; Dufresne 2013b; Lagerwall 2014; Beck et al. 2015).
3.4.3 Theories comparisons of CNC suspensions
In the calculation of EPM, we assumed that the surface charge density is constant as in Kobayashi (2008) because the CNCs bear strong acid groups (Abitbol et al. 2013).
Sample F somehow showed a similar result to that of sample C. With the assumed value of the constant surface charge density irrespective of pH and the concentration of
electrolyte, one can evaluate the surface potential as a function of the electrolyte concentration by using the solution of the PB equations. With the assumed slipping plane located on the surface of a particle, ζ was calculated by the solution of PB equation as an electric potential at the slipping plane in an interfacial double layer. From the calculated ζ, the EPM can be obtained.
Then, the theoretical ζ was applied in several theories, converting to the theoretical EPM curves, and fitted the data plots after considering the properties of CNCs. While the Smoluchowski theory was widely applied in literatures, it is suitable for the case of large particles with low ζ. CNCs are supposed to be cylindrical particles in water. The EPM of anisotropic particles depends on the orientation relative to the applied electric field. Thus, a combined method of the Smoluchowski theory and Henry’s equation provided by Ohshima (2015) was applied to average the influence of orientation. In this study, “OH av.” is used to denote the results calculated by this method μ𝑎𝑣𝑂𝐻 . In addition, when considering the supposed sulfate groups on the surface of a CNC, the relaxation effect reduces the EPM during the electrophoresis for highly charged particles. To solve this problem, equations derived by Ohshima (2015) were chosen.
The non-dimensional averaged result, is referred to “OO no-av.” for OO; whereas the dimensional averaged one μ𝑎𝑣𝑂𝑂 is referred to “OO av.” in this study.
The result is shown in Figure 23. The surface charge density of samples C and F was assumed to be -19 and -16 mC/m2, respectively. It seems the Smoluchowski equation underestimates the data of CNCs at low NaCl concentration. At low electrolyte concentrations, “OO av.” and “OO no-av.” fit the data plots of both samples C and F better than the others. This confirms the assumption of the highly charged surface morphology of CNCs, indicating the relaxation of double layer reduces the EPM.
However, neither “OO av.” nor “OO no-av.” fit the experimental data to be exact, and the experimental data remained between them. It might suggest a specific orientation of particles to the applied electric field. That is, the CNCs move more perpendicularly to the applied electric field. Another possibility is the end effect that becomes significant at low salt concentration due to the infinite length of a cylinder. When the salt addition was increased, the particles became aggregated, showing the behavior fitted to the Smoluchowski theory.
Figure 23 Fitting of theoretical equations
3.4.4 Viscosity of CNC suspensions
Figure 24 shows no clear correlation between the electrolyte concentration and viscosity behavior for sample C, as well as sample F (Figure 25).
Figure 24 Relationship between viscosity and shear rate of CNCs at 0.1% (w/w) for sample C.
Numerical values for symbols denote NaCl concentration in mM
Figure 25 Relationship between viscosity and shear rate of CNCs at 0.1% (w/w) for sample F.
Numerical values for symbols denote NaCl concentration in mM
More obviously, the result shows shear-thinning phenomena especially at higher
CNC concentrations as shown in Figure 26. The viscosity level measured in this work is acceptable to suggest that the concentration should be adequately adjusted as close to 7% as possible, retaining as large amount of CNCs possible on the substrate surfaces because levels ranging from 10 to 20 mPa-s are suitable for stability of printing by ejecting droplets from the ink jet nozzles.
Figure 26 Influence of CNC concentration (sample C) on suspension viscosity
3.5 Summary of properties of cellulose nanocrystals suspensions
Laboratory-prepared CNCs (“F”) showed colloidal phenomena similar to commercially available CNCs (“C”). This meant that the surface morphology and colloidal shape of both samples C and F were similar in their suspensions, despite their different dimensions. A strong negative surface charge caused by sulfuric acid hydrolysis was confirmed when measuring the relationship between the pH, ζ, and electrolyte concentration of the CNC suspensions. Owing to the cylindrical shape of CNC colloidal particles and the relaxation effect caused by surface sulfate groups, theoretical results such as “OO av.” and “OO no-av.” were applied after fitting experimental data with similar equations. Viscosity measurements showed obvious shear thinning, and the highly concentrated CNC suspensions exhibited high viscosity.
A CNC concentration of up to 6% (w/w) is recommended for use in inkjet printing technology.