• 沒有找到結果。

Reduced health-related quality of life in elders with frailty: a cross-sectional study of community-dwelling elders in Taiwan

N/A
N/A
Protected

Academic year: 2021

Share "Reduced health-related quality of life in elders with frailty: a cross-sectional study of community-dwelling elders in Taiwan"

Copied!
26
0
0

加載中.... (立即查看全文)

全文

(1)

Reduced health-related quality of life in elders with frailty: a cross-sectional study of

community-dwelling elders in Taiwan

Cheng-Chieh Lin 1,2,3,4,5 , Chia-Ing Li 2 †, Chiu-Kai Chang 6 , Chiu-Shong Liu 1,2,3 ,

Chih-Hsueh Lin 1,3 , Nai-Hsin Meng 6 , Yih-Dar Lee 7,8 , Fei-Na Chen * 9 , Tsai-Chung Li* 4, 10,

11

1 Department of Family Medicine, China Medical University & Hospital, Taichung, Taiwan

2. Medical Research, China Medical University & Hospital, Taichung, Taiwan

3 Department of Family Medicine, College of Medicine, China Medical University &

Hospital, Taichung, Taiwan

4 Institute of Health Care Administration, College of Public Health, China Medical University & Hospital, Taichung, Taiwan

5 Department of Healthcare Administration, College of Health Science, Asia University, Taichung, Taiwan

6 Department of Physical Medicine and Rehabilitation, China Medical University &

Hospital, Taichung, Taiwan

7 Department of Psychiatry, Medical College, National Cheng-Kung University, Tainan, Taiwan

8 Bristol-Myers Squibb (Taiwan) Ltd, Global Development & Medical Affair, Taipei, Taiwan

9 School of Medicine, China Medical University & Hospital, Taichung, Taiwan 10 Graduate I nstitute of Biostatistics & Chinese Medicine Science, China Medical

University & Hospital, Taichung, Taiwan

11 Biostatistics Center, China Medical University & Hospital, Taichung, Taiwan

* Corresponding to: Tsai-Chung Li, China Medical University, 91 Hsueh-Shih Road, Taichung, 40421, Taiwan, Tel: 886-4-2205-3366 ext 6605, Fax: 886-4-22078539, e-mail:

tcli@mail.cmu.edu.tw

†Equal contribution as the first author

(2)

Abstract

Purpose: Exploring the domains and degrees of health-related quality of life (HRQOL)

that are affected by the frailty of elders will help clinicians understand the impact of

frailty. This association has not been investigated in community-dwelling elders.

Therefore, we examined the domains and degree of HRQOL of elders with frailty in the

community in Taiwan.

Methods: A total of 933 subjects aged 65 years and over were recruited in 2009 from a

metropolitan city in Taiwan. Using an adoption of the Fried criteria, frailty was defined

by five components: shrinking, weakness, poor endurance and energy, slowness, and low

physical activity level. HRQOL was assessed by the short form 36 (SF-36). The multiple

linear regression model was used to test the independent effects of frailty on HRQOL.

Results: After multivariate adjustment, elders without frailty reported significantly better

health than did the pre-frail and frail elders on all scales, and the pre-frail elders reported

better health than did the frail elders for all scales except the scales of role limitation due

to physical and emotional problems and the Mental Component Summary (MCS). The

significantly negative differences between frail and robust elders ranged from 3.58 points

for the MCS to 22.92 points for the physical functioning scale. The magnitude of the

effects of frail components was largest for poor endurance and energy, and next was for

slowness. The percentages of the variations of these 10 scales explained by all factors in

(3)

the models ranged from 11.1% (scale of role limitation due to emotional problems) to

49.1% (scale of bodily pain).

Conclusions: Our study demonstrates that the disabilities in physical health inherent in

frailty are linked to a reduction in HRQOL. Such an association between clinical

measures and a generic measure of the HRQOL may offer clinicians new information to

understand frailty and to conceptualize it within the broader context of disability.

Keywords: frailty; health-related quality of life; HRQOL; SF-36; Taiwanese population

Short Title: Frailty and quality of life in elders

(4)

Background

Frailty is one of the greatest gerontological challenges faced by Taiwan because it has one

of the fastest ageing populations in the world. Frailty has been defined as a

multidimensional syndrome, and is characterized by the loss of reserves including energy,

physical ability, cognition and health [1-3]. Frail elders are considered to be vulnerable to

adverse health outcomes, including mortality, institutionalization, falls, and

hospitalization [4-6]. The markers of frailty include age-associated declines in lean body

mass, strength, endurance, balance, walking performance, and low activity [7-10].

The Short Form 36 (SF-36) assesses health concepts that represent basic human values relevant to everyone„s functional status and well-being [11-12]. It assesses

health-related quality of life (HRQOL) outcomes, which are composed of disability and

discomfort components. Exploring the domains and degrees of functioning and

well-being that are affected by the frailty of elders will help clinicians to understand the

impact of frailty on functional status and well-being. Previous studies have investigated

the impact of frailty on HRQOL, and findings have been reported for

community-dwelling elders referred to an outpatient geriatric service [13], patients with

heart failure [14], older adults with cardiometabolic risk factors [15], institutionalized

older persons [16] or older Mexican Americans [17]. Although the effect of frailty had

been examined in community-dwelling older adults in the Netherlands [18] or in

(5)

Mexican Americans [17], this line of study has never been conducted in Chinese.

Previous studies had showed that there may exist cross-cultural differences in HRQOL

[19-20]. Thus, in the current study, we were interested in examining the domains and

degrees of functioning and well-being that are affected by the frailty of elders residing

in a community in Taiwan.

Methods

Population and participants

This was a population-based cross-sectional study. The target population consisted of

all residents aged 65 and over in eight administrative neighborhoods of North District of

Taichung City, Taiwan in June, 2009. Taichung is a city located in west-central Taiwan

with a population of just over one million people, making it the third largest city on the

island. The area of Taichung City is 163.4 sq km², and its population density was

6,249/km² in 2009. Taichung city consists of eight districts. There are a total of 36

administrative neighborhoods at North Districts and 214 administrative neighborhoods in

Taichung City. The eight administrative neighborhoods in our study were all from North

Districts. There were two reasons why these eight administrative neighborhoods were

selected. One was that they were the administrative neighborhoods around our hospital

and we planned to conduct a longitudinal study on this cohort in the future. Selecting

these eight administrative neighborhoods would facilitate the follow-up in the future. The

(6)

other reason was that all districts of Taichung City are of the same urbanization level. In

addition, the age and gender distributions of these eight administrative neighborhoods are

similar to those of Taichung population and Taiwan populations. There were a total of

3,997 elderly residents in these eight administrative neighborhoods during the time of the

study, about 4.58% of the Taichung population of the same age. The sampling frame for this study was the set of all individuals‟ records from the Bureau of Households.

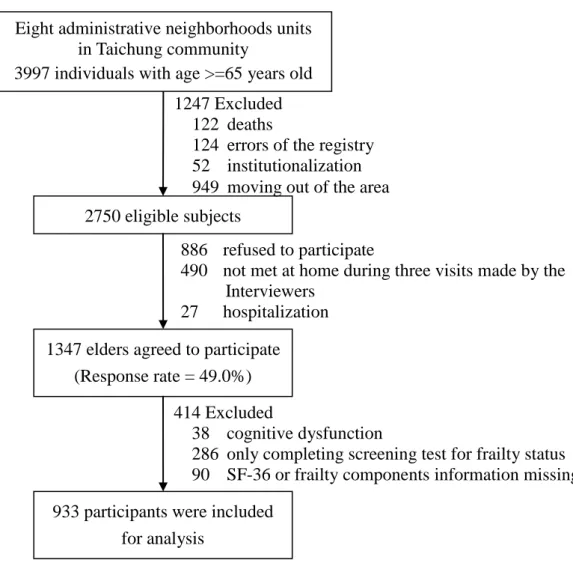
All eligible individuals were invited to participate in the current study. Figure 1

shows the flowchart of recruitment procedures. During household visits, we identified

1,274 individuals who were not eligible and excluded them from the study sample. The

reasons for exclusion included death (n=122), institutionalization (n=52), moving out of

the area (n=949), and errors of the registry (n=124). A total of 2,750 subjects were eligible,

and 1,347 agreed to participate and provide complete information. Thus, the overall

response rate was 49.0%. This study was approved by the Human Research Committee of

China Medical University Hospital. Written informed consent was obtained from each

participant. Among these participants, 286 elders completed only the first stage of the

screening test that included assessment of frailty measures and did not fill out the SF-36

questionnaires. A total of 933 elders were included in the current data analysis after

excluding those diagnosed as dementia (n=21), without Mini-Mental scores (MMSE)

(7)

information (n=11), with MMSE were less than 14 points (n=6), and those who had

incomplete frailty-related components or SF36 information (n=90).

Measurements

Frailty measures

Frailty was defined on the basis of well established, standardized and widely

accepted phenotype described by Fried et al. in the Cardiovascular Health Study [3]. It

composed of 5 components: shrinking, weakness, poor endurance and energy, slowness,

and low physical activity level. Four of five frailty components were exactly the same as

those proposed by Fried. Only weight loss was adapted. Shrinking was defined as

unintentional weight loss of3 kilograms in the prior year. Weakness was defined as grip

strength in the lowest quintile at baseline, based on subgroups of gender and body mass

index [3]. Poor endurance and energy were measured by self-reported exhaustion,

identified by two questions from the Center for Epidemiological Studies-Depression scale

[21]. Slowness was measured by the slowest quintile of the population based on the time

needed to walk 15 feet, based on subgroups of gender and standing height [3]. Low

physical activity level was measured by a weighted score of kilocalories expended per week based on each participant‟s report. The lowest quintile of physical activity in our

study sample was identified for each gender.

Those with none of the above components were considered as robust, whereas those

(8)

with one or two components were considered as pre-frail and those with more than two

components as frail.

SF-36

The SF-36 is a short questionnaire with 36 items which measure eight multi-item

variables: physical functioning (PF, 10 items), social functioning (SF, 2 items), role

limitations due to physical problems (RP, 4 items), role limitations due to emotional

problems (RE, 3 items), mental health (MH, 5 items), vitality (VT, 4 items), pain (BP, 2

items), and general perception of health (GH, 5 items). For each variable item, scores are

coded, summed, and transformed to a scale from 0 (worst possible health state measured

by the questionnaire) to 100 (best possible health state). In addition, the SF-36 Physical

Component Summary (PCS) and the Mental Component Summary (MCS) scales are

derived following the standard SF-36 scoring algorithms [22]. For the SF-36, a high score

indicates a better state of health.

Other measures

Data on smoking, alcohol drinking and physical activity were collected by

questionnaire when the participants underwent a complete physical examination. Smoking

and alcohol drinking were dichotomized into two groups. Those in the non-smoking

group had never smoked or had smoked less than 100 cigarettes during their lifetime,

whereas those in the smoking group smoked currently or had smoked more than or equal

(9)

to 100 cigarettes during their lifetime. Individuals who self-reported drinking alcohol or

exercising were classified into the group with this specific characteristic. There are two

additional questions with a binary response that measure the pain problem and sleep

impairment.

Statistical Analysis

Simple descriptive analyses, such as mean, standard deviation, proportion,

Chi-square test, and t-test, were employed to analyze data when appropriate. Analysis of

covariance (ANCOVA) was used to compare global group differences in SF-36 scales

after age or multivariate adjustment.

In order to examine the relative burden of frailty status on the scales, comparisons

of partial F-values of ANCOVA across eight scales were made. The method used for this

assessment was derived from the concept of statistical efficiency [23-25]. A measure is

more efficient, relative to another, if it yields a higher ratio of systematic variation relative

to random variation. When we hold the sample size constant within comparisons of eight

scales, the relative precision of these scales can be detected by comparing the magnitude

of the F statistic (ratio of systematic variance relative to error variance) [24].

The multiple linear regression model was used to test the independent effects of

frailty components on physical functioning and well-being by controlling for the other

independent variables. Regression models estimated the effects of frailty components on

(10)

HRQOL (SF-36) by comparing elders with frailty components to elders screened as being

without these components.

Results

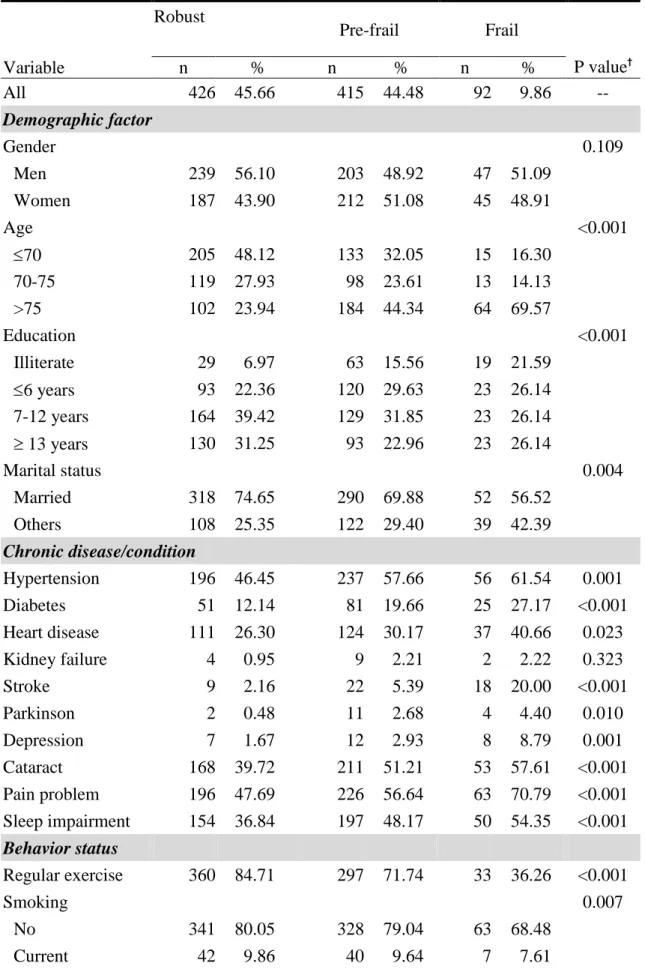
Of the 933 elders, 92 (9.86%), 415 (44.48%) and 426 (45.66%) were categorized as

frail, pre-frail and robust, respectively. The distributions of demographic factors, chronic

disease/condition, and behavior status for these three groups are compared in Table 1.

Those who were pre-frail and frail were older, more likely to have an educational

attainment of less than or equal to 6 years, and less likely to be married, had a higher

prevalence of hypertension, diabetes, heart disease, stroke, Parkinson's disease,

depression, cataract, pain problem, and sleep impairment, and were less likely to have

regular exercise, smoke, and drink alcohol.

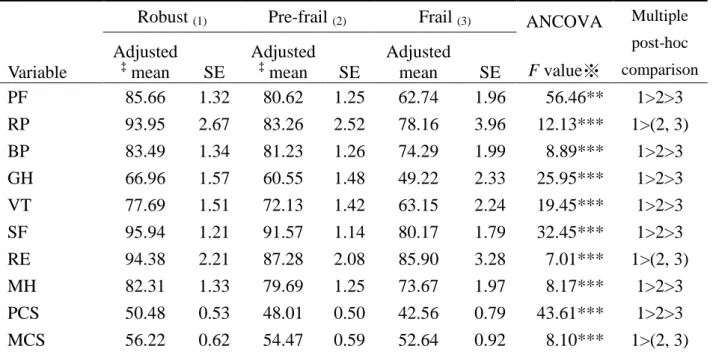
Table 2 provides multivariate-adjusted means and standard errors of the robust,

pre-frail and frail elders. In general, the robust elders reported significantly better health

than did the pre-frail and frail elders on all scales, and the pre-frail elders reported better

health than did the frail elders on all scales except RP, RE and MCS after multivariate

adjustment. The significantly negative differences between the frail and robust elders

ranged from 3.58 points for MCS to 22.92 points for PF. The differences between robust

and pre-frail elders were much lower. Larger values for the F statistic indicated a better

ability to discriminate between elders in the “best” and “worst” response categories for

(11)

these scales. The F statistics for testing the differences between the adjusted mean scores

of elders in different frailty groups were highest for the PF scale (F statistic=56.46) and

lowest for the RE scale (F statistic=7.01). This indicates that the PF scale discriminates

better than the RE scale among elders of different frailty groups.

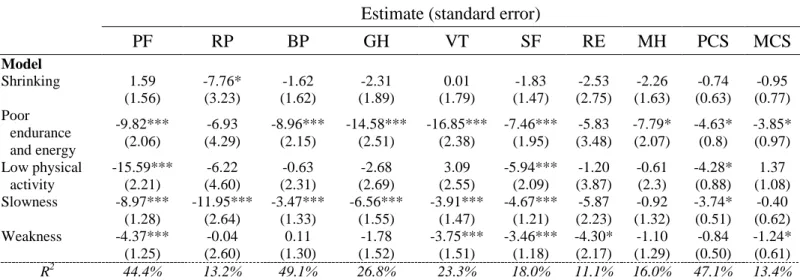
Multiple regression analysis was used to simultaneously estimate the effects of

frailty components in the eight scales and two summary scales of the SF-36 using

multivariate adjustment (Table 3). In general, the estimated effects of the frailty

components on all scales of the SF-36 were negative. Shrinking had a significant impact

only on the RP of SF-36. Poor endurance and energy had a significant impact on all scales

of the SF-36 except RP and RE. Low physical activity had a significant impact on PF, SF

and PCS, which were scales of the primary physical component. Slowness had a

significant impact on all scales, except RE, MH and MCS, and weakness had a significant

impact on the PF, VT, SF, RE and MCS scales. In general, the magnitude of the effects of

frailty components was largest for poor endurance and energy, and next for slowness. The

percentages of the variations of these 10 scales explained by these factors ranged from

11.1% to 49.1%, with the lowest percentage for RE and the highest percentage for BP.

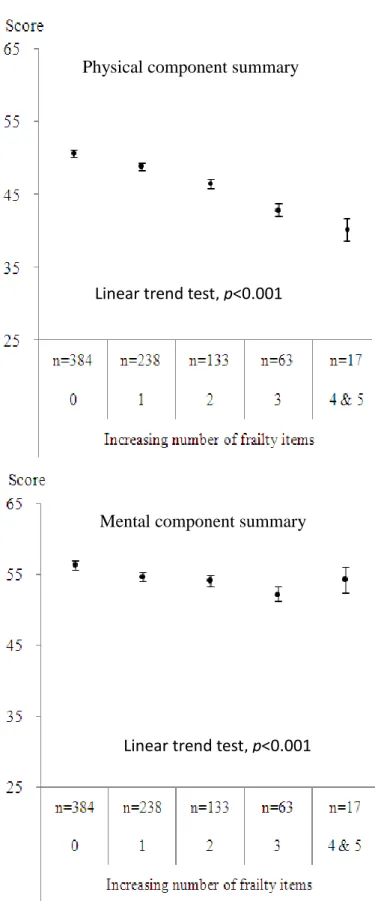
Figure 2 shows the multivariate-adjusted means of the PCS and MCS of the SF-36

in elders, based on the number of frailty components. There was a linear decrease in the

adjusted means of the PCS and MCS with the increasing number of frailty components (P

(12)

for trend <0.001 for both the PCS and MCS), although there was a slight increase in the

adjusted means of the MCS for the number of frailty components greater than or equal to

four. A greater magnitude of reduction in the PCS than in the MCS was observed.

Discussion

The purpose of this study was to assess the impact of frailty on functioning and

well-being in elders residing in a community in central Taiwan. Frail elders reported

significantly compromised HRQOL compared with elders without frailty in the same

population. This demonstrates that frailty had a considerable impact, not only on the

scales of the primary physical component, but also on the scales of the primary mental

component. Most of the effects are both statistically and clinically significant if one

accepts that differences of three to five points are considered clinically meaningful [11].

Our results showed that elders with frailty had noticeably negative effects on the eight

scales of the SF-36, ranging from 8.64 (MH) to 22.92 (PF) points below the scores for

elders without frailty. Of the five frailty components, poor endurance and energy exerted

the greatest effects and slowness the next greatest.

Our results are in agreement with the findings of those studies that have examined

the relationship between frailty and HRQOL, although different frailty definitions have

been used. Similar to ours, Masel et al. adopted a modified definition of frailty proposed

by Fried and SF-36 was used as a quality of life measure [17]. They found that being

(13)

pre-frail or frail was significantly associated with lower scores on all physical and mental

health related quality of life scales than being non-frail in older Mexican American

individuals. Bilotta et al. found a negative trend in HRQOL with frailty, as measured by

the Study of Osteoporotic Fractures for the dimensions of health, independence, home

and neighborhood, psychological and emotional well-being, and leisure, activities and

religion, in a cross-sectional study of 239 community-dwelling outpatients referred to a

geriatric medicine clinic [13]. Buck et al. found an extra 13% of the variance in HRQOL

was explained when the frailty index, developed by weighting age, number of comorbid

conditions, and symptom severity, was added into the model with known predictors [14].

In addition, the relationship between grip strength, one of frailty components, and

HRQOL was evaluated with 2,987 community-dwelling men and women aged 59-73

years of age, and the association was independent of age, size, physical activity and

co-morbidity [26].

The reduction in HRQOL associated with frailty was higher in magnitude than that

reported for chronic physical illnesses such as low back pain, arthritis, and diabetes [27],

which implicates the severe impact of frailty. For instance, the negative effect of frailty on

physical functioning in this study was -22.92, which was much worse than the impact of

diabetes (-6.3) [27], while the negative effect of frailty on general perception was 17.74

points, which was also higher than the impact of diabetes, back pain, hypertension and

(14)

stroke (about 15 points) [27].

A number of limitations should be noted in interpreting the results of this study.

One is that the cross-sectional design of the study does not allow for any prospective conclusion on the relationship of frailty with HRQOL. Second, the sample was selected from a Taiwanese metropolitan elderly population, thus our results may not be applied to those elders of rural areas. Third, because only elders residing in community were studied, our results may not be representative of elders in institutions. Last, the response rate was 49.0%. A small proportion of people was hospitalized and these hospitalized elders were more likely to be frail. Therefore it may lead to an underestimation of the frailty prevalence. By contrast, a greater proportion of people not met at home are possibly less frail than the average which may result in an overestimation of the frailty prevalence in the population. Similarly, 30.7% of the elders who agreed to participate in the study did not to fill out the SF-36 questionnaires or had missing data, indicating that potential missing bias might exist. Due to non-response or incomplete data, some degree of selection bias cannot be excluded.

Despite these limitations, the present study is the first to examine the impact of frailty on function and well-being in community-dwelling elders. The SF-36 measures functional status, well-being, and overall health, which are of prime concern to patients, and it provides yardsticks for HRQOL. We illustrated the profiles of HRQOL for elders with frailty contrasted to those without frailty. Examining the association between frailty and HRQOL facilitates understanding about the meaning of differences between generic health measures scale scores and the clinical measures that are familiar to clinicians.

Our study results demonstrated that the differences in HRQOL between elders with

and without frailty were substantial, and frailty might account for the differences. Future

(15)

studies exploring the longitudinal relationship between frailty and HRQOL should be

conducted to further clarify the causal relationship between frailty and HRQOL.

Conclusion

Our study demonstrates that the disabilities in physical health inherent in frailty can

be linked to a reduction in HRQOL as measured by the SF-36. Such an association

between clinical measures and a generic measure of HRQOL may offer clinicians new

information to understand frailty and to conceptualize it within the broader context of

disability. The reduction in HRQOL of elders with frailty could have clinical and health

management consequences and merits further study.

Acknowledgements

This study was supported by grants from the National Health Research Institutes of

Taiwan (NHRI-EX98-9838PI), China Medical University (CMU98-S-11), and the Taiwan

Department of Health Clinical Trial and Research Center of Excellence

(DOH100-TD-B-111-004).

Author Contributions

Conceived and designed the experiments: CCL TCL. Analyzed the data: TCL CIL CSL.

Contributed reagents/materials/analysis tools: CKC CHL NHM YDL TCL. Wrote the

paper: CCL TCL.

(16)

References

[1] Walston J, Hadley EC, Ferrucci L, Guralnik JM, Newman AB, et al (2006). Research

agenda for frailty in older adults: toward a better understanding of physiology and

etiology: summary from the American Geriatrics Society/National Institute on Aging

Research Conference on Frailty in Older Adults. J Am Geriatr Soc 54(6):

991-1001.

[2] Rockwood K, Song X, MacKnight C, Bergman H, Hogan DB, et al (2005). A global

clinical measure of fitness and frailty in elderly people. CMAJ 173(5): 489-495.

[3] Fried LP, Tangen CM, Walston J, Newman AB, Hirsh C, et al (2001).

Cardiovascular Health Study Collaborative Research Group: Frailty in older adults:

evidence for a phenotype. J Gerontol A Biol Sci Med Sci 56(3): M146-M156.

[4] Rockwood K, Stadnyk K, MacKnight C, McDowell I, Hébert R, et al (1999). A brief

clinical instrument to classify frailty in elderly people. Lancet 353(9148): 205-206.

[5] Speechley M, Tinetti M (1991). Falls and injuries in frail and vigorous community

elderly persons. J Am Geriatr Soc 39(1): 46-52.

[6] Winograd CH (1991). Targeting strategies: an overview of criteria and outcomes. J

Am Geriatr Soc 39(9 Pt 2): 25S-35S.

[7] Campbell AJ, Buchner DM (1997). Unstable disability and the fluctuations of frailty.

Age Ageing 26: 315-318.

(17)

[8] Fried LP & Walston J (1998). Frailty and failure to thrive. Hazzard WR, Blass JP,

Ettinger WH, Halter JB, Ouslander JG, ed. Principles of Geriatric Medicine and

Gerontology 4th ed. (pp. 1387-1402). McGraw Hill, New York.

[9] Paw MJMC, Dekker JM, Feskens EJM, Schouten EG, Kromhout D (1999). How to

select a frail elderly population? A comparison of three working definitions. J Clin

Epidemiol 52: 1015-1021.

[10] Chandler JM, Hadley EC (1996). Exercise to improve physiologic and functional

performance in old age. Clin Geriatric Med 12: 761-782.

[11] Ware JE, Sherboume CD (1992). The MOS 36-item short-form health survey

(SF-36): conceptual framework and item selection. Med Care 30: 473-483.

[12] Ware JE (1993). SF-36 Health Survey: Manual and Interpretation Guide. Boston:

The Health Institute.

[13] Bilotta C, Bowling A, Casè A, Nicolini P, Mauri S, et al (2010). Dimensions and

correlates of quality of life according to frailty status: a cross-sectional study on

community-dwelling older adults referred to an outpatient geriatric service in Italy.

Health Qual Life Outcomes 8: 56.

[14] Buck HG, Riegel B (2010). The impact of frailty on health related quality of life in

heart failure. Eur J Cardiovasc Nurs.

(18)

[15] Kanauchi M, Kubo A, Kanauchi K, Saito Y (2008). Frailty, health-related quality of

life and mental well-being in older adults with cardiometabolic risk factors. Int J Clin

Pract 62(9): 1447-1451.

[16] Sitoh YY, Lau TC, Zochling J, Schwarz J, Chen JS, et al (2005). Determinants of

health-related quality of life in institutionalised older persons in northern Sydney.

Intern Med J 35(2): 131-134.

[17] Masel MC, Graham JE, Reistetter TA, Markides KS, Ottenbacher KJ (2009). Frailty

and health related quality of life in older Mexican Americans. Health and Quality of

Life Outcomes 7(1): 70.

[18] Puts M, Shekary N, Widdershoven G, Heldens J, Lips P, et al (2007). What does

quality of life mean to older frail and non-frail community-dwelling adults in the

Netherlands? Qual Life Res 16: 263-277.

[19] Buck D, Jacoby A, Baker GA, Ley H, Steen N (1998). Cross-cultural differences in

health-related quality of life of people with epilepsy: findings from a European study.

Qual Life Res 8(8): 675-685.

[20] Kang Y (2009). Gender and culture differences in the quality of life among

Americans and Koreans with atrial fibrillation. Nurs Health Sci 911(3): 301-305.

[21] Orme J, Reis J, Herz E (1986). Factorial and discriminate validity of the Center for

Epidemiological Studies depression (CES-D) scale. J Clin Psychol 42: 28-33.

(19)

[22] Ware J, Kosinski M (2001). Interpretation: Content and criterionbased. In SF-36

Physical & Mental Health Summary Scales: A Manual for Users of Version I. 2nd

edition (pp. 57-87). Lincoln, RI: QualityMetric Incorporated.

[23] Snedecor GW, Cochran WG (1967). Statistical methods, 8th ed. Ames, Iowa: Iowa

State University Press.

[24] McHorney CA, Ware JE Jr, Rogers W, Raczek AE, Lu JF (1992). The validity and

relative precision of MOS short- and long-form health status scales and Dartmouth

COOP charts: results from the Medical Outcomes Study. Med Care 30S:

MS253-MS265.

[25] McHorney CA, Ware JE, Raczek AE (1993). The MOS-36-item short-form Health

Survey (SF-36): II. Psychometric and clinical tests of validity in measuring physical

and mental health constructs. Medical Care 31: 247-263.

[26] Sayer AA, Syddall HE, Martin HJ, Dennison EM, Roberts HC, Cooper C (2006). Is

grip strength associated with health-related quality of life? Findings from the

Hertfordshire Cohort Study. Age Ageing, 35(4), 409-415.

[27] Lyons RA, Lo SV, Littlepage BNC (1994). Comparative health status of patients

with 11 common illnesses in Wales. Journal of Epidemiology and Community

Health, 48, 388-390.

(20)

Table 1. Characteristics of subjects according to frailty status

Robust

Pre-frail Frail

P value

Variable n % n % n %

All 426 45.66 415 44.48 92 9.86 --

Demographic factor

Gender 0.109

Men 239 56.10 203 48.92 47 51.09

Women 187 43.90 212 51.08 45 48.91

Age <0.001

70 205 48.12 133 32.05 15 16.30

70-75 119 27.93 98 23.61 13 14.13

>75 102 23.94 184 44.34 64 69.57

Education <0.001

Illiterate 29 6.97 63 15.56 19 21.59

6 years 93 22.36 120 29.63 23 26.14 7-12 years 164 39.42 129 31.85 23 26.14

 13 years 130 31.25 93 22.96 23 26.14

Marital status 0.004

Married 318 74.65 290 69.88 52 56.52

Others 108 25.35 122 29.40 39 42.39

Chronic disease/condition

Hypertension 196 46.45 237 57.66 56 61.54 0.001 Diabetes 51 12.14 81 19.66 25 27.17 <0.001 Heart disease 111 26.30 124 30.17 37 40.66 0.023

Kidney failure 4 0.95 9 2.21 2 2.22 0.323

Stroke 9 2.16 22 5.39 18 20.00 <0.001

Parkinson 2 0.48 11 2.68 4 4.40 0.010

Depression 7 1.67 12 2.93 8 8.79 0.001

Cataract 168 39.72 211 51.21 53 57.61 <0.001 Pain problem 196 47.69 226 56.64 63 70.79 <0.001 Sleep impairment 154 36.84 197 48.17 50 54.35 <0.001

Behavior status

Regular exercise 360 84.71 297 71.74 33 36.26 <0.001

Smoking 0.007

No 341 80.05 328 79.04 63 68.48

Current 42 9.86 40 9.64 7 7.61

(21)

Former 43 10.09 47 11.33 22 23.91

Alcohol drinking 0.012

No 338 79.34 339 81.69 74 80.43

Current 65 15.26 55 13.25 6 6.52

Former 23 5.40 21 5.06 12 13.04

Robust: 0 frail components present; pre-frail :1-2 frail components present; frail: 3 frail components present.

P values were calculated by chi-square test

(22)

Table 2. Adjusted means and standard errors of SF-36 according to frailty statuses

Robust (1) Pre-frail (2) Frail (3) ANCOVA Multiple post-hoc comparison Variable

Adjusted

mean SE

Adjusted

mean SE

Adjusted

mean SE F value※

PF 85.66 1.32 80.62 1.25 62.74 1.96 56.46** 1>2>3 RP 93.95 2.67 83.26 2.52 78.16 3.96 12.13*** 1>(2, 3) BP 83.49 1.34 81.23 1.26 74.29 1.99 8.89*** 1>2>3 GH 66.96 1.57 60.55 1.48 49.22 2.33 25.95*** 1>2>3 VT 77.69 1.51 72.13 1.42 63.15 2.24 19.45*** 1>2>3 SF 95.94 1.21 91.57 1.14 80.17 1.79 32.45*** 1>2>3 RE 94.38 2.21 87.28 2.08 85.90 3.28 7.01*** 1>(2, 3) MH 82.31 1.33 79.69 1.25 73.67 1.97 8.17*** 1>2>3 PCS 50.48 0.53 48.01 0.50 42.56 0.79 43.61*** 1>2>3 MCS 56.22 0.62 54.47 0.59 52.64 0.92 8.10*** 1>(2, 3) Robust: 0 frail components present; pre-frail :1-2 frail components present; frail: 3 frail components present.

Physical functioning (PF), Role physical (RP), Bodily pain (BP), General health (GH), Vitality (VT), Social functioning (SF), Role emotional (RE), Mental health (MH), Physical component summary (PCS), Mental component summary (MCS)

: Adjusted for age, gender, education, marital status, chronic disease, pain problem, sleep impairment, regular exercise, smoking and drinking behaviors.

** :p<0.01; *** : p<0.001; SE stands for standard error; ※ partial F value is presented.

(23)

Table 3. The estimated parameters of five frailty components for 10 scales of SF-36 Estimate (standard error)

PF RP BP GH VT SF RE MH PCS MCS

Model

Shrinking 1.59

(1.56)

-7.76*

(3.23)

-1.62 (1.62)

-2.31 (1.89)

0.01 (1.79)

-1.83 (1.47)

-2.53 (2.75)

-2.26 (1.63)

-0.74 (0.63)

-0.95 (0.77) Poor

endurance and energy

-9.82***

(2.06)

-6.93 (4.29)

-8.96***

(2.15)

-14.58***

(2.51)

-16.85***

(2.38)

-7.46***

(1.95)

-5.83 (3.48)

-7.79*

(2.07)

-4.63*

(0.8)

-3.85*

(0.97) Low physical

activity

-15.59***

(2.21)

-6.22 (4.60)

-0.63 (2.31)

-2.68 (2.69)

3.09 (2.55)

-5.94***

(2.09)

-1.20 (3.87)

-0.61 (2.3)

-4.28*

(0.88)

1.37 (1.08) Slowness -8.97***

(1.28)

-11.95***

(2.64)

-3.47***

(1.33)

-6.56***

(1.55)

-3.91***

(1.47)

-4.67***

(1.21)

-5.87 (2.23)

-0.92 (1.32)

-3.74*

(0.51)

-0.40 (0.62) Weakness -4.37***

(1.25)

-0.04 (2.60)

0.11 (1.30)

-1.78 (1.52)

-3.75***

(1.51)

-3.46***

(1.18)

-4.30*

(2.17)

-1.10 (1.29)

-0.84 (0.50)

-1.24*

(0.61) R

2

44.4% 13.2% 49.1% 26.8% 23.3% 18.0% 11.1% 16.0% 47.1% 13.4%

Physical functioning (PF), Role physical (RP), Bodily pain (BP), General health (GH), Vitality (VT), Social functioning (SF), Role emotional (RE), Mental health (MH), Physical component summary (PCS), Mental component summary (MCS)

Adjusted for age, gender, education, marital status, chronic disease, pain problem, sleep impairment, regular exercise, smoking and drinking behavior.

* p<0.05, ** p<0.01, *** p<0.001

(24)

Figure 1: The flowchart of recruitment procedures of the current study 2750 eligible subjects

Eight administrative neighborhoods units in Taichung community

3997 individuals with age >=65 years old 1247 Excluded

122 deaths

124 errors of the registry 52 institutionalization 949 moving out of the area

886 refused to participate

490 not met at home during three visits made by the Interviewers

27 hospitalization 1347 elders agreed to participate

(Response rate = 49.0%)

933 participants were included for analysis

414 Excluded

38 cognitive dysfunction

286 only completing screening test for frailty status

90 SF-36 or frailty components information missing

(25)

Figure 2. Relationship between physical and mental component summary and the frailty index. All values were adjusted for age, gender, education, marital status, chronic disease, pain problem, sleep impairment, regular exercise, smoking and

Physical component summary

Mental component summary

Linear trend test, p<0.001

Linear trend test, p<0.001

(26)

drinking behavior. Adjusted mean and standard error are shown as circle point

and vertical bar

數據

Table 1. Characteristics of subjects according to frailty status      Robust  Pre-frail  Frail  P value † Variable  n  %  n  %  n  %  All  426  45.66  415  44.48  92  9.86  --  Demographic factor  Gender  0.109  Men  239  56.10    203  48.92    47  51.09
Table 2. Adjusted means and standard errors of SF-36 according to frailty statuses
Table 3. The estimated parameters of five frailty components for 10 scales of SF-36  Estimate (standard error)
Figure 1: The flowchart of recruitment procedures of the current study 2750 eligible subjects
+2

參考文獻

相關文件

Quality kindergarten education should be aligned with primary and secondary education in laying a firm foundation for the sustainable learning and growth of

Stage 6 Special Program of Study – Personal Development, Health and Physical Education Life

Stage 6 Special Program of Study – Personal development, health and physical education life

In spite of higher rentals for housing (+12.51%) and dearer charges for maintenance &amp; repair services of dwelling (+9.60%), reduced prices of LP Gas (-4.65%) and the

Keywords: Feng-Xue Yan-Zhao, Feng-Xue’s Zen domination, styles and ethos of Zen, the Linji Domination, the Record of the Seven Elders of Feng-Xue in Qianfeng Baixue Zen

• The Tolerable Upper Intake level (UL) is the highest nutrient intake value that is likely to pose no risk of adverse health effects for individuals in a given age and gender

prevent cruelty and alleviate suffering, and through education to cultivate a deep respect for life in the community so that all living creatures may live.. together

- WHO “ Health is a state of complete physical, mental and social well- being and not merely the absence of disease or infirmity”.. 甚麼是