國 立 交 通 大 學
應用化學研究所
博士論文
National chiao Tung University
Ph.D Thesis
以場效電晶體為平台,建立一套新穎的偵測方法應用
於中性小分子分析物之檢測
Design and Construct SiNW-FET nanobiosensor for the
detection of small molecule
學 生 : 張可欣 (Ko-Shing Chang)
指 導 教 授 : 李耀坤 博士 (Dr. Yaw-Kuen Li)
Contents
Contents i
中文摘要 iv
Abstract v
Acknowledgement vii
List of Figures viii
List of Tables xiv
Chapter 1 General introduction 1
1-1 Biosensors using one-dimensional nanostructure on FET 1
1-2 Steroids 4
1-3 The design and study of steroid detection system 7
1-4 Open sandwich immunoassay (OS-ELISA) application SiNW-FETs
9
1-5 Fluorescence Resonance Energy Transfer (FRET) 10
Chapter 2 Dependence of an intramolecular Protein-Ligand
interaction for the construction of steroids sensing
model 12
Abstract 12
2-1 Introduction 13
2-2 Materials and Methods 16
2-2-2 KSI gene construction
17
2-2-3 Protein expression and purification
19
2-2-4 Kinetic analysis and steady-state fluorescent study
19
2-2-5 The chemical modification and pepsin digestion of KSI
20
2-2-6 Mass spectrometric analysis
20
2-2-7 Time-Resolved Fluorescence Anisotropy
21
2-3 Result and Discussion 21
2-3-1 The catalytic activity of Art_KSI and the binding affinities toward steroids.
21
2-3-2 Identification and sequencing of the peptide labeled with I-14
23
2-3-3 The comparison of the fluorescence polarization factors of the Labeled KSI mutants.
28
2-3-4 Fluorescence anisotropy decays of I-14 in KSI mutants.
30
2-3-5 Fluorescence anisotropy decays of mA51 moiety in Art_KSI/mA51
33
2-4 Conclusion 35
Chapter 3 Detection of non-charge analytes by SiNW-FETs 37
Abstract 37
3-1 Introduction 38
3-2 Experiment 40
3-2-1 Fabrication of SiNW-FETs
40
3-2-2 Immobilization of enzyme on UTB-FETs surface
41
3-3 Result and Discussion 43
3-4 Conclusion 59
Chapter 4 Cholic acid assay by Fluorescence Resonance Energy
Transfer 60
4-1 Introduction
60
4-2 Experiments
64
4-2-1 Materials and Methods
64
4-2-2 The modification of Cholic acid
64
4-2-3 Assembly of the KSI-Bound Dye-Labeled analogue with QDs and FRET Quenching Assays
66
4-3 Result and Discussion
67
4-4 Conclusion 72
Chapter 5 Conclusion 74
Chapter 6 Supplementary 76
以場效電晶體為平台,建立一套新穎的偵測方法應用
於中性小分子分析物之檢測
學生 : 張可欣 指導教授 : 李耀坤博士
國立交通大學應用化學所
中文摘要
高偵測靈敏度之場效電晶體於生物感測器之應用,主要是利用待測物 (蛋白 質、DNA、抗體等) 吸附於通道表面時,待測物本身之帶電特性影響表面電位造 成元件傳導性質之改變。然而針對部分不帶電荷之重要分子 (如:類固醇賀爾蒙) 而言,如何設計一新穎的偵測系統並有效應用場效電晶體生物感測器偵測該類型 待測物將是本研究之重點。本研究整合了蛋白質基因工程、奈米元件製作、電子 工程與表面化學修飾等跨領技術,發展而成一套新穎的類固醇偵測平台。以成熟 的分子生物技術為基礎,成功地取得人工重組酵素 (△5-3-酮基類固醇異構酵 素;Art_KSI),並以化學鍵結方法在不影響酵素功能的前提下,將帶電荷之探針 分子 mA51;1, 5-EDANS 之化學衍生物)修飾在酵素上 (Art_KSI/mA51)。再經 由酵素固定化的方法將此辨識類固醇的受體固定化於奈米元件表面。當類固醇待 測物 (19-norandrostendione; 19-NA) 加入感測系統時,19-NA 將與 mA51 競爭並 趨使帶電荷之探針脫離活性區進而暴露於奈米線表面,此時便可利用場效電晶體的特性間接針對不帶電待測物做精準、快速的分析 (偵測極限可達 10-15莫耳濃
度)。同時也利用螢光與超快雷射的理論基礎進一步去證明酵素與小分子間的作
用關係。此外,為避免複雜的生物檢測系統設計,本實驗亦成功以Open–Sandwich
Enzyme-Linked Immunoassay ( OS-ELISA) 並結合場效電晶體為技術平台來偵測 另一不帶電荷分子 (Bisphenol A)。
Design and Construct SiNW-FET nanobiosensor for
the detection of small molecule
Student : Ko-Shing Chang Advisor : Dr. Yaw-Kuen Li
Department of Applied Chemistry
National Chiao-Tung University
Abstract
The novel steroid-sensing model was constructed by intramolecular binding of a ligand through an alkyl linker [(-CH2)3] covalently bonded to a residue in the
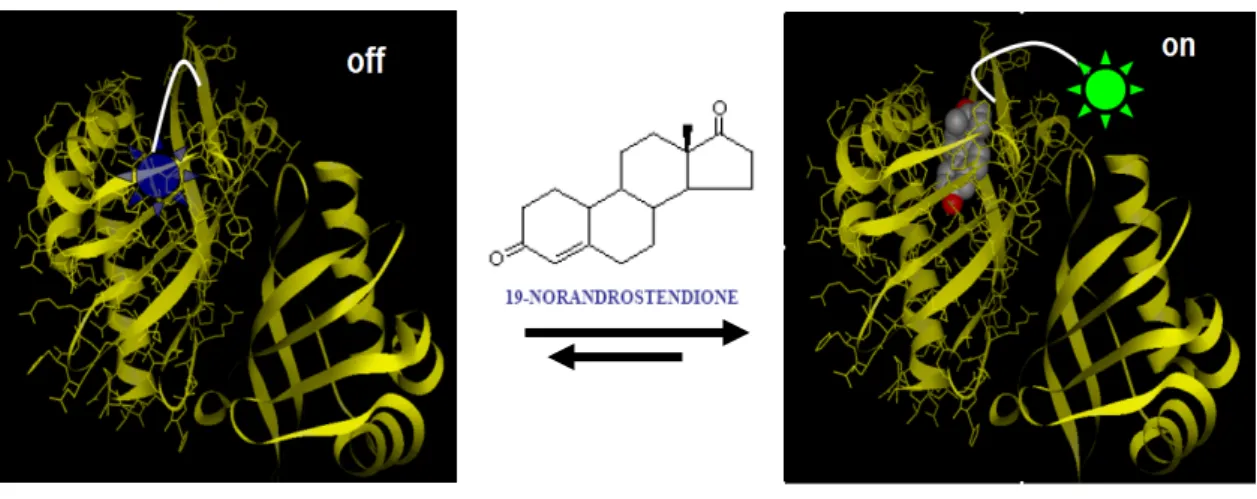
proximity of the active site of the protein. A genetically engineered △5-3-ketosteroid isomerase (KSI) was designed to conjugate uniquely with this ligand at its Cys-86 by the formation of disulfide bond. The steady-state protein-ligand binding, mediated by hydrophobic interactions, was confirmed by fluorescence spectroscopy and the identification of fluorophore-labeled peptides sequence using tandem mass spectrometry. The comparison of steady-state fluorescence spectra of various fluorophore-labeled proteins revealed that the emission characteristics varied with the change in environmental factors. Furthermore, the evaluation of fluorescence anisotropy decay of the fluorophore suggested the existence of the intramolecular protein-ligand binding interaction. The time-resolved fluorescence anisotropy studies of the different protein-ligand complexes yielded various values of anisotropy decay representing the degrees of freedom of the fluorophore in accordance to its location, inside or outside the steroid binding domain. When 19-norandrostendione was added to this protein-ligand system, a competitive binding between the ligand and the steroid was observed to confirm the feasibility of the design on steroid detection by
engineered KSI.
This protein-ligand system is utilized to overcome the intrinsic limitation of SiNW-FETs, because the general detection of SiNW-FETs is only feasible for charged analytes (such as protein, DNA, antibody, virus etc.). This engineered KSI protein was designed to function as the steroid acceptor, which was chemically modified by a carbon chain linked 1, 5-EDANS moiety, and further immobilized on the surface of silicon nanowire. In the presence of steroid, the negatively charged 1, 5-EDANS moiety, which presumably accommodates in the steroid-binding site, is expeled and exposes to the nanowire surface. The electrical response yielding from 1, 5-EDANS moiety is measured and the concentration is calculated accordingly. The sensitivity of this novel nano-bio-device can reach femto-molar level. This is the very first successful demonstration that a SiNW-FETs can detect non-charged analytes. Further medical applications can be evolved from this nano-biosensing system or same sort. At the same time, we also successfully demonstrate this novel noncharged analyte biosensing model on Ultra Thin Body Field Effect Transistors (UTB-FETs). On the other hand, a novel immunobioassay system (Open–Sandwich Enzyme-Linked Immunoassay; OS-ELISA) has been utilized to avoid this complex bio-and chem-design of non-charged analytes detection platform. In case, non-charged Bisphenol A has been successfully used to demonstrate the possibility of the application-based OS-ELISA on SiNW-FETs.
誌 謝
首先誠摯的感謝指導教授李耀坤博士及許鉦宗博士,兩位老師悉心的教導使我 得以一窺生物科技與奈米技術領域的深奧,不時的討論並指點我正確的方向,使 我在這些年中獲益匪淺。老師對學問的嚴謹更是我輩學習的典範。 口試期間承蒙吳東昆博士、林俊成博士、洪偉修博士與刁維光博士等費心的審 閱與諸多寶貴經驗的建議與傳授,使本篇論文能更臻完備,亦使我獲益良多。 本論文的完成亦得感謝奈米研究所的陳振嘉博士與皓恆學弟在矽奈米元件製 作上與晶片量測上的大力協助,及應用化學所張智瑋博士與駱立揚博士在超快雷 射分析上之鼎力相助。因為有你們在我研究路途上的相互提攜與切磋,著實讓我 學習到不同領域的知識與研究的方法態度,進而使得本論文能夠更完整而嚴謹。 在此致上最誠摯的謝忱。 在交大的這些日子裡,當然充滿著滿滿的酸、甜、苦、辣,很感激金鳳學姐與 小黃學長在專業領域上的教導與分享;阿進、答特六、阿尼、美琪、KK、大姊伉 儷、大屁勝、搏的、akie 伉儷、書沛、佩君、家瑛、蟬依等等的關懷與陪伴。 實驗室裡共同的生活點滴,學術上的討論、言不及義的閒扯、趕實驗的革命情 感、...,感謝實驗室的各位,有你/妳們的陪伴讓我的研究生活變得絢麗 多彩。 另外更由衷的感謝愛我的祖父母、爸媽、大姐、二姐和自閉兒,在我求學期間 的支持與關懷。有了他們背後的默默支持讓我更有前進的動力。另外也感謝小米 的體諒與包容,如果沒有這些愛我的人的幫助相信這將是很不一樣的光景。 最後,謹以此為獻給我摯愛的祖父母與雙親。 張可欣 謹誌於 國立交通大學理學院 98 年 5 月List of Figures
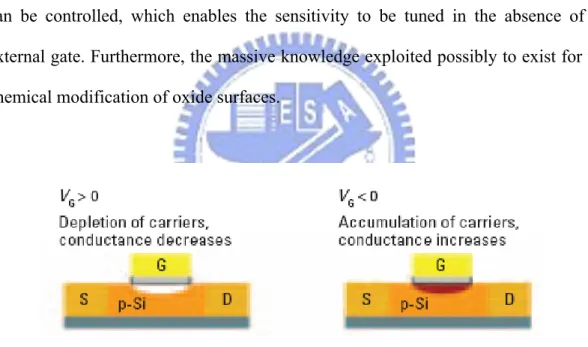
Figure 1-1. Schematic of a p-type FET device. S, source; D, drain; and G, gate
electrodes; VG, gate voltage.
2
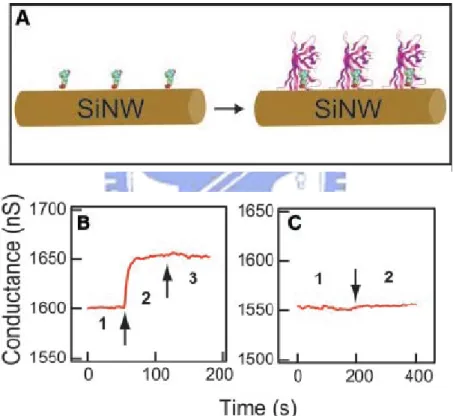
Figure 1-2. Real-time detection of protein binding. (A) Schematic illustrating abiotin-modified SiNW (left) and subsequent binding of streptavidin to the SiNW surface (right). (B) Plot of conductance versus time for a biotin-modified SiNW, where region 1 corresponds to buffer solution, region 2 corresponds to the addition of 250 nM streptavidin, and region 3 corresponds to pure buffer solution. (C) Conductance versus time for an unmodified SiNW; regions 1 and 2 are the same as in (B).
3
Figure 1-3. The structure of steroid skeleton.5
Figure 1-4. The structure of cholic acid.6
Figure 1-5. (A) The surface of SiO2 has been subsequently actived byN-[3-(trimethoxysilyl)propyl]ethylenediamine(AEAPTMS) and Bis(sulfosuccinimidyl) suberate (BS3). (B) The immobilization of
protein on SiNW was through the substitution reaction between succinyl ester and lysine residue (at the C-terminus (Lys-125)). (C) KSI was designed to conjugate uniquely with this ligand at its Cys-86 by the formation of disulfide bond.
8
Figure 1-6. A schematic drawing of open – sandwich bioassay.
10
Figure 2-1. The simulated construction of protein-ligand intramolecularinteraction.
14
Figure 2-2. SDS-PAGE analysis of protein purity. Land 1 shows the protein markerand Lane 2 is Art_ KSI protein produced in E. coli, and purified on an
Anion exchange column.
22
Figure 2-3A. LC/MS analyses on the chemical modification of KSI. The speciesDa.) plus the moiety of 5-[2-(acetamido)ethylamino]
naphthalene-1-sulfonic acid (306 Da).
24
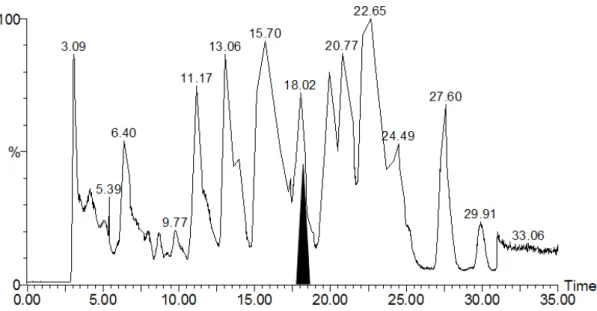
Figure 2-3B. LC/MS analyses on the chemical modification of KSI. Y14only labeledwith I-14 followed by pepsin digestion and HPLC separation. Through comparison with the control digest, the shaded portion was found to contain the labeled fragment (retention time 17-19 min).
25
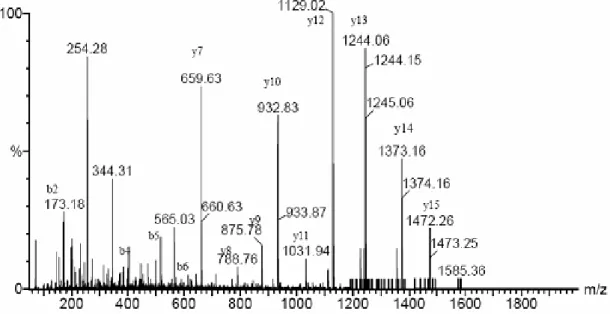
Figure 2-4A. MS/MS analysis of the peptide labeled with I-14. MS/MS daughter-ionspectrum of the unlabelled peptide (m/z 822.6 in the doubly-charged
state).
26
Figure 2-4B. MS/MS analysis of the peptide labeled with I-14. MS/MS daughter-ionspectrum of the labeled peptide (m/z 975.8 in the doubly-charged
state).
26
Figure 2-4C. MS/MS analysis of the peptide labeled with I-14. Rationalization ofthe observed singly-charged y- and b-ions with the pattern of amino
acid sequence of the expected peptide.
27
Figure 2-5. The steady-state emission spectra of I-14 in various environments.Spectra were indicated as follows: I-14 in 100% IPA solution (▼), I-14 in 60% IPA solution (▲), I-14 in 20% IPA solution (●), and I-14 in 0% IPA solution (■). Note that H2O was used to compensate the
percentage of IPA.
28
Figure 2-6. The emission spectra of KSI mutants labeled with I-14. Spectra wereindicated as follows: Y14only/I-14 (■), mKSI_126C/I-14(●), Art_KSI/mA51, and Art_KSI/mA51 treated 30 μM 19-norandrostendione (○). All emission spectra obtained in Tris HCl
buffer (50mM, pH7.5)
30
Figure 2-7. Time-resolved fluorescence anisotropy decay of I-14 in (A) I14 in Trisbuffer , (B) Y14only/I-14 and (C) mKSI_126C/I14. The raw data are shown as open circles and the fitting results are represented by solid
Figure 2-8. Time-resolved fluorescence anisotropy decay of mA51 in Art_KSI.
35
Figure 3-1. The design of SiNW-FET for the detection of non-charged analyte.
39
Figure 3-2. Structure of the SiNW-FET device. (a) Scanning electron images of aSiNW in silicon-on-insulator, the width and height of SiNW are 90 nm and 40 nm, respectively; (b) The diagram of the device employed for
sensing by adding 19-NA solution (10 μl) over the SiNW.
41
Figure 3-3. The mass spectroscopic analysis of Art_KSI conjugated with the reporter.
The measured molecular weight of Art_KSI/mA51 is 34770 ± 2 amu, which is consistent with the calculated value of 13768 amu (13402 amu for
Art_KSI and 366 amu for mA51).
44
Figure 3-4. The various stages of modification on SiO2 substrate and thecorresponding SEM images after the treatment of AuNPs. The SEM images revealed the existence of AuNPs on the surface of substrate with
the modification (a) by APTES, (b) byBS3, and (c) by KSI_126C.
46
Figure 3-5. The multiple surface modified processes for enzyme immobilization onThe p-type UTB-FET surface.
47
Figure 3-6A. Ids vs. Vds measurements on the same p-type UTB-FET after deferentchemical modifications; insert: the optical image of p-type UTB-FET
devices. Dimensions, width= 5 m , length= 10 m, thickness=10 nm.
49
Figure 3-6B. Histogram of conductance of the multiple surface modified p-typeUTB-FET.
51
Figure 3-7A. Ids-Vds curve of the p-type UTB-FET. The electronic response ofArt_KSI modified on p-typeUTB-FET.
52
Figure 3-7B. Ids-Vds curve of the p-type UTB-FET. The electronic response ofArt_KSI_mA51 modified on p-typeUTB-FET.
53
Figure 3-7C. Ids-Vds curve of the p-type UTB-FET. (1-G/G0) electronic response inconductanceof modified Art_KSI_mA51 or Art_KSI, G0 is conductance
when target analytes are introduced.
53
Figure 3-8. The response of conductance of various SiNW-FETs with the presenceof 19-NA. The arrows indicated the time point of the addition of 19-NA to SiNW-FETs labeled (a) by Art_KSI and (b) by Art_KSI/mA51 with the concentration: (1) 0.0013 fM, (2) 0.013 fM, (3) 0.13 fM, (4) 1.3 fM, (5) 13 fM, (6) 130 fM, and (7) 1300 fM.
54
Figure 3-9. The linear correlation of the conductance change inArt_KSI/mA51-labeled SiNW-FET with respect to the applied concentration of 19-NA. Note that the abscissa is a logarithmic value of 19-NA concentration in femto molar. Each data point was the average of 130 time of measurements. G0 =conductance at 0.0013 fM 19-NA, G
= conductance at different concentration 19-NA, G△ =G-G0.
56
Figure 3-10. The application of open – sandwich bioassay for noncharged analyte BPA detection by using SiNWs-FET platform. (A) The response of conductance of various SiNW-FETs with the presence of BPA and VH.
(B) The response of conductance of various SiNW-FETs with the presence of VH.only. (C) The response of conductance of various
SiNW-FETs with the presence of BPAonly.
58
Figure 4-1. The study of protein-ligand interaction constructed by FRET.Y14only_KSI immobilized on the surface of QD by ion interaction which plays as a efficient donor for the designed fluorescence acceptor.
63
Figure 4-2. The synthesis of fluorescence acceptor (CA/TTD/TMR). (a) 1.1 mmoleCholic acid, 2.5 mmole DCC and excess TTD in dry THF were on ice bath for 30 min. 6 mmole DIPEA was added slowly and kept the reaction at RT, overnight. (b) The compound 2 (CA/TTD/TMR) was synthesized by the following steps: the CA/TTD (1 mmole) and 5
(6)-carboxy-tetramethylrhodamine succinimyl ester (0.1 g, 2 mmole)14 were dissolved in 10 ml dry DMF on ice bath for 30 mins. DIPEA (1 ml, 6mmole) was dropped slowly into the reaction mixture. The reaction
mixture was stirred at RT overnight.
65
Figure 4-3. Normailized spectra of (a) emission of PDDA-QDs (530nm) (b) emissionof PDDA-QDs (543nm) (c) absorption of CA/TTD/TMR (d) emission of CA/TTD/TMR (570 nm) at excited wavelength 400 nm. All spectra were
measured in PBS system (20mM, pH7.5).
67
Figure 4-4. (A) The concentration of QDs/Y14only_KSI was kept fixed and theconcentration of CA/TTD/TMR was increased from 0 to 8 µM at pH 7.5, 20 mM phosphate buffer. The decreasing fluorescence intensities at 530 nm, which was presented the intramolecular interaction between Y14only_KSI and CA/TTD/TMR by FRET. (B) The normalized spectra has presented the efficiency of FRET by QDs/PDDA quench. The KD
value of CA/TTD/TMR was measured (at λ530 nm) to be 0.6 µM by the
quench yield of QDs/PDDA. (C) The FRET efficiency has been normalized to measure by the increasing fluorescence intensities of
CA/TTD/TMR (at λ570nm).
69
Figure 4-5. (A) PL spectrum of the QDs/PDDA (530 nm) donors and CA/TTD/TMR (570 nm) dye acceptors for each ratio in titration series CA/TTD/TMR without biocomponent KSI involving. (B) The normalized spectra presents the efficiency of FRET by QDs/PDDA quench. (C) The FRET efficiency has been normalized to measure by the increasing
fluorescence intensities of CA/TTD/TMR (at λ570nm).
72
Figure S1. The chemical structure of mA51-mA51.
76
Figure S2. The measured molecular weight of mA51-mA51 is 734 ± 1 amu, whichisconsistent with the calculated value of 733 amu. The values of m/z =
Figure S3A. The level complementary of a pair of primers were designed to construct
the gene of Art_KSI protein by PCR methods.
77
Figure S3B. (a) Agarose electrophoresis gel results of cloning. M, molecular markers;
lane 1, was first DNA fragment (~100 bp) amplified by PCR; lane 2, second DNA fragment (~200bp) amplified by PCR; lane 3, was third DNA fragment (~280 bp) amplified by PCR ; and land 4, was full length
of DNA fragment (375bp) amplified by PCR.
78
Figure S4A. The SiO2 surface morphology is very smooth and its roughness is thesmallest in the three samples after the APTMS modification.
79
Figure S4B. The silanized SiO2 surface was caused increasing its roughness by usingBS3 conjugation.
79
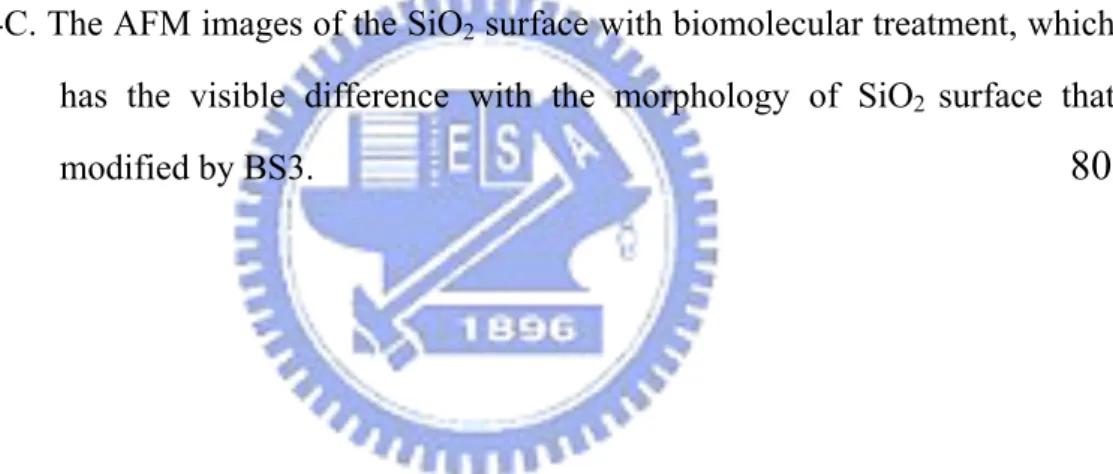
Figure S4C. The AFM images of the SiO2 surface with biomolecular treatment, whichhas the visible difference with the morphology of SiO2 surface that
modified by BS3.
80
List of Tables
Table 2-1. The sequences of primers for the construction of Art-KSI gene.
18
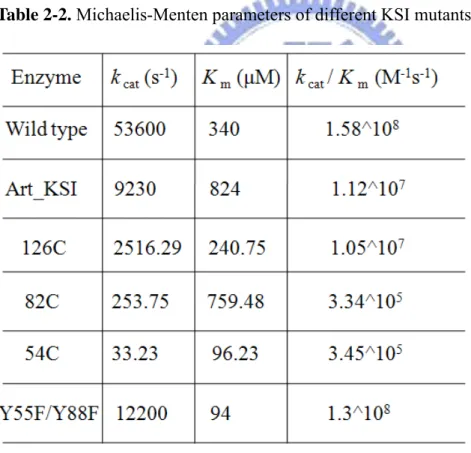
Table 2-2. Michaelis-Menten parameters of different KSI mutants.
22
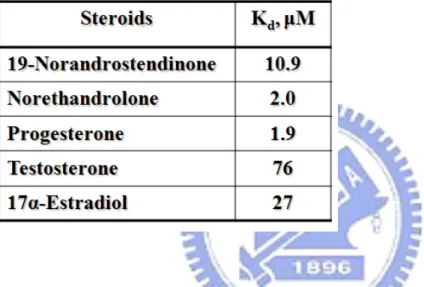
Table 2-3. Dissociation constant of steroid derivatives.23
Table 3-1. Comparison of changes in conductance due to surface modifications ofthep-typeUTB-FETs.
54
Chapter 1
General Introduction
1-1. Biosensors using one-dimensional nanostructure on FET
Advances in nanotechnology and nanoscience have provided a new material with unique optical, electrical, magnetic, or catalytic properties. The diversity in their composition (organic or inorganic, metal or semiconductor), shape (particles, rods, wires, tubes and others), surface functionalization (physical, chemical, or biological) has enabled the fabrication of various functional nanoscale devices.18 The development of nano devices by integration of biomaterials, nanoparticles and semiconductor quantum dots has great expanded the impact of biophotonics and bioelectronics, supporting especially drug delivery and the diagnosis of disease.
Biosensors have a wide range of potential applications in biotechnology, process control and medicine. They are used mainly to measure accurately the concentration of analytes in physiological fluid to diagnose some diseases. A numbers of bio-detection methods based on optical, electrochemical, mass-sensitive, and thermometric platforms, using labeling or label-free detection, have been developed. The development of a simple assay, highly sensitive, miniature and fast-respond platform, enables a direct detection is very important for biosensing.
One-dimensional nanostructures of Carbon Nanotubes (CNTs) and Silicon Nanowires (SiNWs), have been successfully demonstrated as sensitive chemical and biological sensors by modifying the gate oxide (without gate electrode) with molecular receptors or a selective membrane for the analyte of interest on the Field Effect Transistor (FET), which was shown in Figure 1-1. The FETs show potential for very high sensitivity because of a depletion and accumulation of charge carriers, which are caused due to the binding of a chargemolecule on the surfaces of SiNWs or
CNTs. Such depletion or accumulation affects the entire cross-sectional conduction pathway of the nanostructures. However, several properties of CNTs have limited their development as nanosensors, including the following: (i) Existing synthetic methods produce mixtures of metallic and semiconducting CNTs, which make systematic studies difficult because metallic “devices” will not function as expected, and (ii) Flexible methods for the modification of CNTs surfaces, which are required to prepare interfaces selective for binding a wide range of analytes, are not well established.19 Nanowires of semiconductors such as Si overcomes above limitations of CNTs, as they are always semiconducting, and the dopant type of concentration can be controlled, which enables the sensitivity to be tuned in the absence of an external gate. Furthermore, the massive knowledge exploited possibly to exist for the chemical modification of oxide surfaces.
Figure 1-1. Schematic of a p-type FET device. S, source; D, drain; and G, gate
electrodes; VG, gate voltage.
Semiconductor nanowires are emerging as remarkably powerful building blocks in nanoscience, with the potential to affect significantly numerous areas of science and technology ranging from electronics and photonics to the life sciences and healthcare. Studies of biosensors made from SiNWs began with the pioneering work of Lieber et al. who demonstrated ultrasensitive detection of biological and chemical
species using nanoscale FETs. The original bio-application of SiNW-FETs was using a straptavidin-biotin system which was presented in Figure 1-7.19 The p-type biotin-modified SiNW-FETs exhibits the effective protein straptavidin binding by the accumulating carriers in p-type materials. Nowadays, the real-time detection of single viruses,20 various antigens,19,21 oligonucleotides,22,23 proteins18,24 and charged small molecules25 have been shown to be feasible on the devices using nanowire or carbon nanotube transistors as the active transductors.
Figure 1-2. Real-time detection of protein binding. (A) Schematic illustrating a
biotin-modified SiNW (left) and subsequent binding of streptavidin to the SiNW surface (right). (B) Plot of conductance versus time for a biotin-modified SiNW, where region 1 corresponds to buffer solution, region 2 corresponds to the addition of 250 nM streptavidin, and region 3 corresponds to pure buffer solution. (C) Conductance versus time for an unmodified SiNW; regions 1 and 2 are the same as in (B).19
Among biosensors of various types, the silicon nanowire field-effect transistor (SiNW-FETs) is believed to be the most sensitive and powerful device for bio-applications. The principle of sensing is based on the variation of conductivity resulting from a disturbance of charge on the surface of the SiNW-FETs, but this detection is feasible for charged analytes, such as a protein, DNA, antibody, virus etc. The objective of our work was possible to overcome this intrinsic limitation of a SiNW-FET and to develop a platform to detect steroids.
1-2. Steroids
Steroids are lipophilic, low-molecular weight compounds derived from cholesterol that play a number of important physiological functions. The biological activity of a steroid molecule depends on its ability to interact with a specific binding site on the corresponding receptor. An important function of the steroid hormones is to coordinate physiological and behavioural responses for specific biological purposes, such as reproduction. Gonadal steroids influence and determine secondary sexual characteristics during development and sexual maturation, contribute to the maintenance of their functional state in adulthood and control or modulate sexual behaviour.
The importance of even minor changes in the structure of a steroid molecule for its biological activity explains why target tissue metabolism may play such a critical role in modulating hormone action at the cell level. The parent compound from which all steroids are derived is cholesterol. As shown in Figure 1-3, cholesterol is made up of three hexagonal carbon rings (A,B,C) and a pentagonal carbon ring (D) to which a side-chain (carbons 20-27) is attached (at position 17 of the polycyclic hydrocarbon). Two angular methyl groups are also found at position 18 and 19. Removal of part of
the side-chain gives rise to C21-compounds of the pregnane series (progestins and corticosteroids). Total removal produces C19-steroids of the androstane series (including the androgens), whereas loss of the 19-methyl group (usually after conversion of the A-ring to a phenolic structure, hence the term "aromatization") yields the estrane series, to which estrogens belong. Individual compounds are characterised by the presence or absence of specific functional groups (mainly hydroxy, keto(oxo) and aldehyde functions for the naturally occurring steroids) at certain positions of the carbon skeleton (particularly at positions 3,5,11,17,18,20 and 21.
Figure 1-3. The structure of steroid skeleton.
Because of the physiological function of steroids in body, the state of target tissue metabolism can be monitor by the determination of steroid hormones, such as deoxycholic acid determination. Deoxycholic acid is one of the secondary bile acids (Figure 1-4), which are metabolic byproducts of intestinal bacteria. In humans, the most important bile acids are cholic acid, deoxycholic acid, and chenodeoxycholic acid, prior to secretion by the liver, they are conjugated with either the amino acid glycine or taurine. Conjugation increases their solubility in water, preventing passive
re-absorption once secreted into the small intestine. As a result, the concentration of bile acids in the small intestine can stay high enough to form micelles and solubilize lipids. The term "critical micellar concentration" refers to both an intrinsic property of the bile acid and to the amount of bile acid necessary to function in the spontaneous and dynamic formation of micelles. As surfactants or detergents, bile acids are potentially toxic to cells and their levels are tightly regulated. They function directly as signaling molecules in the liver and the intestines by activating a nuclear hormone receptor known as FXR, which inhibiting the synthesis of bile acid in the liver when the levels of bile acid is too high. Emerging evidence associates FXR activation with alterations in triglyceride metabolism, glucose metabolism and liver growth.
Figure 1-4. The structure of cholic acid.
Steroid hormone assays are gerenally based on the monitoring of complex chemical or enzyme catalytic reactions by optical, electrochemical, chromatography or mass detection platforms.1 -10 In particularly, the production of coating steroid antigens for use in immunoassay is essential to the development of steroid analysis.7-10 However, the time-consuming nature and the prohibitive costs involved in the preparation of complex antibody or receptor are amongst the factors which restrict the development of ELISA-liked assays. In this study, a novel, high sensitivity
and low detection limit for steroid hormone assays are developed by combining nanotechnology and bioengineering in SiNW-FETs (Silicon Nanowires-Field effect transistor).
1-3. The design of uncharged analyte detection system
In our study, firstly, the protein used for steroid recognition was derived from a genetically engineered △5-3-ketosteroid isomerase (KSI).12-17 This novel steroid-sensing model was constructed by intramolecular binding of a fluorophoric ligand, 5-(2-aminoethylamino)-1-naphthalenesulfonate moiety, through an alkyl linker bonded to a residue in the proximity of the steroid-binding site of the sensing protein. The structural design of KSI was based on the understanding of KSI from the previous studies contributed by many groups.12-17 To eliminate the possibility of multi-labeling and the complex orientation evolving from ligand conjugation and further protein immobilization, we constructed a KSI mutant gene by PCR amplification with eight mutated sites (Y55F, K60R, F86C, F88G, K92R, K108R, K119R, and A125K) in single protein molecule. The resulting KSI mutant, designated Art_KSI, contains only one cysteine residue (Cys-86) and one lysine residue at the C-terminus (Lys-125), which serve for further chemical conjugation of the reporter and for the immobilization of protein on SiNW, respectively (Figure 1-5). Moreover, the steady-state of protein-ligand interaction would be confirmed by fluorescence spectroscopy and tandem mass spectrometry.
Secondly, a novel immunobioassay system (Open–Sandwich Enzyme-Linked Immunoassay; OS-ELISA) has been utilized to avoid this complex bio-and chem-design of non-charged analytes detection platform. In case, non-charged Bisphenol A has been successfully used to demonstrate the possibility of the application-based OS-ELISA on SiNW-FETs.
Finally, we have also attempted to establish a cholic acid bioassay system by utilization of fluorescence resonance energy transfer (FRET) principle. In this research, the binding affinity between tetramethylrodamine (TMR)-labeled cholic acid (CA) and self-assembled KSI by assuming CA/TTD/TMR as the energy donor and poly(diallyldimethylammonium chloride) QDs (QDs/PDDA) as the acceptor. Depended on the FRET operation, our research results exhibit great potential applications to establish a effective biosensing platform for quantitative determination of a wide variety of small molecules.
Figure 1-5. (A) The surface of SiO2 has been subsequently actived by
N-[3-(trimethoxysilyl)propyl]ethylenediamine(AEAPTMS) and Bis(sulfosuccinimidyl) suberate (BS3). (B) The immobilization of protein on SiNW was through the substitution reaction between succinyl ester and lysine residue (at the C-terminus (Lys-125)). (C) KSI was designed to conjugate uniquely with this ligand at its Cys-86 by the formation of disulfide bond.
1-4. Open sandwich immunoassay (OS-ELISA) application on
SiNW-FETs
Enzyme-liked immunoassay (ELISA) has been popularly developed for the application of biological therapeutic. The fundamental detection methods used in conventional ELISA is spectrometric detection, which requires the use a large scale and expensive spectrometer for measuring the absorbance of the enzyme-catalyzed products or for detecting enzyme-catalyzed chemiluminescence. Recently, ELISA based on electrochemical detection have been developed to replace the using of expensive optical instruments and low sensitive detection of spectrophotometric platforms.76 One approach was direct immunosensing by field-effect transistor which has been successfully demonstrated19 to detect an interfacial potential change induced by biological interaction on solid surface. The detection limitation is approach to fM.77
Most proteins can be sensitively quantified with immunoassay by using two antibodies. However, specific detection as well as quantification of small molecules (such as steroids and peptides) is not more available due to the low detection limitation and a limited binding surface for the two antibodies in small substance. As a way to circumvent these limitations, a novel immunoassay-open sandwich immunoassay (OS-ELISA) system69-74 has been developed (Figure 1-7) and used to integrate with high sensitive SiNW-FETs. A small bridging antigen lies on a heart to determine the reassoication of the generally weak antibody variable region VH-VL
complex in OS-ELISA system. The OS-ELISA approach employs the antigen dependency of the interaction between the separated heavy chain (VH) and light chain
(VL) of an antibody variable region. Without antigen, the two fragments are prone to
dissociate; while in the presence of antigen, they associate owing to increased interaction by the bridging antigen. In a number of OS-ELISA system, the fragments
of display antibody have been developed on phage surface, utilized to select high affinity binders from the libraries of various sources. In this study, high sensitive SiNW-FETs would be used to measure the VH/VL interaction strength by noncharged
(Bisphenol A) which was constructed by professor Ueda’s lab in Tokyo.
Figure 1-6. A schematic drawing of open – sandwich bioassay.
1-5. Fluorescence Resonance Energy Transfer (FRET)
High-sensitivity methods are increasingly important in biology and medicine, which fields expected to deliver major advances in molecular diagnostics, therapeutics, molecular biology and bioengineering. Among them, on such advance that is currently being realized, fluorescence resonance energy transfer (FRET) depends and is highly sensitive to the proximity changes, distances, orientations and dynamics properties, which represents a powerful monitoring/reporting mechanism for intra- and intermolecular binding events, both in vitro and in vivo.26 FRET is defined as the nonradiative transfer of the excited-state energy from a donor fluorophore to an acceptor molecules. The efficiency of FRET depends on the level overlaps of spectrums between emission of the donor (called D) and absorption of the acceptor (called A). This physical transfer of energy usually takes place over a D-A separation of 0.5-10 nm. A Coulomb charge-charge interaction between the D and A molecules takes place electrodynamically through space, as a dipole-dipole interaction.
Nowsdays, many biosensing models have been carried out by the exploitation of nanoparticles, flouophore, and fluorescence protein labeling in FRET system to monitor the intra-or inter-molecular interaction, such as PNA/dsDNA,27 protein folding,28 protein-ligand interaction,29 etc.
Several groups have been investigated the application ofFluorescence resonance energy transfer (FRET) to luminescent QDs.30-31 Colloidal semiconductor nanocrystals or quantum dots (QDs) have several unique optical and spectroscopic properties,32-33 including size-dependent tunable photoexcitation and emission with narrow and symmetric luminescence spectra. Advances in achieving surface passivation and additional confinement of excitonic states by overcoating the native core with a thin layer of high band gap semiconductor improves the fluorescence quantum efficiency substantially, with resulting core-shell QDs having photoluminescenct (PL) quantum yields comparable to organic dyes.34-35 In this study, CdSe/ZnS/PDDA nanoparticles was synthesis as energy donors in conjunction with organic dye acceptor to develop FRET interactions that can be quantitatively and simultaneously detected. KSI protein was first self-assembled on QDs surface to recognize with the cholic acid derivative due to the hydrophobic interaction. The cholic acid derivative was presented by the conjugation of cholic acid and 5 (6)-carboxy-tetramethylrhodamine (dye acceptor, TMR) in this QDs-based FRET system. The following discussion demonstrates the potential development of cholic acid bioassay system.
Chapter 2
Dependence of an intramolecular Protein-Ligand interaction for the
construction of steroids sensing model
Abstract
The novel steroid-sensing model was constructed by intramolecular binding of a ligand through an alkyl linker ((-CH2)3) covalently bonded to a residue in the
proximity of the active site of the protein. A genetically engineered △5-3-ketosteroid isomerase (KSI) was designed to conjugate uniquely with this ligand at its Cys-86 by the formation of disulfide bond. The steady-state protein-ligand binding, mediated by hydrophobic interactions, was confirmed by fluorescence spectroscopy and the identification of fluorophore-labeled peptides sequence using LC/MS/MS analysis. The comparison of steady-state fluorescence spectra of various fluorophore-labeled proteins revealed that the emission characteristics varied with the change in environmental factors. Furthermore, the evaluation of fluorescence anisotropy decay of the fluorophore suggested the existence of the intramolecular protein-ligand binding interaction. The time-resolved fluorescence anisotropy studies of the different protein-ligand complexes yielded various values of anisotropy decay representing the degrees of freedom of the fluorophore in accordance to its location, inside or outside the steroid binding domain. When a steroid, 19-norandrostendione, was added to this protein-ligand system, a competitive binding between the ligand and the steroid was observed. This finding confirmed the feasibility of the design on steroid detection by engineered KSI.
2-1. Introduction
Protein-ligand interaction can be understood by studying how the protein structure influences the thermodynamic parameters of the binding ligand. In general, not only hydrophobic interactions but also differences in hydrogen bonding, van der Waals and electrostatic interactions as well as conformational changes determine the thermodynamics of protein-ligand interactions. Such insights might prove to be valuable while designing new probes in chemical proteomics,36-40 which seeks to define protein function and mechanism at the level of directly observable protein-ligand interactions.
Recently, a complex intramolecular protein-ligand system with a linker that connects the binding moieties of a multivalent ligand to a multivalent protein was constructed and discussed.29 This study of protein-ligand interaction built up the conserved mode of binding of benzene sulfonamide derivative to human carbonic anhydrase II (HCA, EC 4.2.1.1), which has been well-established by X-Ray crystallography. They reported the dissociation constants and effective molarities for the intramolecular binding of a ligand which was covalently attached to the surface of a protein by oligo(ethylene glycol) linkers with different lengths and compared the fluorescence quenching yields of the Trp residues of the enzyme with theoretical estimates from polymer theory. In fact, this model was originally proposed by Gargano.41 They used their theoretical model for the calculation of enhancement in binding due to multivalency and the strong multivalent binding of a synthetic glycopolymer to a soluble receptor, E. coli. Shiga toxin.
In this paper, the application of a steroid recognition system, which is constructed by intramolecular protein-ligand interaction (shown in Figure 2-1), is discussed.
Figure 2-1. The simulated construction of protein-ligand intramolecular interaction.
The hydrophobic effect lies at the heart of many biomolecular recognition processes to describe noncovlent interactions between molecules, which encompass sequestration, catalysis, drug-receptor interaction and sensing.40 An important function of the steroid hormones is to coordinate the physiological and behavioral responses for specific biological purposes. In the pharmaceutical, physiological and clinical tests, steroid hormone assays were based on the complex chemical or enzyme catalytic reactions monitored by optical, electrochemical, chromatography or mass detection platforms.1-10 Especially, the production of coating steroid antigens for the use in immunoassay which is essential for the development of steroid analysis.7-10 However, the time-consuming nature and the prohibitive costs involved in the preparation of complex antibody or receptor are amongst the factors which restrict the development of ELISA-liked assays.
This bioaffinity steroid model was constructed from △5-3-ketosteroid isomerase (KSI) and a hydrophobic ligand which was modified naphthalene sulfonamide derivative with one alkyl chain. The engineered KSI was designed to use as the biological component, and the ligand was tethered uniquely to Cys-86 by the formation of a disulfide bond in the proximity of the steroid binding domain. The
major driving force favoring this association is generally thought to be the hydrophobic effect which prompted the hydrophobic ligand to bind with the protein. The thermodynamics of protein-ligand binding can be changed by a favorable control in enthalpy and, particularly in this model, the characteristic “entropy-driven” thermodynamic signature of the steroid. The presence of various concentrations of steroids could affect the binding ratio of this ligand with KSI. The reduction in the binding ratio of the ligand will result in the increasing quantities of ligand being pushed out of the steroid binding domain.
This bio-affinity steroids model was successfully applied on silicon nanowires of field effect transistor (SiNW-FETs) to sense 19-norandrostendione (19-NA) by the immobilization of designed molecules complex. In this paper, time-resolved fluorescence anisotropy technique was used to demonstrate the construction of bio-affinity steroids model by determining the environmental effect of the probe. An ideal fluorescence conjugation for protein interaction assays is useful to explore the molecular environments by the absolute photo-physical parameters of the fluorescence emission. It is usual to quantify protein interactions by the measurements of polarization, lifetime, average energy and quantum yields. The anisotropy decay measurements monitor the reorientation of the emission dipole during the lifetime of excited state and can throw light on the local fluorophore motion, segmental mobility or rotation of an entire macromolecule. The molecular dynamics simulations for our steroid hormones sensing model was determined by the measurements of rotational freedom of probe.
2-2. Materials and Methods
2-2-1. Experimental design.
The wild type KSI is a dimeric protein containing 125 amino acid residues, with no cysteine and tryptophan, in each subunit. KSI catalyzes the isomerization of △5-3-ketosteroids to △4-3-ketosteroids by the stereo specific intramolecular proton transfer from steroid 4β-proton to the 6β-position at a rate approaching the diffusion limit.14,42,43 Structure inspection revealed that a hydrophobic cavity for catalysis and for steroid binding was found in each subunit of KSI.
To eliminate the possibility of multi-labeling and the complex orientation evolving from ligand conjugation and further protein immobilization (a subject for other study), we incorporated eight mutant sites: Y55F, K60R, F86C, F88G, K92R, K108R, K119R, and A125K into the wild type protein. This engineered protein is designated as Art_KSI in the following text. At the same time, the precursor of switching mediator, named as mA51-mA51, was synthesized by coupling two molecules of 5-(2-aminoethylamino)-1-naphthalenesulfonic acid (1,5-EDANS) with 4,4′-Dithiodibutyric acid, which was shown in Figure S1 and S2. The Cys-86 residue, which is close to the steroid binding domain, was designed to react with the mA51-mA51 through the thiol substitution to from a new disulfide bond between protein and ligand (mA51). The resulting protein is called Art_KSI/mA51 in this study. In addition, the fluorescence probe, 5-[2-(Iodoacetamido)ethylamino] naphthalene-1-sulfonic acid (1,5-I-AEDANS, designated as I-14 for convenience), labeled individually on the internal and external residue of KSI mutants, such as Y14only and mKSI_126C respectively, to simulate the intramolecular interaction of Art_KSI-mA51 by steady-state and time-resolved fluorescence spectra. The probes were attached extrinsically to the different positions in KSI, and indicated the
dynamics of probe in protein by the evidence of fluorescence anisotropy decay.
In summary, three KSI mutants were constructed for this study: the Y55F/Y88F,
the Y55F/Y88F/D38N/D99N/126C, and the Y55F/K60R/F86C/F88G/K92R/K108R/K119R/A125K, which were named as
Y14only, mKSI_126C, and Art_mKSI, respectively. Two fluorescence probes, I-14 and the synthetic mA51-mA51, were used as labeling reagent for KSI mutants. The resulting proteins were designated as Y14only/I-14, mKSI_126C/I-14, and Art_KSI/mA51 correspondingly.
2-2-2. KSI gene construction.
The artificial gene of wild type KSI and Art_KSI were constructed by PCR amplification using 4 sets of forward and reverse primers (shown in Table 2-1). The sequences of primers for Art_KSI gene (not shown for wild type KSI) were provided as supplementary data. A fragment of DNA with 375 bp was obtained and further inserted into a TA cloning vector (Yeastern Biotech Co. Taiwan). Several positive clones were identified, and the plasmid DNA from one of these clones was digested with Nde I and BamH I. The fragment was subcloned into pRSET A for expression. The Y55F/Y88F, a double mutant of KSI, was constructed from the wild type KSI by QuikChange PCR method (Stratagene Co, USA). This mutant protein was named as Y14only, which contained only single tyrosine residue in protein. We further made one other mutant protein, based on Y14only, with two more mutant sites (D38N and D99N) and added an extra cysteine residue at the C-terminus. This mutant KSI (Y55F/Y88F/D38N/D99N/126C) was named as mKSI_126C for convenience.
Table 2-1. The sequences of primers for the construction of Art-KSI gene.
Primer Sequence
Primer 1 5’-CCG GTA CGG CTG CGA TTC GTG AGT TTT TCG CCA ACT CGC TCC GCC TGC CTT TGG CGG TGG AGC TG-3’
Primer 1r 5’-GCC TTT GGC GGT GGA GCT GAC GCA GGA GGT ACG CGC GGT ACG CGC GGT CGC CAA CGA AGC GGC CTT CGC TTT CA-3’
Primer 2 5’-CCG ATG ACG CCA CGG TGG AAG ACC CCG TGG GTT CCG AGC CCA GGT CCG GTA CGG CTG C-3’
Primer 2r 5’-GGC CTT CGC TTT CAC CGT CAG CTG TGA GGG TCA GGG CCG CCG CAC CGT GGT TGC GCC CA-3’
Primer 3 5’-TGC GCT CAA TGC CGG CGA TCT GGC CGG CAT CGT CGC GCT GTT TGC CGA TGA CGC CAC GG-3’
Primer 3r 5’-CGT GGT TGC GCC CAT CGA TCA CTT TCG CTT CAA TGG CGC CGG CCG CGT GGT GAG CAT GC-3’
Primer 4 5’-CCA TAT GAA TAC CCC AGA ACA CAT GAC CGC CGT GGT ACA GCG CTA TGT GGC TGC GCT CAA TG-3’
Primer 4r 5’-GCG TGG TGA GCA TGC GCG CCT TGT TTG GCG AGA AGA ATA TTC ACG CTG GCA AAT GA-3’
2-2-3. Protein expression and purification.
The pRSET A vector containing KSI gene or its mutants were expressed in E.coli strains BL21 (DE3). All proteins were obtained through the procedures described as follows. After 16 hours of induction at 28 oC, 1 liter of bacteria culture was harvested by centrifugation and further re-suspended in 15 ml of phosphate buffer (20 mM, pH 7.5). Cells were disrupted by ultra-sonication. Precipitant containing crude enzyme was obtained from supernatant by treating with ammonium sulfate up to 50% of saturation. The crude enzyme was further re-suspended in 10 ml phosphate buffer (20 mM, pH 7.5). After desalting, the sample solution (10 ml) was loaded onto HiTrap Q column (30 ml, Pharmcia Co.) for chromatographic separation. The column was eluted with phosphate buffer (20 mM, pH 7.5) at a flow rate of 1 ml/min and a 2.5 mM/min linear gradient of NaCl. KSI was eluted in the range of 50 mM - 75 mM of NaCl. The protocol for protein purification is also appropriate for other KSI mutants. The quality of the purified proteins was examined by SDS-PAGE as well as LC/MS.
2-2-4. Kinetic analysis and steady-state fluorescent study.
The protein concentration was determined based on the method described in literature.44 Enzyme activity was assayed by measuring the conversion of △5-androstene-3,17-dione to △4-androstene-3,17-dione in 50 mM Tris-HCl (pH 7.5) at 25 °C. The reaction was monitored at 248 nm by UV-visible spectrometer. Km and
kcat values were calculated by using Lineweaver-Burke plot. The dissociation
constants (Kd) of steroids on Y14only were measured by examining the change of
tyrosine fluorescence (λex=278 nm and λem= 310 nm) in the presence of steroids.
Experiments were performed in Tris-HCl (50 mM, pH 7.5) containing 0.1 mM KSI and suitable amount of steroid.
2-2-5. The chemical modification and pepsin digestion of KSI.
All labelling reactions were carried out at 4 °C, for 12 hr in Tris-HCl buffer (50 mM, pH 7.5) containing 0.1 mM enzyme and 1 mM labeling reagent. Further, the excess labelling reagent will be removed by dialysis or ultra-filtration. The efficiency of labelling reaction was evaluated by LC/MS. KSI (100 μl; 3.5 μg/μl) and pepsin (40 μl; 0.5 μg/μl in sodium phosphate, 2.0 M, pH 1.7) was then incubated at 25°C for 30 min. Control digestion on unlabelled enzyme was carried out under identical conditions. The candidate labeled peptide was then isolated by HPLC using MS detection as described below.
2-2-6. Mass spectrometric analysis.
Mass spectra were recorded using a quadrupole time-of-flight mass spectrometer (ESI-Q-TOF, Micromass, Manchester, UK). Proteins used for molecular mass measurement were desalted forms and normally within the range of 5-10 µg. Peptides were separated by reversed-phase HPLC interfaced with mass spectrometer. The pepsin hydrolysate of (I-14)-labelled KSI or control enzyme were loaded on to a C18 column (PLRP-S 100Å, 5 μm, 150 x 4.6 mm, Polymer Laboratories) and eluted
with a gradient of 2-50% acetonitrile (contained 0.02% formic acid) in 60 min at a flow rate of 0.8 ml/min. A post-column flow splitter was used to direct 90% of the sample into a fraction collector, while the remainder was sent to mass spectrometer and analyzed by mass and or tandem mass. The ESI-Q-TOF system was presented a mass-to-charge ratio range of 100-2000 atomic mass unit (m/z) by a scan step of 2 seconds and a inter scan of 0.1 s/step. Further, the quadrupole scan mode was under an electrospray voltage of 3 kV, and the block temperature was at 80 °C.
2-2-7. Time-Resolved Fluorescence Anisotropy.
Picosecond temporally resolved spectra were obtained with a time-correlated single-photon counting (TCSPC) system (Fluotime 200, PicoQuant). The experimental details can be found elsewhere.45 The excitation source was provided by a 375 nm picosecond pulsed-diode laser (LDH-375, Picoquant, FWHM~70 ps), controlled by a picosecond pulsed laser driver (PDL800-D, Picoquant). The excitation laser was focused onto the sample holder by a lens. Another lens collected the fluorescence emitted from the sample at a right angle. An iris was used to attenuate the intensity of the detected signal, and a polarizer selected the polarization of the detected fluorescence relative to the excitation laser pulse. A double monochromator compensated the GVD of fluorescence and selected the detection wavelength; the resolution was 8 nm with a 1-mm slit. A micro-channel-plate photomultiplier was connected to a computer with a TCSPC-module (SPC-630, Becker and Hickl) card for data acquisition. All measurements were made in 50 mM Tris-HCl at pH 7.5.
2-3. Result and Discussion
2-3-1.The catalytic activity of Art_KSI and the binding affinities toward steroids.
The Art_KSI protein was successfully purified by anion exchange column and its quality confirmed by sodium dodecyl sulfate-polyacrylamide gel electrophoresis (Figure 2-2). The precise molecular weight determined by LC/MS analysis showed the m/z= 13402 (M+H+), which was consistent with the molecular weight calculated from the amino acid composition of Art_KSI. Art_KSI enzyme possesses substantially activity with the value of kcat/Km = 1.12x10⁷ (M-1s-1) (Table 2-2).
Figure 2-2. SDS-PAGE analysis of protein purity. Land 1 shows the protein marker
and Lane 2 is Art_ KSI protein produced in E. coli, and purified on an anion exchange column.
Table 2-2. Michaelis-Menten parameters of different KSI mutants
Since the Art_KSI contains no tryptophan and only one tyrosine, i.e. Tyr-14, present in the steroid binding site, Art_KSI exhibits unique fluorescence emission to describe the protein-steroid binding interaction. The dissociation constants (Kd) of
KSI-steroid complex was determined by the quenching yield of tyrosine fluorescence at λem= 307 nm (λex= 278 nm). Several Kd values were listed in Table 2-3. Among
those steroids, 19-norandrostendione presents the strongest interaction with Art-KSI (Kd= 10.9 μM) with a binding energy of 6.75 Kcal/mol. On the other hand, 1,
5-EDANS showed much weak binding to Art_KSI with a Kd value of 350 μM.
Table 2-3. Dissociation constant of steroid derivatives.
2-3-2. Identification and sequencing of the peptide labeled with I-14.
α-Halo acid or amide reagents (such as iodoacetic acid or iodoacetamide) are among the most frequently used reagents for thiol-modification in protein chemistry. In most proteins, the site of reaction is the cysteine residues. Note that, there is no cysteine residue present in the wild type KSI. However, interestingly, when Y14only was treated with I-14, a stoichiometric and covalent label was observed by LC/MS analysis (Figure 2-3A).
Figure 2-3A. LC/MS analyses on the chemical modification of KSI. The species with
a molecular mass of 13978 Da corresponds to the Y14only (13672 Da.) plus the moiety of 5-[2-(acetamido)ethylamino]naphthalene-1-sulfonic acid (306 Da).
The molecular weights of Y14only before and after chemical modification are 13672 Da and 13978 Da. The 306 amu increase confirmed the successful attachment of the moiety of 5-[2-(acetamido)ethylamino] naphthalene-1-sulfonic acid on KSI. It is reasonable to assume that a specific nucleophile in KSI is accessible in order for the substitution reaction to take place. Further, proteolytic digestion combining with an extensive LC/MS/MS analysis on sequencing the (I-14)-labeled peptide were employed to resolve the target residue of labeling. As shown in Figure 2-3B, the total ion chromatogram of the digest of the (I-14)-labeled Y14only exhibited a large number of peaks. Each peak corresponds to at least one peptide in the digest mixture. The labeled peptides were located within the chromatogram by comparison of the peptides present within digests of labeled and unlabeled Y14only, using 335 nm absorption wavelength of I-14 to confirm the locations of the peptides of interest. The shaded region (retention time within 17-19 min) contains the (I-14)-labeled fragment.
Figure 2-3B. LC/MS analyses on the chemical modification of KSI. Y14only labeled
with I-14 followed by pepsin digestion and HPLC separation. Through comparison with the control digest, the shaded portion was found to contain the labeled fragment (retention time 17-19 min).
The doubly-charged peptides of m/z = 975.8 and 822.6 were obtained by RP-HPLC separation of the labeled and unlabelled samples, respectively. The mass difference of the two fragments at the singly-charged state is 307 amu, which is consistent with the labeling moiety. Both fragments were subjected to MS/MS analysis and yielded the spectra shown in Figure 2-4.
Figure 2-4A. MS/MS analysis of the peptide labeled with I-14. MS/MS daughter-ion
spectrum of the unlabelled peptide (m/z 822.6 in the doubly-charged state).
Figure 2-4B. MS/MS analysis of the peptide labeled with I-14. MS/MS daughter-ion
The presence of b-ion and y-ion unequivocally confirmed the sequence of the unlabelled peptide as ATVEDPVTGSEPRSGTAA, corresponding to residues 34-51 of Y14only. Identification of the point of attachment of the probe moiety was achieved through inspection of the daughter ions of (I-14)-labeled peptide (m/z = 975.8, doubly charged). By comparing a series of b-ion and y-ion derived from both fragments (Figure 2-4C), we were able to conclude unequivocally that the moiety of 5-[2-(acetamido)ethylamino] naphthalene-1-sulfonic acid was covalently labeled on the Asp-38 residue. Although other effects may assist the labeling reaction of I-14, the hydrophobic nature existing in the active site of KSI was considered to play a major role, for which it not only promoted the driving force for I-14 binding but also enhanced the nucleophilicity of Asp-38 to react with I-14.
Figure 2-4C. MS/MS analysis of the peptide labeled with I-14. Rationalization of the
observed singly-charged y- and b-ions with the pattern of amino acid sequence of the expected peptide.
2-3-3. The comparison of the fluorescence polarization factors of the labeled KSI
mutants
In order to explore the fluorescence polarization factors of I-14 in KSI, we utilized two mutant proteins: Y14only and mKSI_126C. Depended on the specific labeling residues designed, we could easily control the fluorophore to label in active site or on the surface of protein. For instance, the mKSI_126C was designed for conducting the I-14 labeling on the surface of protein. This labeling reaction is presumably through the nucleophilic attack of Cys-126, which is the C-terminus of the protein and is structurally predicted to exposes on the surface. The steady state emission spectra of I-14 in various environments have been performed to mimic the various environmental conditions. The results are shown in Figure 2-5. The samples of I-14 in Tris buffer and in isopropyl alcohol (IPA) were used to simulate the hydrophilic and hydrophobic environment, respectively.
Spectra were indicated as follows: I-14 in 100% IPA solution (▼), I-14 in 60% IPA solution (▲), I-14 in 20% IPA solution (●), and I-14 in 0% IPA solution (■). Note that H2O was used to compensate the percentage of IPA.
In all cases, the absorption band was centered at ~335 nm. However, the emission spectra of I-14 in Tris buffer and in IPA were significantly different. In hydrophilic environment the emission was centered at ~500 nm, whereas the emission spectra blue-shifted to ~450 nm in hydrophobic condition (IPA). Therefore, this spectral shift can be used as an indicator for the local environment in which the fluorophore exists. In mKSI_126C/I-14, the only accessible reaction site was Cys-126 of the protein, and it was expected that the emission spectra should similar to that in Tris buffer. As shown in Figure 2-6, the emission spectrum of mKSI_126C/I-14 was centered at ~500 nm with a shoulder at ~475 nm. This result supports that the moiety of 5-[2-(acetamido)ethylamino] naphthalene-1-sulfonic acid is surrounded by a hydrophilic environment; however the shoulder at ~475 nm indicated that the local environment of the 5-[2-(acetamido)ethylamino] naphthalene-1-sulfonic acid moiety is somewhat less hydrophilic due to the hydrophobic shell of the entire protein. The emission spectrum of Y14only/I-14 is centered at ~450 nm, which is similar to the emission spectrum of I-14 in IPA. This result strongly supported that the fluorophore was buried in a hydrophobic environment.
On the other hand, the steady-state fluorescence spectrum of Art_KSI-mA51 was shown to center at ~475 nm (Figure 2-6). As we added the 30 μM 19-norandrostendione into this system, the fluorescence emission became red-shifted and centered at ~500 nm. It indicated that the ligand and steroid binding domain existed on thermodynamic equilibrium. But, the equilibrium of
association/dissociation was disrupted by competition inhibition because of 19-norandrostendione contains the bigger absolute association energy than mA51, which causes the more population of mA51 to be exposed to the polar environment and results in the increasing intensity of fluorescence emission at ~500 nm.
Figure 2-6. The emission spectra of KSI mutants labeled with I-14. Spectra were
indicated as follows: Y14only/I-14 (■), mKSI_126C/I-14 (●), Art_KSI/mA51, and Art_KSI/mA51 treated 30 μM 19-norandrostendione (○). All emission spectra obtained in Tris HCl buffer (50 mM, pH 7.5).
2-3-4. Fluorescence anisotropy decays of I-14 in KSI mutants.
According to the steady-state results abovementioned, the binding site of I-14 in Y14only_KSI was determined to be inside the hydrophobic cavity. In order to confirm
350 400 450 500 550 600 -20 0 20 40 60 80 100 120 140 160 180 200 F lour es cence int e nsit ies nm
this result, we measured time-resolved fluorescence anisotropy to obtain the depolarization kinetics for the rotational Brownian motion of the fluorophore in various biological environments. In a TCSPC experiment, the fluorescence anisotropy decay can be determined with the following equation 46-47:
VV VH VV VH I (t) G I (t) (t) I (t) 2 G I (t) r = − × + × × (1)
where the G factor is the compensation for the polarization dependence of the monochromator grating, optics, and detector. By definition, G = IHV/IHH, where IHV
and IHH represent the intensities of fluorescence excitation with horizontal polarized
light and monitoring at vertical and horizontal polarizations, respectively. Similarly, IVV and IVH represent the intensities of fluorescence excitation with vertically
polarized light monitored at vertical and horizontal polarizations, respectively.
The fluorescence anisotropy decay curves of I-14 only, I-14 in Y14only_KSI and I-14 in mKSI_126C are shown in Figure 2-7, respectively. The observed time-dependent anisotropy curves all decay to zero background at longer times and they can be well described by a single-exponential (free isotropic rotation) or bi-exponential (free anisotropic rotation) decay function with the rotational time coefficients as indicated in the figures. For I-14 only in Tris buffer, the rotational time coefficient is 0.15 ns, while for I-14 in Y14only_KSI, the rotational time coefficient increases by two orders of magnitude (14.8 ns). The single-exponential decay feature of the system indicates a purely isotropic orientation relaxation that reflects the size of the system. According to Perrin’s equation, the rotational correlation time coefficient (τ) for a spherical molecule is proportional to the hydrodynamic molecular volume of the fluorophore (V) and can be represented using the following equation46:
V RT = η
where η is the viscosity of the medium, T is the absolute temperature (fixed at 298 K) and R is the gas constant. As a result, the hydrodynamic radius of I14 only and I14 in Y14only_KSI can be estimated to be 5.5 and 25.4 Å, respectively.
In the case of mKSI_126C/I-14, where the fluorophore I-14 is expected to be labeled on the surface of the protein molecules, the time-dependent fluorescence anisotropy was observed to feature a bi-exponential decay with rotational time coefficients of 0.28 ns (amp1) and 12.6 ns (amp2). The observed two-component anisotropic decay feature is consistent with the rotational relaxation being mainly due to the rotation of the mKSI_126C molecule and the segmental motion of the fluorophore outside the protein. However, the contribution of the latter is much larger than that of the former. Because I14 was labeled on the surface of the protein, it is reasonable to observe that the fast-decay component corresponding to the segmental motion of the fluorophore outside protein becomes dominant in the observed depolarization curve. Furthermore, the rotational relaxation time of I14 on the surface of mKSI_126C is substantially longer than that of free I14 in Tris buffer solution (0.28 vs. 0.15 ns), indicating the significance of the restricted motion of the fluorophore affecting the observed depolarization kinetics.
Figure 2-7. Time-resolved fluorescence anisotropy decay of I-14 in (A) I14 in Tris
buffer , (B) Y14only/I-14 and (C) mKSI_126C/I14. The raw data are shown as open circles and the fitting results are represented by solid curves.
2-3-5. Fluorescence anisotropy decays of mA51 moiety in Art_KSI/mA51
According to the results of Figure 2-7, we understood the anisotropy behaviors of fluorophore in protein active-cavity or labeled on surface of KSI are different. When the fluorophore bound with long-chain in the KSI, the fluorophore can changes its orientation between inside and outside. The relative population of a
fluorophore-KSI which exists in two different environments displays complex kinetics. The observed time-dependent anisotropy, r (t)obs, of Art_KSI/mA51 was fitted by the following equation:
r (t)
obs= x×r
inside(t) + (1-x)×r
outside(t)
= r
01×x× exp(-t/τ
1)+(1-x)×r
02×[f×exp(-t/τ
2)+(1-f)×exp(-t/τ
3)]
(3) According to the extinction coefficients at λ=375 nm and lifetimes monitored at 500 nm of two type of orientations are the same, the observed time-dependent anisotropy is a sum of these two components weighted by their corresponding intensities. The physical meaning of equation 3 is obvious: the anisotropy component resulting from the rotational relaxation decay of mA51 molecule inside the Art_KSI, whereas the other component resulting from the rotational relaxation decays bi-exponentionally of mA51 outside the KSI as expressed in Figure 2-8. x and (1-x) are the relative corresponding intensity of mA51 inside and outside the KSI cavity, respectively. 1
0 r
and 2 0
r are fundamental anisotropy values of two type orientations. Based on Figure 2-7 results, τ1 is 16.2 ns fixed by a KSI-Y14 rotational diffusion time which is
calculated by a hydrodynamic radius (25.4 Å), and τ2 and τ3 are also fixed by
mKSI-126C rotational diffusion time which are 0.27 and 13.4 ns, respectively. The f and (1-f) are the fractions of species for the anisotropy with τ2 and τ3, respectively.
The Figure 2-8 shows the fundamental anisotropy values of Art_KSI/mA51. The different fundamental anisotropies demonstrate the geometries of the fluorophore molecules in two different conditions are slightly altered by the protein and solvents. The ratio of mA51 molecule inside to outside Art_KSI protein is 0.33 (0.25/0.75), therefore the mA51 molecule interact more strongly with solvents than protein in Art_KSI/mA51 system without any steroid derivatives.
Figure 2-8. Time-resolved fluorescence anisotropy decay of mA51 in Art_KSI.
2-4. Conclusion
The hydrophobic interaction prompted I-14 into steroid-binding site in conjugation with Asp-38. This interaction between Y14only_KSI and I-14 as well as identification of the site of I-14 labeling was confirmed by steady-state fluorescence and MS measurements. The Art_KSI was constructed to evaluate the feasibility of bioaffinity system for steroid detection. This new steroid-recognition model was successfully constructed by specifically conjugating the switching ligand to the Cys-86 of Art_KSI through the disulfide bond formation. The comparison between the steady-state fluorescence of Y14only_KSI/I-14, mKSI_126C/I-14 and Art_KSI/mA51 indicated the levels of fluorescence polarization of the fluorophore in various environments. The time-dependent fluorescence anisotropy studies on mA51 were employed to probe the environment around it. The anisotropy revealed that the mA51 on Art_KSI/mA51 exists both inside and outside of the steroid-binding cavity with 25% of the mA51 inside the protein cavity. Furthermore, the steady-state
fluorescence spectra demonstrated that 19-NA competed with mA51 for the binding sites and the population of mA51 in the steroid-binding site perturbing by 19-NA was also manifested by a small red-shift.
Chapter 3
Detection of non-charge analytes by SiNW-FETs
Abstract
This study demonstrated a non-charged steroid, 19-norandrostendione, was successfully detected by a device of silicon nanowire field effect transistor (SiNW-FETs) with sensitivity approaching to sub-femto molar. To fabricated the device, a genetically engineered △5-3-ketosteroid isomerase, functioning as steroid acceptor, was chemically modified by a carbon chain linked 1, 5-EDANS moiety, functioning as reporter, prior to immobilization on SiNW. The electrical response resulted from the exposed 1, 5-EDANS moiety when steroid replaced it in the steroid-binding site.
![Figure 1-5. (A) The surface of SiO 2 has been subsequently actived by N-[3-(trimethoxysilyl)propyl]ethylenediamine ( AEAPTMS) and Bis(sulfosuccinimidyl) suberate (BS3)](https://thumb-ap.123doks.com/thumbv2/9libinfo/8113208.165611/23.892.157.781.472.903/figure-surface-subsequently-trimethoxysilyl-ethylenediamine-aeaptms-sulfosuccinimidyl-suberate.webp)
![Figure 2-3A. LC/MS analyses on the chemical modification of KSI. The species with a molecular mass of 13978 Da corresponds to the Y14only (13672 Da.) plus the moiety of 5-[2-(acetamido)ethylamino]naphthalene-1-sulfonic acid (306 Da)](https://thumb-ap.123doks.com/thumbv2/9libinfo/8113208.165611/39.892.187.729.99.368/analyses-modification-molecular-corresponds-acetamido-ethylamino-naphthalene-sulfonic.webp)