1
行政院國家科學委員會專題計畫期末報告
計畫名稱:台灣學生網路相關著作權、學術寫作倫理課程之發展與評
量研究
執行期限:101 年 8 月 1 日至 102 年 10 月 31 日
計畫編號:NSC 99-2511-S-009 -006 -MY3
主持人:周 倩
執行單位:國立交通大學教育研究所
On: 23 April 2013, At: 16:47 Publisher: Routledge
Informa Ltd Registered in England and Wales Registered Number: 1072954 Registered office: Mortimer House, 37-41 Mortimer Street, London W1T 3JH, UK
Chinese Journal of Communication
Publication details, including instructions for authors and subscription information:http://www.tandfonline.com/loi/rcjc20
Tool, toy, telephone, territory, trade,
or treasure of information: a
cross-sectional study of Taiwanese students'
attitudes toward the Internet
Chou Chien a , Wu Huan-Chueh a & Chen Chao-Hsiu a
a
National Chiao Tung University, Taiwan Version of record first published: 23 Apr 2013.
To cite this article: Chou Chien , Wu Huan-Chueh & Chen Chao-Hsiu (2013): Tool, toy, telephone,
territory, trade, or treasure of information: a cross-sectional study of Taiwanese students' attitudes toward the Internet, Chinese Journal of Communication, DOI:10.1080/17544750.2013.785671
To link to this article: http://dx.doi.org/10.1080/17544750.2013.785671
PLEASE SCROLL DOWN FOR ARTICLE
Full terms and conditions of use:
http://www.tandfonline.com/page/terms-and-conditions
This article may be used for research, teaching, and private study purposes. Any substantial or systematic reproduction, redistribution, reselling, loan, sub-licensing, systematic supply, or distribution in any form to anyone is expressly forbidden.
The publisher does not give any warranty express or implied or make any representation that the contents will be complete or accurate or up to date. The accuracy of any
instructions, formulae, and drug doses should be independently verified with primary sources. The publisher shall not be liable for any loss, actions, claims, proceedings, demand, or costs or damages whatsoever or howsoever caused arising directly or indirectly in connection with or arising out of the use of this material.
Tool, toy, telephone, territory, trade, or treasure of information:
a cross-sectional study of Taiwanese students’ attitudes toward
the Internet
Chou Chien*, Wu Huan-Chueh and Chen Chao-Hsiu National Chiao Tung University, Taiwan
The purposes of this study are to investigate different levels of Taiwan students’ attitudes toward the Internet according to a 6-T model, and to understand possible factors associated with differences among these attitudes. This study adopts a cross-sectional design to collect data from 1,700 surveys completed by Taiwanese fifth graders, eighth graders, 11th graders, and college sophomores. Through a confirmatory factor analysis, this study validates the 6-T model and shows that it can help explain the six factors – Tool, Toy, Telephone, Territory, Trade, and Treasure of information – that are critical to Internet attitudes. This study found that the Tool and Toy factors yield the greatest recognition among Taiwan students, while the Trade factor seems to yield the least recognition among all grade groups. The results also indicate that as students grow older, they have increasingly positive attitudes toward the Internet. In addition, students’ motivation to use the Internet and their weekend time-on-Internet can predict their attitudes toward the Internet. Implications of these results are also discussed. Keywords: Taiwan students; attitudes toward the Internet; cross-sectional comparison; 6-T model; confirmatory factor analysis
Introduction
As network technology continues its explosive growth, the Internet continues to become an important part of students’ lives. Computers and the Internet can serve as powerful tools and rich information resources for academic work and life in general. In Taiwan, students usually start their first computer/network course in third grade (about 9 years old), and continue throughout their senior high school year (about 16 – 17 years old). The Taiwanese education system has introduced the Internet as a powerful tool and a rich information resource highly applicable to students’ learning and life routines, but has rarely introduced the Internet as a toy or encouraged students to use the Internet as such.
However, because by the end of 2010 almost 100% of all Taiwanese schools and 77.0% of all Taiwanese families had Internet access (Taiwan Network Information Center, 2010), Taiwan students nowadays have easy access to the Internet and are able to use a variety of Internet applications for many purposes. The Internet seems to have played multiple roles in their perceptions and lives. By understanding students’ attitudes toward the Internet, not only researchers but also parents and teachers can help students achieve beneficial online experiences.
Past research on Internet attitudes has focused only on a specific level of students: chiefly college students (e.g., Chou, Wu, & Chen, 2011; Duggan, Hess, Morgan, Kim, &
q 2013 The Centre for Chinese Media and Comparative Communication Research, The Chinese University of Hong Kong
*Corresponding author. Email: [email protected]
Wilson, 2001; Durndell & Haag, 2002; Li & Kirkup, 2007; Liaw, 2002; Peng, Tsai, & Wu, 2006; Schumacher & Morahan-Martin, 2001; Torkzadeh & van Dyke, 2002; Wu & Tsai, 2006), with some studies on high school students (e.g., Tsai, 2006, 2007; Tsai & Lin, 2004; Tsai, Lin, & Tsai, 2001), and a few on children (e.g., Chou, Yu, Chen, & Wu, 2009). There is a lack of cross-sectional comparison; that is, little research compares the Internet-related attitudes of different levels of students in a given time frame. By extending this kind of analysis, researchers can better illustrate the changing roles or weights of the Internet in different age groups.
To adequately illustrate students’ attitudes toward the Internet, researchers proposed various frameworks/models and instruments (e.g., Cheung & Huang, 2005; Duggan et al., 2001; Zhang, 2007). This present study adopted the 6-T model (i.e., Tool, Toy, Telephone, Territory, Trade, and Treasure of Information) proposed by Chou, Wu, and Chen (2011) to investigate the Internet attitudes held by different grade levels of Taiwan students and to understand possible factors accounting for the differences in their attitudes. This study’s specific research questions are as follows:
1. Does the 6-T model of Internet attitudes exhibit good construct validity? 2. Does the 6-T model capture students’ attitudes toward the Internet?
3. Does the grade level of students make any difference in their attitudes toward the Internet?
4. Could students’ Internet-use experiences predict the students’ Internet attitudes?
Literature review
The importance of and frameworks for the study of Internet attitudes
It has been recognized that there is a close relationship between one’s attitudes and one’s behavior. One’s attitudes toward a behavior along with the combination of (1) one’s beliefs about others’ approval of that behavior and (2) one’s motivation for conforming to others’ expectations of one’s behavior collectively shape one’s intention to perform a behavior – and thus lead to the behavioral action itself (Ajzen & Fishbein, 1980). Researchers have stressed the importance of investigating students’ attitudes toward the Internet because, as these researchers argue, student attitudes toward the Internet are highly related to online learning outcomes (e.g., Duggan et al., 2001; Durndell & Hagg, 2002; Peng et al., 2006; Torkzadeh & van Dyke, 2002; Wu & Tsai, 2006).
In order to adequately examine students’ attitudes toward the Internet, researchers need an appropriate framework and valid instruments with which to collect and analyze empirical data. Tsai and his colleagues conducted a series of studies on college and high school students’ attitudes toward the Internet (Peng et al., 2006; Tsai, 2006, 2007; Tsai & Lin, 2004; Wu & Tsai, 2006) on the basis of a 4-T framework proposed in his study (Tsai, 2004). The 4-T framework defined Technology, Tool, Toy, and Tour/Travel as four major categories of Internet perceptions among Taiwanese high school students. In Tsai’s 4-T framework, the Technology category indicates that the Internet has been a technology for life improvement, and the Tool category focuses on using the Internet to acquire information, to communicate with others, and to conduct commercial activities, and so on. The Toy category highlights the pleasure and entertainment afforded by the Internet, and finally, the Tour/Travel category addresses the fact that users navigate to different locations and sites on the Internet.
However, when scrutinizing this framework, Chou et al. (2009) found that some of the definitions for the Ts (such as the definitions of Technology and Tool) are not very clear-cut, that the concept of Tour/Travel is somewhat confusing, and that the framework lacks an important dimension of information resources. Chou et al. (2009) therefore proposed a 5-T framework in which Tool, Toy, Telephone, Territory, and Treasure of Information are the five major constructs. In the 5-T framework, the Tool factor highlights that the Internet can help users perform various tasks (e.g., playing music and downloading files), and the Toy factor focuses on users’ online-game playing. The Internet can serve as a Telephone, enabling users to communicate with others, and more and more people are using the Internet as a personal Territory in which to express themselves (e.g., blogging, Facebook, and online photos). Given its huge collection of online information, the Internet is definitely a Treasure of Information (Chou et al., 2009). In their subsequent study on college students’ Internet-related attitudes, Chou, Yu, Chen, and Wu (2011) added a new dimension, Trade, to reflect the fact that more and more people have been buying and selling goods online. Thus, Tool, Toy, Telephone, Territory, Treasure of Information, and Trade have formed a new 6-T model.
The results of the confirmatory factor analysis (CFA) in Chou et al. (2011) revealed that 55 items listed in the scale for the 6 first-order factors (Tool, Toy, Telephone, Territory, Treasure of Information, and Trade) could be factorized and that the second-order factor (Internet attitude) could be satisfactorily explained by the correlations between the six first-order factors (e.g., the 6-T model). Thus, the new 6-T model is a comprehensive one whose valid and reliable measurements can strengthen future investigation into students’ attitudes toward the Internet.
Students’ use of and attitudes toward the Internet
The Taiwan Network Information Center (2010) reported patterns characterizing Taiwanese people’s broadband network use, and the results show that two age groups (15 – 19 and 20 – 24) have the highest percentages of online users (99.45% and 97.24%, respectively). Therefore, it is obvious that almost all Taiwanese high school students and college students use the Internet. As mentioned in the introduction, most studies on student attitudes toward the Internet emphasize college students, some emphasize high school students, and very few emphasize elementary school students. There seems to be no single study in which different levels of students are investigated together regarding their Internet-related attitudes. In addition, because of students’ different time of exposure to, motivations for using, and usage patterns relative to the Internet, we can propose that elementary school students’ attitudes toward the Internet should be quite different from those of college and high school students. This proposal justifies the significance of the present study.
According to research findings relevant to elementary school students’ time allocation for online activities (e.g., Attewell, Suazo-Garcia, & Battle, 2003; Burnett & Wilkinson, 2005; Mumtaz, 2001; Sjo¨berg, 1999; Valcke, Schellens, van Keer, & Gerarts, 2007), children engage in varied online activities such as gathering school-related information, gathering personal-interest information, chatting, emailing, and online gaming. Whereas most parents and teachers expect children to spend most of their time using the Internet as a tool for school-related learning, children prefer entertaining online activities; namely, gathering personal-interest information,
chatting, emailing, and online gaming (Attewell et al., 2003; Burnett & Wilkinson, 2005; Mumtaz, 2001; Sjo¨berg, 1999).
Previous research on elementary school students’ Internet attitudes is quite limited. Chou et al. (2009) employed the 5-T framework to investigate the Internet attitudes of 2,253 Taiwanese fifth graders and found that the most-recognized roles of the Internet are Tool, followed by Toy and then by Territory, Treasure of Information, and Telephone. The results indicate that the students perceived the Internet’s Toy role as an important one and that they could not clearly distinguish the roles of Tool and Toy from each other. The Territory factor weighed more heavily in the students’ attitudes than did either the Treasure of Information factor or the Telephone factor. It seems that the Internet has become a territory in which elementary school students can present themselves in personal ways.
Not much research has investigated high school students’ Internet use and attitudes toward the Internet. Tsai et al. (2001) gathered data from 753 Taiwanese high school students of both genders and of varying Internet experience to analyze their Internet attitudes within a framework comprised of constructs of affection, usefulness, control, and related behavior. The results indicate that male students reported greater levels of positive feelings, lower levels of anxiety, and higher levels of confidence relative to Internet use than did female students. Additionally, students having high levels of Internet experience exhibited greater levels of positive attitudes than did students having relatively little experience. Using the 4-T framework, Tsai (2006, 2007) and Tsai and Lin (2004) investigated Taiwanese high school students’ perceptions of the Internet and drew the generalized conclusion that high school students see the Internet as a tool and a technology and that male students are more inclined to view the Internet as a toy than are female students.
Researchers also have strived to find relationships among college students’ Internet use, attitudes, perceptions, and other psychological conditions. For instance, Whitty and McLaughlin (2007) found that college students with higher Internet self-efficacy and higher levels of loneliness were more likely to use the Internet for purposes of computer-based entertainment. Joiner, Brosnan, Duffield, Gavin, and Maras (2007) explored the relationships among Internet identification, Internet anxiety, and Internet use in 446 university students in the United Kingdom and Australia. The students with higher Internet identification (i.e., the students who both considered themselves Internet users and considered the Internet an important part of their lives) used the Internet more often and experienced less Internet anxiety.
Chou et al. (2011) employed the 6-T model to investigate the Internet attitudes of 1,061 grade-level college students, and found that the weighted factors from the highest to the lowest for the college students were Tool, Toy, Treasure of Information, Territory, Trade, and Telephone. Graduate students registered higher levels of positive attitudes toward the dimensions of Treasure of Information and Trade than did undergraduate students, and also registered higher levels of positive attitudes toward the Tool dimension than did freshmen and sophomores. Yet, no significant differences were found between graduate and undergraduate students in the dimensions of Toy, Territory, and Telephone. Additionally, undergraduate students of different grade levels presented no significant difference in all six dimensions.
The above-mentioned studies lead to the conclusion that both students’ attitudes toward the Internet and the possible variables influencing these attitudes are research issues worth further investigation. However, these studies all focused on students of a
specific grade level. There seems to be no cross-age comparison that would help us understand the Internet’s changing roles in the attitudes of students at different grade levels.
Methods
Subjects and distribution process
For this study, we used the survey method to collect the cross-sectional data. The following rationales were taken into consideration while making the sample-selection decision. Taiwan students start taking formal computer classes from third grade and, therefore, fifth graders have already taken formal computer courses for two years. We expected that Internet attitudes and Internet use among fifth graders would be stable, so we chose fifth graders to represent elementary school students. With three-year intervals, we sampled eighth graders, 11thgraders, and sophomores; furthermore, a particular point of interest is that eighth graders, 11th graders, and sophomores represent the second-year students of middle school, senior-high school, and college. Thus, we assumed that the sampled students would have comparatively stable Internet-use patterns and Internet-attitude patterns, becaInternet-use these students would be less likely than first-year college students to be adjusting to college life and would be less likely than ninth and 12thgraders to be anxiously preparing for entrance exams.
A total of 2,200 paper-and-pencil questionnaires were distributed to a stratified sample of fifth graders, eighth graders, 11thgraders, and college sophomores. A total of 1,860 usable data were obtained (84.55%), and of them, 1,700 (91.40%) valid data were collected: 432 (25.41%) from fifth graders, 531 (31.24%) from eighth graders, 416 (24.47%) from 11th graders, and 321 (18.88%) from college sophomores. Of all students, 817 (48.06%) were male and 881 (51.82%) were female, with two missing values in the gender part.
Instruments
The questionnaire had three major sections. The first section asked students about their demographic information (gender, age, grade level) and their general computer-use practices, including their online experience (in years), duration of Internet computer-use per weekday (in hours), duration of Internet use per weekend (in hours), and the most-used Internet-use location.
The second section asked students to indicate their Internet-use motivations. There were seven statements: looking for study-related information, looking for daily-life information, looking for entertainment, communicating with others, undertaking self-promotion, buying and selling goods, and downloading software and applications. Students were required to read each statement and to indicate the extent of their agreement on the basis of the options provided on a 4-point Likert scale: strongly agree, agree, disagree, and strongly disagree (counted as 4, 3, 2, and 1, respectively). A higher score would indicate students’ stronger motivation to use the Internet.
The third section was the Internet-attitude scale based on the 6-T model. This section included 56 statements; basically, all of the items came from the scale created by Chou et al. (2011) and one new item was added in Treasure of Information. There were 10 items for Tool (such as “The Internet is a good tool for my studies”), 13 items for Toy (such as “The Internet is my playmate”), 8 items for Territory (such as “The
Internet is a good channel to express my opinions”), 9 items for Treasure of Information (such as “I like to use Internet information for school work”), 5 items for Telephone (such as “I prefer Internet communication to face-to-face communication when exchanging information with my friends and teachers in the real world”), and 11 items for Trade (such as “It is convenient to shop online”).
Students were required to read the statements and to indicate the extent of their agreement on the basis of the options provided on a 4-point Likert scale: strongly agree, agree, disagree, and strongly disagree (counted as 4, 3, 2, and 1, respectively). A higher score indicated a more positive attitude toward the Internet.
Regarding the reliability of the 6-T scale, the internal consistency of the scale is high. The Cronbach alpha values are 0.95 for fifth graders, 0.96 for eighth graders, 0.94 for 11thgraders, and 0.95 for college sophomores, and the values indicate that the scale has good reliability. The construct (factor) validity was validated via confirmatory factor analysis (CFA) for each grade group and is explained in the following section.
Results
Students Internet-use profile
Table 1 shows the students’ Internet-use practices. If we consider the eighth graders and the 11thgraders as middle-school students, we can observe an interesting trend: older students were more likely than younger ones (1) to agree with the given motivation as to why they used the Internet, (2) to have spent more years using the Internet, (3) to spend more time on the Internet during the weekdays and weekends, and (4) to have more Internet accounts. It is worth noting that the sophomores in this study self-reported that they would spend an average of 4.13 hours on the Internet each weekday and an average of 5.85 hours during each day of the weekend (i.e., Saturday and Sunday). These numbers mean that these college students had been spending a relatively large portion of their leisure time on the Internet.
Evaluation and validation of the hypothetical 6-T model
The CFA of the 6-T model rested on our assumption that Internet attitudes would exhibit a six-factor structure composed of Tool, Toy, Telephone, Territory, Trade, and Treasure of Information. In other words, students’ responses to the Internet-attitude scale could be explained by means of six first-order factors (the above-mentioned 6-Ts), and covariance among the first-order factors could be explained by means of the second-order factor (Internet attitude). Also, each item would have non-zero loadings on the measured first-order factors.
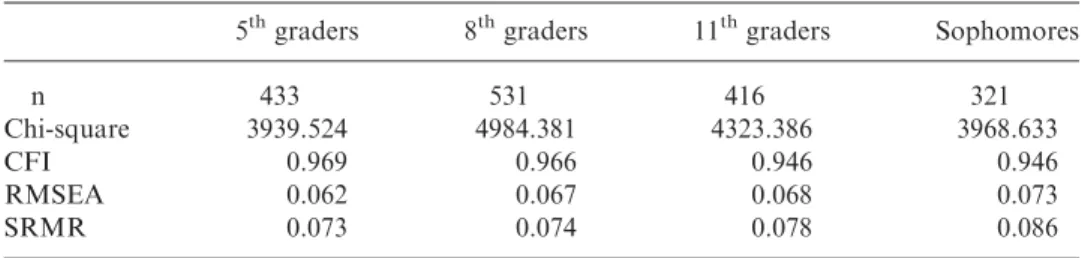
In order to evaluate the data-model fit for our four grade groups, this study adopted four indices recommended by Kline (2005): chi-square, comparative fit index (CFI), root mean square error of approximation (RMSEA), and standardized root mean square residual (SRMR). Since a large sample may result in a high Chi-square value and a possible model rejection, we adapted the criteria to indicate a reasonable fit in this study: RMSEA, 0.08, SRMR , 0.10, and CFI . 0.90. As shown in Table 2, the three indices’ values met our set criteria, indicating that our data fit the hypothetical model well.
Table 1. Students’ Internet-use data. 5 th graders 8 th graders 11 th graders Sophomores n M SD n M SD n M SD n M SD F post hoc Motivation a 397 2.74 0.63 518 3.00 0.48 413 3.05 0.37 320 3.13 0.39 45.58 *** S . 8 th . 5 th 11 th . 5 th Years of Internet use (in years) 298 3.53 1.36 439 5.26 1.80 389 7.03 2.14 310 8.47 2.51 366.43 *** S . 11 th . 8 th . 5 th Duration of weekday Internet use (in hours) 401 0.85 1.11 498 1.62 1.58 405 1.53 1.36 311 4.13 2.36 266.45 *** S . 11 th ¼ 8 th . 5 th b Duration of weekend Internet use (in hours) 402 2.32 2.43 508 4.33 3.43 402 4.31 2.87 314 5.85 3.43 80.37 *** S . 11 th ¼ 8 th . 5 th b All accounts owned on the Internet 407 1.70 2.09 530 3.79 2.97 412 4.36 3.16 312 5.95 3.00 139.78 *** S . 11 th . 8 th . 5 th a Based on a 4-point Likert Scale b For simplicity regarding the post hoc results, “ ¼ ” means that there is no significant difference between the two groups.
Student attitudes toward the Internet
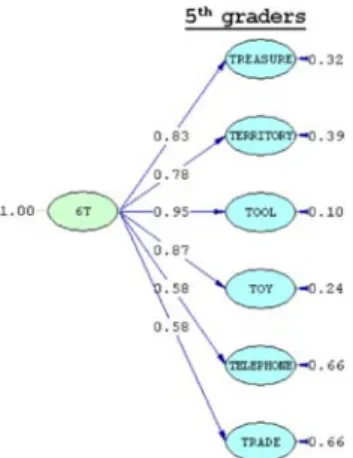
Figure 1 shows the path coefficients between the six Ts for our four grade groups. For fifth graders, the path coefficients between the six Ts (Treasure of Information, Territory, Tool, Toy, Telephone, and Trade) and the Internet attitudes were .83, .78, .95, .87, .58, and .58 respectively; the coefficients for eighth graders were .67, .72, .97, .88, .77, and .54, respectively; the coefficients for 11thgraders were .71, .68, .91, .87, .53, and .50, respectively; and the coefficients for sophomores were .73, .76, .87, .80, .65, and .61, respectively.
The magnitudes of the coefficients reflect the relative weights of these factors. As shown in Table 3, the results show that the weighted factors from the highest to the lowest for the fifth graders were Tool, Toy, Treasure of Information, Territory, Telephone, and Trade; the order of weighted factors for eighth graders was Tool, Toy, Telephone, Territory, Treasure of Information, and Trade; the order of weighted factors for 11thgraders was Tool, Toy, Treasure of Information, Territory, Telephone, and Trade; and the order of weighted factors for sophomores was Tool, Toy, Territory, Treasure of Information, Telephone, and Trade. In sum, for all student groups, Tool and Toy were the principal two factors of the corresponding Internet-related attitude, while Trade was the least weighted after other factors. As shown in Figure 2, the radar graphs for each grade group had the same T-dimensions but exhibited different shapes. The difference will be elaborated in the discussion section.
Grade-level difference in Internet-related attitudes
In order to examine whether grade level makes a difference in students’ attitudes toward the Internet, we first categorized the 56 items into six T factors (subscales). To calculate and then compare students’ mean scores for each factor, we added the students’ original scores to the items (4, 3, 2, or 1) of that factor and then divided by the number of items. As shown in Table 4, the results of a multivariate analysis of variance (MANOVA) reveal that Wilks’ Lambda (18.51, p, .001) is significant for Tool, Toy, Treasure of information, Territory, Telephone, and Trade, and that the total scores are as follow: F¼ 22.86, p , .001; F ¼ 7.39, p , .01; F ¼ 5.96, p , .01; F¼ 28.15, p , .001; F ¼ 52.78, p , .001; F ¼ 35.94, p , .001; F ¼ 27.56, p , .001, respectively. These numbers mean that the grade level made significant differences in all six T dimensions as well as in the total scores.
From the mean scores in Table 4, we can determine that students in higher grade levels tended to have Internet attitudes that were more positive than the Internet Table 2. Results of the four data-model fit indices for the four grade groups.
5thgraders 8thgraders 11thgraders Sophomores
n 433 531 416 321
Chi-square 3939.524 4984.381 4323.386 3968.633
CFI 0.969 0.966 0.946 0.946
RMSEA 0.062 0.067 0.068 0.073
SRMR 0.073 0.074 0.078 0.086
attitudes held by students in lower grade levels. According to the post hoc test on the total 6-T scores, the Internet attitudes of sophomores, 11th graders, and eighth graders were, on the whole, more positive than the Internet attitudes of fifth graders. In each dimension, the Internet attitudes of fifth graders were less positive than those of other grade-level students. The results also indicate that a significant difference existed between eighth graders and 11thgraders regarding the dimension of Trade, but Figure 1. The second-order factor structures of the 6-T model with standardized solutions for the four grade groups.
Table 3. The order of the weighted factors of the six Ts for each grade group. Factor weighting
5thgraders Tool. Toy . Treasure . Territory . Telephone ¼ Trade 8thgraders Tool. Toy . Telephone . Territory . Treasure . Trade
11thgraders Tool. Toy . Treasure . Territory . Telephone . Trade Sophomores Tool. Toy . Territory . Treasure . Telephone . Trade
that no difference existed regarding either the dimensions of Telephone, Territory, Tool, Toy, and Treasure of Information or the total 6-T scores. In addition, no grade-level difference was found among the sophomores, the 11thgraders, and the eighth graders regarding the dimensions of Territory, Toy, and Treasure of Information.
Students’ Internet-use experiences and attitudes
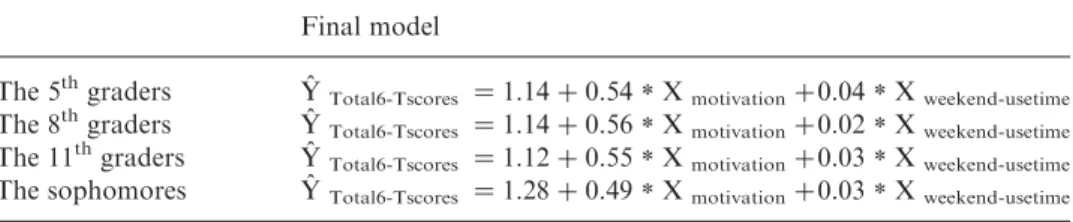
As Appendix 1 shows, students’ Internet-use experiences correlated with the students’ Internet attitudes. In order to explore whether students’ Internet-use experiences could well predict the students’ Internet-related attitudes, we performed a stepwise-regression analysis with “Total 6-T scores” as the dependent variable, and the other variables as the independent variables. The independent variables were duration of Internet use (in years), duration of Internet per weekday (in hours), duration of Internet use per weekend (in hours), number of accounts on the Internet, and Internet-use motivations. The regression helped assess whether these independent variables predicted the most variance of the dependent variables (the total 6-T scores) in the analysis. As shown in Table 5 and Appendix 2, the results indicate that in all grade groups, students’ motivations and weekend-use time were the best predictive factors of Internet attitudes (the total 6-T scores). The explained variances of the 6-T Figure 2. Radar graphs for the weighted factors of the six Ts for the four grade groups.
Table 4. Means, standard deviations, and MANOVA results for different grade levels on the 6-T subscale and the full-scale scores. 5 th graders (n ¼ 432) 8 th graders (n ¼ 531) 11 th graders (n ¼ 416) Sophomores (S) (n ¼ 321) M S D M SD M S D M SD F Post Hoc Tool 2.87 0.66 3.05 0.51 3.06 0.41 3.17 0.36 22.86 *** S . 11 th ¼ 8 th . 5 th Toy 2.93 0.78 3.11 0.61 3.00 0.49 3.00 0.45 7.39 *** 8 th . 5 th Treasure of Information 3.10 0.45 3.15 0.43 3.21 0.35 3.20 0.33 5.96 *** S . 5 th ,1 1 th . 5 th Territory 2.76 0.62 3.01 0.55 3.00 0.45 3.06 0.41 28.15 *** S, 11 th ,8 th . 5 th Telephone 1.96 0.75 2.44 0.79 2.34 0.58 2.51 0.60 52.78 *** S . 11 th ¼ 8 th . 5 th Trade 2.33 0.70 2.46 0.65 2.65 0.49 2.74 0.46 35.94 *** S ¼ 11 th . 8 th . 5 th Total 6-T scores 2.72 0.53 2.90 0.45 2.92 0.34 2.98 0.33 27.56 *** S, 11 th ,8 th . 5 th ** p , .01, *** p , .001
scores were respectively 48% (F¼ 125.66, p , .001), 40% (F ¼ 140.07, p , .001), 45% (F¼ 153.55, p , .001), and 46% (F ¼ 126.55, p , .001).
Discussion
Students’ attitudes toward the Internet from the CFA perspective
This study presents a conceptual 6-T model for understanding Taiwan students’ attitudes toward the Internet and analyzes the validity and reliability of the related scale. Students were required to read 56 statements and to indicate their responses on the basis of four agreement levels. The confirmatory factor analysis of the scale supported the 6-T model: Tool, Toy, Telephone, Territory, Trade, and Treasure of Information. Furthermore, we evaluated the relative weight of these six factors by calculating their coefficients’ magnitudes. With these coefficients arranged from the highest to the lowest, the different orders of the six Ts demonstrate that grade-group weights differed from one another according to these six factors (see also Table 3).
Reviewing the orders of the 6-T factors for the four grade groups in this study, we found that Tool and Toy are the two most weighted factors of Internet-related attitudes by all groups. This result is consistent not only with a result from Chou et al. (2009, 2011), in which fifth graders weighted these two factors as the principal two in terms of Internet-related attitudes, but also supports the general conclusion that the Internet plays a significant role in students’ leisure-time entertainment (e.g., Attewell et al., 2003; Burnett & Wilkinson, 2005; Mumtaz, 2001; Sjoberg, 1999). The result of the current study further demonstrates that not only elementary school students and college students, but also junior high school students and senior high school students may consider the Internet a powerful tool and a major source of entertainment. In other words, students may meet parents’ and teachers’ expectations that the Internet is a tool for academic work and for dealing with issues in everyday life; however, at the same time, students may go beyond parents’ and teachers’ expectations by considering that a major role of the Internet is fun. The results of this study may further illustrate that students, regardless of their age, like to play “with” the Internet because they consider, even though to varying degrees, that the Internet itself is a toy. In addition to the Tool and the Toy factors, we found that students perceived Trade, the new factor in our 6-T model, to be, if not the least important factor in the model, then less important than several of the other factors. This finding means that, for all age groups, the Trade function of the Internet was neither obvious nor significant in comparison with other functions. This pertinent difference is the case perhaps because elementary and middle school students do not yet feel a need or an intense
Table 5. Final regression models of the 6-T attitudes. Final model
The 5thgraders YˆTotal6-Tscores ¼ 1.14 þ 0.54 * Xmotivationþ0.04 * Xweekend-usetime
The 8thgraders Yˆ
Total6-Tscores ¼ 1.14 þ 0.56 * Xmotivationþ0.02 * Xweekend-usetime
The 11thgraders YˆTotal6-Tscores ¼ 1.12 þ 0.55 * Xmotivationþ0.03 * Xweekend-usetime
The sophomores YˆTotal6-Tscores ¼ 1.28 þ 0.49 * Xmotivationþ0.03 * Xweekend-usetime
desire to shop online, do not have enough purchasing power for such shopping, or have shopping channels that are more available than online sites. In contrast, college students may feel a stronger need or a stronger desire and have greater purchasing power than is the case with younger students, but college sophomores also perceived the Internet’s Trade factor as less important than the other five factors. In sum, although online shopping has retained and even expanded its high availability, and although related tools and sites have become more and more popular than other T dimensions, Taiwan students seem to be generally unaware of the Internet’s Trade dimension.
All grade groups were in agreement with one another in placing the Tool factor in first place and the Toy factor in second place; however, the results indicate an inconsistent ordering of the rest of the T factors relative to the various grade groups (see also Table 3). For example, the fifth graders weighted Treasure of Information as the third-most important factor, followed by Territory, and Telephone/Trade. The order for the eighth graders is Telephone, Territory, Treasure of Information, and Trade; the order for the 11thgraders is Treasure of Information, Territory, Telephone, and Trade; and for sophomores, the order is Territory, Treasure of Information, Telephone, and Trade.
From the results of these orders of T factors, some interesting issues have emerged. First, for the eighth graders, the Telephone factor is the third-most weighted factor, after Tool and Toy. This sequence would suggest that the Internet’s communication function (such as email and MSN) has become particularly important for this age group, in comparison with other grade groups. The reason for this exceptional finding may be, in part, that the eighth graders had already started to experience a stronger need for meaningful friendships and for a sense of belonging, prompting these eighth graders to place a high value on the Internet’s communication function. Another reason could be that the eighth graders had started to develop online relationships beyond those with classmates or real-world friends (Chou & Peng, 2007), a development that parents and teachers tend to discourage or to prohibit among young students (i.e., the fifth graders in this study). In this sense, the Internet provides eighth graders with an incredible array of interpersonal communication options with which they can solidify their existing interpersonal relationships and develop new, exclusively online relationships. These reasons perhaps explain why the eighth graders assigned a greater weight to the Internet’s communication function than did other grade groups in this study.
Second, the sophomores in this study weighted Territory as the third-most important factor among the six T factors, differing in this regard from other age groups. This result means that, in general, college sophomores may have stronger needs and more flexible schedules for creating, uploading, and sharing (personal) information in cyberspace, and thus, they would have weighted Territory as the third-most important factor of the 6-T model. Indeed, as the Web 2.0 age approaches, and as publishing tools grow increasingly user-friendly, Internet users can create personal journals of their lives; demonstrate their knowledge, opinions, and feelings; and build resource sites with their online “readers”. In this study, although all grade groups recognized the possibility for self-promotion on the Internet, sophomores seemed to value Territory more than did other groups.
Third, it is interesting to note that the factor of Treasure of Information was weighted only in the middle of the order sequences by all grade groups. Past researchers
(e.g., Attewell et al., 2003; Buente & Robbin, 2008; Mumtaz, 2001, Sjo¨berg, 1999) all emphasized the importance of online information to students’ Internet use. It is reasonable to expect that the Treasure of Information dimension would contribute largely, if not completely, to students’ overall Internet-related attitudes. However, the result from our sampled students seemed not to support this expectation. In this study, the fifth and 11th graders weighted Treasure of Information as the third-most important factor, after the Tool factor and the Toy factor. The sophomores weighted it as the fourth-most important factor, after the Tool, Toy, and Territory factors. The eighth graders weighted it as the fifth-most important factor, after the Tool, Toy, Telephone, and Territory factors, and ahead of only the Trade factor. Although the sampled students in this study generally agreed that they could search for online information pertinent to their daily life and their school work, and although the online information could broaden their knowledge base and facilitate societal progress, they did not assign a weight to the Treasure of Information factor that was greater than or even equal to the Tool, the Toy, the Territory, or the Telephone factors.
Grade-level differences in Internet-related attitudes
One of the research questions asked whether grade level makes any difference in students’ attitudes toward the Internet. On the basis of the MANOVA results (see also Table 4), we drew two interesting findings. First, the sophomores in this study had the highest levels of positive Internet-related attitudes, while the fifth graders had the lowest levels. This result is consistent with the result of Tsai et al. (2001), wherein students possessing relatively high levels of Internet experience exhibited higher levels of related positive attitudes than did students possessing relatively low levels of Internet experience. Except for the Toy dimension, the post-hoc results indicate that the sophomores had significantly higher scores on the other five dimensions than did the fifth graders. Moreover, sophomores were more positive in their perceptions of the Telephone and Tool dimensions than were the eighth and 11th graders. In sum, sophomores demonstrated higher levels of positive attitudes on most of the attitude dimensions than did younger groups.
Second, a comparison between the eighth graders and the 11thgraders reveal that except for the Trade dimension, there was no significant difference regarding the other five dimensions. This absence of difference between the two grade groups means that they were equal in these attitude dimensions. However, the eighth graders were less positive in their assessment of the Trade dimension than were the 11thgraders. This result could be related to Internet use, insofar as eighth graders may engage less in online commercial activities than is the case with 11thgraders.
Students’ Internet-use experiences and Internet-related attitudes
The regression analyses of this study indicate that, across the different grade groups, students’ motivations and weekend-use hours could serve to predict overall Internet-related attitudes (see also Table 5; Appendix 1 and 2). In other words, the stronger a student’s motivation to use the Internet, and the longer a student’s weekend time spent on the Internet, the more positive the student’s attitudes toward the Internet would be. Other variables, such as weekday time on the Internet (in hours), years of Internet use, and number of online accounts had no predictive powers. Since our scale
for motivations has seven dimensions exactly corresponding to our 6-T model, it can be concluded that the stronger the students’ self-motivation to use the Internet, the higher the students’ valuation of the Internet, and vice versa. In addition, students’ weekend time on the Internet was a predictor because perhaps they played more computer and Internet games during the weekend than on weekdays, and thus, this variable would contribute to the students’ positive attitudes toward the Internet.
Conclusions and implications for educators and future research
In conclusion, the 6-T model proposed in this study was validated through statistical analysis based on the data collected from a large cross-sectional sample. The model was empirically validated via CFA, and could well explain students’ multi-factor attitudes toward the Internet. The sample in this study is comprised of fifth graders, eighth graders, 11thgraders, and college sophomores, with about a three-year age difference between each consecutive group. By comparing these four grade groups in a given time frame, we could observe the difference in roles that the Internet has played in students’ attitudes.
The results indicate that for all grade groups, the most recognized factors were Tool and Toy, and the least recognized factor was Trade. The other factors – Territory, Telephone, and Treasure of Information – were weighted differently by different grade groups. For example, the eighth graders weighted the Telephone factor as the third-most important one, while college sophomores weighted the Territory factor as the third-most important one. Thus, by reviewing the order of the T-factors, we could identify the difference that grade level made in students’ attitudes toward the Internet. The results of this study demonstrate that, in general, as the students grew older, their Internet-related attitudes became more and more positive. In addition to age, this study found that the stronger the students’ self-motivation to use the Internet, the more positive the students’ attitudes were toward it. Moreover, it is somewhat surprising to note that students’ weekend time spent on the Internet could contribute to their overall attitudes toward the Internet. This conclusion probably confirmed the results of previous studies that Internet use is highly correlated with Internet-related attitudes. This study further demonstrates that the weekend (not the weekday) time-on-Internet is highly correlated with Internet-related attitudes.
The implications of these results are three-fold. First, although all students exhibited multi-factorial attitudes toward the Internet, different age groups weighted each factor differently. Teachers and parents need to recognize the general phenomena as well as specific weightings across age. By strengthening their understanding of the Internet-related attitudes among students of different grade levels, teachers and parents can better communicate with their charges regarding these issues.
Second, regardless of their age, students who participated in this study all recognized the importance of the Toy factor in their Internet-related attitudes. Although this may not be the expectation of some teachers and parents, it represents an inevitable trend wherein the Internet functions as an entertainment portal for students. Recognizing the “play” dimension of the Internet will help teachers and parents develop realistic expectations, provide better guidance, or decrease possible inter-generational conflicts.
Last, this study’s new 6-T model is comprehensive, and the scale developed was validated through a large sample of data. This model probably reflects actual Internet
attitudes and can provide a basis for future studies’ collection and analysis of data regarding the relationships between Internet-related attitudes and such variables as gender difference, self-efficacy, e-learning effectiveness, and Internet use.
Acknowledgements
The previous version was presented at the conference, “The Internet Turning 40: The Never-ending Novelty of New Media Research?”, School of Journalism and Communication, the Chinese University of Hong Kong, from 17 – 19 June 2010. This study was supported by the National Science Council of Taiwan, projects No. NSC97-2511-S-009-006-MY3, NSC99-2511-S-009-006-MY3.
Notes on contributors
Chien Chou received her PhD in Instructional Design and Technology from Ohio State University in 1990. She is currently a chair professor and director at Graduate Institute of Education/Center for Teacher Education, National Chiao Tung University, Taiwan. She received three Outstanding Research Awards from the National Science Council of Taiwan. Her research interests include e-learning, information literacy, and research ethics.
Huan-Chueh Wu received her master’s degree in Educational Psychology at the Graduate Institute of Counseling and Applied Psychology in the National Taichung University of Education in 2004. She is currently a doctoral student in the Institute of Education at the National Chiao Tung University, Taiwan. Her research focuses include e-learning and information literacy education.
Chao-hsiu Chen received her PhD from the University of Texas at Austin in 2006. She is currently an associate professor of the Institute of Education/Center of Teacher Education, National Chiao Tung University, Taiwan. Her research interests include mobile/ubiquitous learning, online learning, technology integration, and instructional design.
References
Ajzen, I., & Fishbein, M. (1980). Understanding attitudes and predicting social behavior. Upper Saddle River, NJ: Prentice-Hall.
Attewell, P., Suazo-Garcia, B., & Battle, J. (2003). Computers and young children: Social benefit or social problem? Social Forces, 82(1), 277 – 296.
Buente, W., & Robbin, A. (2008). Trends in Internet information behavior, 2000 – 2004. Journal of the American Society for Information Science and Technology, 59(11), 1743 – 1760. Burnett, C., & Wilkinson, J. (2005). Holy lemons! Learning from children’s uses of the Internet
in out-of-school contexts. Literacy, 39(3), 158 – 165.
Cheung, W., & Huang, W. (2005). Proposing a framework to assess Internet usage in university education: An empirical investigation from a student’s perspective. British Journal of Educational Technology, 36(2), 237 – 253.
Chou, C., & Peng, H. (2007). Net friends: Adolescents’ attitudes and experiences vs. teachers’ concerns. Computers in Human Behavior, 23(5), 2394 – 2413.
Chou, C., Wu, H. C., & Chen, C. H. (2011). Re-visiting college students’ attitudes toward the Internet based on a 6-T model: Gender and grade-level difference. Computers & Education, 56(4), 939 – 947.
Chou, C., Yu, S., Chen, C., & Wu, H. (2009). Tool, toy, telephone, territory, or treasure of information: Elementary school students’ attitudes toward the Internet. Computers & Education, 53(2), 308 – 316.
Duggan, A., Hess, B., Morgan, D., Kim, S., & Wilson, K. (2001). Measuring students’ attitudes toward educational use of the Internet. Journal of Educational Computing Research, 25(3), 267 – 281.
Durndell, A., & Haag, Z. (2002). Computer self-efficacy, computer anxiety, attitudes towards the Internet and reported experience with the Internet, by gender, in an East European sample. Computers in Human Behavior, 18(5), 521 – 535.
Joiner, R., Brosnan, M., Duffield, J., Gavin, J., & Maras, P. (2007). The relationship between Internet identification, Internet anxiety, and Internet use. Computers in Human Behavior, 23(3), 1408 – 1420.
Kline, R. B. (2005). Principles and practice of structural equation modeling (2nd ed.). New York: Guilford Press.
Li, N., & Kirkup, G. (2007). Gender and cultural differences in Internet use: A study of China and the UK. Computers & Education, 48(2), 301 – 317.
Liaw, S.-S. (2002). An Internet survey for perceptions of computers, and the world wide web: Relationship, prediction, and difference. Computers in Human Behavior, 18(1), 17 – 35. Mumtaz, S. (2001). Children’s enjoyment and perception of computer use in the home and the
school. Computers & Education, 36, 347 – 362.
Peng, H., Tsai, C.-C., & Wu, Y.-T. (2006). University students’ self-efficacy and their attitudes toward the Internet: The role of students’ perceptions of the Internet. Educational Studies, 32(1), 73 – 86.
Schumacher, P., & Morahan-Martin, J. (2001). Gender, Internet and computer attitudes and experiences. Computers in Human Behavior, 17(1), 95 – 110.
Sjo¨berg, U. (1999). The rise of the electronic individual: A study of how young Swedish teenagers use and perceive Internet. Telematics and Informatics, 16, 113 – 133.
Taiwan Network Information Center. (2010). The analysis of the 2010 investigation on the broadband-network use in Taiwan. Retrieved from http://www.twnic.net.tw/NEWS4/91. pdf [in Chinese]
Torkzadeh, G., & van Dyke, T. P. (2002). Effects of training on Internet self-efficacy and computer user attitudes. Computers in Human Behavior, 18(5), 479 – 494.
Tsai, C.-C. (2004). Adolescents’ perceptions toward the Internet: A 4-T framework. CyberPsychology & Behavior, 7(4), 458 – 463.
Tsai, C.-C. (2006). What is the Internet? Taiwanese high school students’ perceptions. CyberPsychology & Behavior, 9(6), 767 – 771.
Tsai, C.-C. (2007). The relationship between Internet perceptions and preferences towards Internet-based learning environment. British Journal of Educational Technology, 38(1), 167 – 170.
Tsai, C.-C., & Lin, C.-C. (2004). Taiwanese adolescents’ perceptions and attitudes regarding the Internet: Exploring gender differences. Adolescence, 39(159), 725 – 734.
Tsai, C.-C., Lin, S. S. J., & Tsai, M. J. (2001). Developing an Internet attitude scale for high school students. Computers & Education, 37(1), 41 – 51.
Valcke, M., Schellens, T., van Keer, H., & Gerarts, M. (2007). Primary school children’s safe and unsafe use of the Internet at home and at school: An exploratory study. Computers in Human Behavior, 23, 2838 – 2850.
Whitty, M. T., & McLaughlin, D. (2007). Online recreation: The relationship between loneliness, Internet self-efficacy and the use of the Internet for entertainment purposes. Computers in Human Behavior, 23, 1435 – 1446.
Wu, Y.-T., & Tsai, C.-C. (2006). University students’ Internet attitudes and Internet self-efficacy: A study at three universities in Taiwan. CyberPsychology & Behavior, 9(4), 441 – 450.
Zhang, Y. (2007). Development and validation of an internet use attitude scale. Computers & Education, 49, 243 – 253.
Appendix 1. Summary of the correlation analyses of the Internet-use experiences and the 6-T attitudes Motivation Year Weekday-use Time Weekend-use Time All Accounts Total 6-T Scores The 5thgraders Motivation 1 Year 0.20*** 1 Weekday-use Time 0.13* 0.04 1 Weekend-use Time 0.16** 0.12* 0.44 1 All Accounts 0.35*** 0.10 0.18*** 0.27*** 1 Total 6-T Scores 0.67*** 0.15** 0.13* 0.28*** 0.23*** 1 The 8thgraders Motivation 1 Year 0.05 1 Weekday-use Time 0.16*** 0.05 1 Weekend-use Time 0.17*** 0.12* 0.53*** 1 All Accounts 0.27*** 0.13** 0.26*** 0.24*** 1 Total 6-T Scores 0.62*** 0.08 0.21*** 0.25*** 0.22*** 1 The 11thgraders Motivation 1 Year 0.13* 1 Weekday-use Time 0.06 0.08 1 Weekend-use Time 0.15** 0.08 0.41*** 1 All Accounts 0.15** 0.15** 0.22*** 0.22*** 1 Total 6-T Scores 0.64*** 0.16*** 0.13** 0.31*** 0.17*** 1 The Sophomores Motivation 1 Year 0.19*** 1 Weekday-use Time 0.03 0.11 1 Weekend-use Time 0.11 20.01 0.58*** 1 All Accounts 0.09 0.26*** 0.21*** 0.12 1 Total 6-T Scores 0.62*** 0.09 0.21*** 0.34*** 0.14*** 1 *p, .05, **p , .01, ***p , .001
Appendix 2. Summary of the stepwise multiple regression analyses of the 6-T attitudes
The 5thgraders B Beta F R R2 AdjR2 DR2
1 (Constant) 1.17 221.70 *** 0.67 0.45 0.45 0.45 Motivation 0.56 0.67 2 (Constant) 1.14 125.66 *** 0.70 0.48 0.48 0.03 Motivation 0.54 0.64 Weekend-use time 0.04 0.18 The 8thgraders 1 (Constant) 1.15 258.70 *** 0.62 0.38 0.38 0.38 Motivation 0.58 0.62 2 (Constant) 1.14 140.07 *** 0.64 0.40 0.40 0.02 Motivation 0.56 0.59 Weekend-use time 0.02 0.14 The 11thgraders 1 (Constant) 1.14 255.72 *** 0.64 0.41 0.40 0.41 Motivation 0.58 0.64 2 (Constant) 1.12 153.55 *** 0.67 0.45 0.45 0.05 Motivation 0.55 0.60 Weekend-use time 0.03 0.22 The Sophomores 1 (Constant) 1.35 186.86 *** 0.62 0.38 0.38 0.38 Motivation 0.52 0.62 2 (Constant) 1.28 126.55 *** 0.68 0.46 0.46 0.08 Motivation 0.49 0.59 Weekend-use time 0.03 0.28 ***p, .001