行政院國家科學委員會專題研究計畫 成果報告
不同尿路動力學診斷的女性合併肛門失禁的年齡層別盛行
率及相關危險因子
研究成果報告(精簡版)
計 畫 類 別 : 個別型
計 畫 編 號 : NSC 95-2314-B-002-289-
執 行 期 間 : 95 年 08 月 01 日至 96 年 07 月 31 日
執 行 單 位 : 國立臺灣大學醫學院婦產科
計 畫 主 持 人 : 林鶴雄
計畫參與人員: 助理:張雅婷、魏美玉
處 理 方 式 : 本計畫可公開查詢
中 華 民 國 96 年 11 月 14 日
不同尿路動力學診斷的女性合併大便失禁的年齡層別
盛行率及相關危險因子
Age-specific prevalence and correlated risk factors of
fecal incontinence in women with different urodynamic
diagnoses
台大醫院婦產部 林鶴雄教授
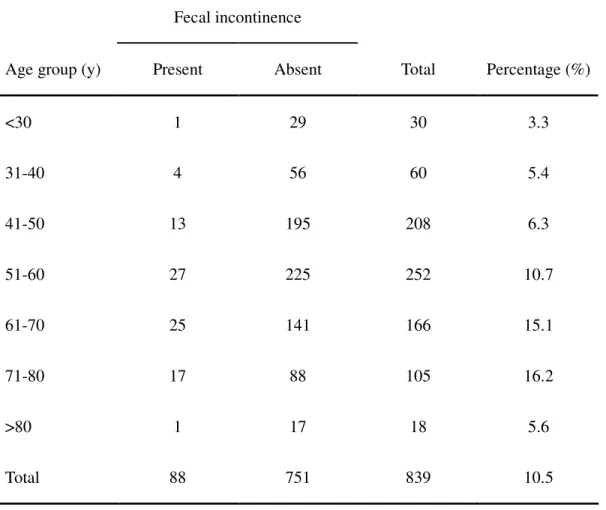
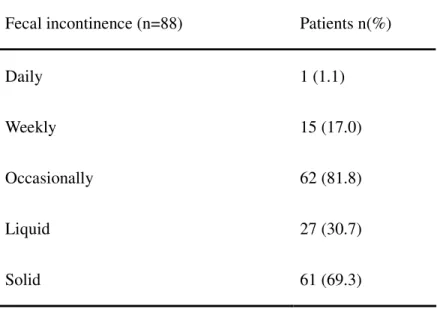
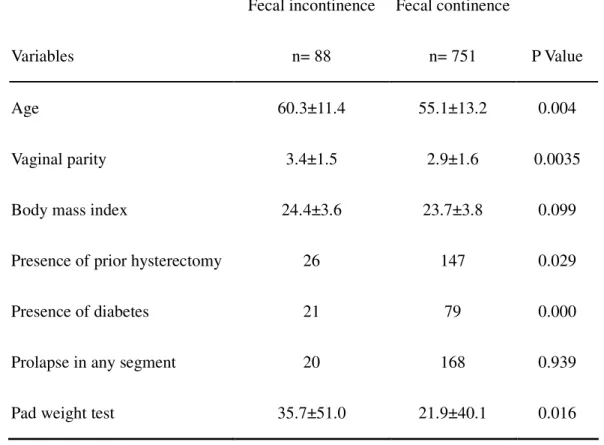
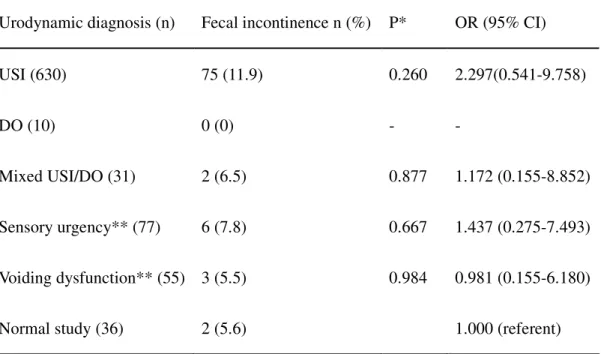
< << <摘要摘要摘要摘要>>>> 背景及目的 背景及目的 背景及目的 背景及目的 文獻上許多研究婦女同時罹患尿失禁與肛門失禁之論文,其對象有以年長者 (大於 65 歲)、社區人口、學齡兒童或是有尿失禁症狀的婦女來從事之研究。但 是,利用尿失禁症狀為診斷來做分析,其診斷難免失之精確。尿動力分析可以對 有下尿道症狀之病人提供了一個相當客觀之病理分析。因此,病人主述的診斷與 尿動力學上的診斷常常有很大之差異。所以,除了分析此一有下尿道症狀的婦女 大便失禁之年齡層別盛行率外,我們希望以尿動力學上的診斷來更加精確分析其 與大便失禁之關係。 研究方法 研究方法 研究方法 研究方法 我們從西元 2006 年 8 月至 2007 年 10 月止陸續收集有下尿路症狀且接受尿動力學檢查的婦女之問卷。每位病例均連續性接受全套尿動力學檢查,包括尿流 圖、注入及排空膀胱壓圖、肌電圖、應力尿道壓圖以及 20 分鐘護墊測漏試驗。 問卷包括大便失禁之有無、大便失禁頻率與內容、年齡、經陰道生產數、內外科 病史、骨盆器官脫垂病史、身高和體重。我們除了推算其年齡別盛行率外,也利 用單變數分析及多變數邏輯分析來分析大便失禁之危險因子和其與尿動力學上 診斷之相關。 結果 結果 結果 結果 本計畫共收集了 839 份問卷。此 839 病人中合併大便失禁者共有 88 個病人, 比率為 10.5 % (95% CI: 8.4~12.6%)。以年齡層來區分可得盛行率最高為介於 71-80 歲級之病人(盛行率為 16.2 %)(95%CI: 9.0~23.4%),最低為小於 30 歲之 病人(盛行率為 3.3 %) (Table 1) 。關於病人大便失禁之頻率以偶爾發生之案 例最多(81.8%),而大便失禁之內容以固態失禁較為常見(69.3 %) (Table 2)。 利用單一變數分析與大便失禁有關之危險因子發現年齡、經陰道生產數、有 子宮切除病史、有糖尿病史、以及棉墊試驗的重量與大便失禁有統計學上之相關 (Table 3)。再利用單一變數邏輯分析尿動力診斷與大便失禁發現 urodynamic stress incontinence (USI)與 sensory urgency 有高的 odds ratio,但是無統 計學上之相關 (Table 4)。
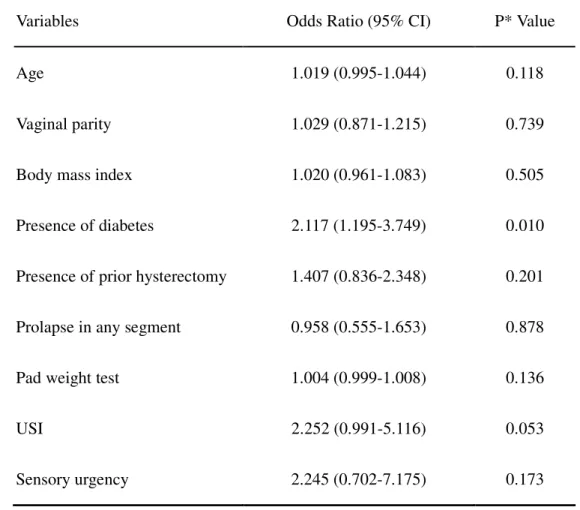
發現有糖尿病史為高度相關之危險因子 (odds ratio: 2.117, p=0.01),而 USI 有趨勢為一危險因子(odds ratio: 2.252, p=0.053) (Table 5)。
結論 結論 結論 結論 本研究確認糖尿病史為大便失禁之危險因子外,分析尿動力學之診斷與大便 失禁發現 USI 亦可能為大便失禁相關之危險因子。
Table 1. Age-specific prevalence fecal incontinence among 839 women withurinary
symptoms
Fecal incontinence
Age group (y) Present Absent Total Percentage (%)
<30 1 29 30 3.3 31-40 4 56 60 5.4 41-50 13 195 208 6.3 51-60 27 225 252 10.7 61-70 25 141 166 15.1 71-80 17 88 105 16.2 >80 1 17 18 5.6 Total 88 751 839 10.5
Table 2. Frequency and nature of fecal incontinence among 839 women with urinary
symptoms
Fecal incontinence (n=88) Patients n(%)
Daily 1 (1.1)
Weekly 15 (17.0)
Occasionally 62 (81.8)
Liquid 27 (30.7)
Table 3. Univariate analyses of risk factors associated with fecal incontinence (n=88)
among 839 women with urinary symptoms
Fecal incontinence Fecal continence
Variables n= 88 n= 751 P Value
Age 60.3±11.4 55.1±13.2 0.004
Vaginal parity 3.4±1.5 2.9±1.6 0.0035
Body mass index 24.4±3.6 23.7±3.8 0.099
Presence of prior hysterectomy 26 147 0.029
Presence of diabetes 21 79 0.000
Prolapse in any segment 20 168 0.939
Pad weight test 35.7±51.0 21.9±40.1 0.016
Table 4. Prevalence of fecal incontinence among women with different urodynamic
diagnoses.
Urodynamic diagnosis (n) Fecal incontinence n (%) P* OR (95% CI)
USI (630) 75 (11.9) 0.260 2.297(0.541-9.758)
DO (10) 0 (0) - -
Mixed USI/DO (31) 2 (6.5) 0.877 1.172 (0.155-8.852)
Sensory urgency** (77) 6 (7.8) 0.667 1.437 (0.275-7.493)
Voiding dysfunction** (55) 3 (5.5) 0.984 0.981 (0.155-6.180)
Normal study (36) 2 (5.6) 1.000 (referent)
*Compared with women of normal urodynamic finding by univariate logistic
regression analysis; and urodynamic diagnoses are mutually exclusive of each other.
**Sensory urgency included hypersensitive bladder and low bladder compliance; and
voiding dysfunction included hypoactive detrusor and dysfunctional voiding.
Table 5. Multiple logistic regression analyses of risk factors for fecal incontinence
(n=88) among 839 women with urinary symptoms
Variables Odds Ratio (95% CI) P* Value
Age 1.019 (0.995-1.044) 0.118
Vaginal parity 1.029 (0.871-1.215) 0.739
Body mass index 1.020 (0.961-1.083) 0.505
Presence of diabetes 2.117 (1.195-3.749) 0.010
Presence of prior hysterectomy 1.407 (0.836-2.348) 0.201
Prolapse in any segment 0.958 (0.555-1.653) 0.878
Pad weight test 1.004 (0.999-1.008) 0.136
USI 2.252 (0.991-5.116) 0.053
Sensory urgency 2.245 (0.702-7.175) 0.173
*Multivariate logistic regression analysis.