行政院國家科學委員會專題研究計畫 成果報告
人工濕地生態系統功能與經濟效益評估--人工濕地對台灣
整體及區域經濟之衝擊影響及其溫室氣體減量潛力評估
(III)
研究成果報告(完整版)
計 畫 類 別 : 整合型 計 畫 編 號 : NSC 99-2621-M-004-007- 執 行 期 間 : 99 年 08 月 01 日至 100 年 10 月 31 日 執 行 單 位 : 國立政治大學經濟學系 計 畫 主 持 人 : 李慧琳 共 同 主 持 人 : 林幸君、高慈敏 計畫參與人員: 博士班研究生-兼任助理人員:張嫤雪 報 告 附 件 : 出席國際會議研究心得報告及發表論文 公 開 資 訊 : 本計畫涉及專利或其他智慧財產權,2 年後可公開查詢 中 華 民 國 101 年 01 月 31 日中 文 摘 要 : In this study we attempted to illustrate a way of linking the value of ecosystem services with the economy and thus revealing the economic significance of ecosystem service which has long been overlooked in human economic activities. We chose as the study object the Kaomei Wetland in Central Taiwan—which is rated as ‘wetland of national importance’, based on the Ramsar Convention treaties. We first conducted field survey and experiments to identify the Kaomei Wetland as a land use type of low landscape
development intensity (LDI) and assessed the latent economic value of the ecosystem services Kaomei Wetland provides, based on the conceptual framework as proposed by the TEEB. We then incorporated the latent economic value—in the form of ’avoided cost’ and ’replacement cost’ as implied by the Kaomei ecosystem services while maintaining it as a low LDI land use type—to a bottom-up multi-regional computable general equilibrium (CGE) model of Taiwan to see how far-reaching the avoided/replaced costs, if spared for other non-wastewater treatment use, could alternatively affect the economy of the local and other domestic regions through inter-region linkage and the input-output relationship in the production and consumption processes. We aim to demonstrate the significant economic contribution of the seemingly low-economic-value land use type like the Kaomei Wetland could potentially make to the human wellbeing in the perspective of economics. 中文關鍵詞: multi-regional computable general equilibrium,
ecosystem services, wastewater treatment, replacement cost, avoided cost.
英 文 摘 要 : In this study we attempted to illustrate a way of linking the value of ecosystem services with the economy and thus revealing the economic significance of ecosystem service which has long been overlooked in human economic activities. We chose as the study object the Kaomei Wetland in Central Taiwan—which is rated as ‘wetland of national importance’, based on the Ramsar Convention treaties. We first conducted
field survey and experiments to identify the Kaomei Wetland as a land use type of low landscape
development intensity (LDI) and assessed the latent economic value of the ecosystem services Kaomei Wetland provides, based on the conceptual framework as proposed by the TEEB. We then incorporated the latent economic value—in the form of ’avoided cost’ and ’replacement cost’ as implied by the Kaomei ecosystem services while maintaining it as a low LDI land use type—to a bottom-up multi-regional computable general equilibrium (CGE) model of Taiwan to see how far-reaching the avoided/replaced costs, if spared for other non-wastewater treatment use, could alternatively affect the economy of the local and other domestic regions through inter-region linkage and the input-output relationship in the production and consumption processes. We aim to demonstrate the significant economic contribution of the seemingly low-economic-value land use type like the Kaomei Wetland could potentially make to the human wellbeing in the perspective of economics. 英文關鍵詞: multi-regional computable general equilibrium,
ecosystem services, wastewater treatment, replacement cost, avoided cost.
1
行政院國家科學委員會補助專題研究計畫
▇ 成 果 報 告
□期中進度報告
人工濕地生態系統功能與經濟效益評估-人工濕地對台灣整體及區
域經濟之衝擊影響及其溫室氣體減量潛力評估(III)
計畫類別: □個別型計畫 ▇整合型計畫
計畫編號:NSC 99-2621-M-004-007-
執行期間:99 年 8 月 1 日至 100 年 10 月 31 日
計畫主持人:李慧琳
共同主持人:林幸君、高慈敏
計畫參與人員:張嫤雪
成果報告類型(依經費核定清單規定繳交):□精簡報告 ▇完整報告
本成果報告包括以下應繳交之附件:
▇赴國外出差或研習心得報告一份
□赴大陸地區出差或研習心得報告一份
□出席國際學術會議心得報告及發表之論文各一份
□國際合作研究計畫國外研究報告書一份
處理方式:除產學合作研究計畫、提升產業技術及人才培育研究計畫、
列管計畫及下列情形者外,得立即公開查詢
□涉及專利或其他智慧財產權,□一年▇二年後可公開查詢
執行單位:國立政治大學
中 華 民 國 101 年 1 月 20 日
2
Table of Contents:
ABSTRACT: ... 3
1. INTRODCUTION ... 4
2. CASE STUDIED:KAOMEI WETLAND ... 10
3. THE INSPIRING IDEAS IN “BROKEN WINDOW FALLACY” AND LEONTIEF (1970) ... 15
4. A MUTLI-REGION COMPUTABLE GENERAL EQUILIBRIUM MODEL ... 16
5. KEY RESULTS OF THE MR-CGE ASSESSMENT OF THE “EXTENDED” REPLACEMENT COST... 20
6. CONCLUDING REMARKS ... 21
REFERENCES ... 23
3
Abstract:
In this study we attempted to illustrate a way of linking the value of ecosystem services with the economy and thus revealing the economic significance of ecosystem service which has long been overlooked in human economic activities. We chose as the study object the Kaomei Wetland in Central Taiwan—which is rated as ‘wetland of national importance’, based on the Ramsar Convention treaties. We first conducted field survey and experiments to identify the Kaomei Wetland as a land use type of low landscape development intensity (LDI) and assessed the latent economic value of the ecosystem services Kaomei Wetland provides, based on the conceptual framework as proposed by the TEEB. We then incorporated the latent economic value—in the form of "avoided cost" and "replacement cost" as implied by the Kaomei ecosystem services while maintaining it as a low LDI land use type—to a bottom-up
multi-regional computable general equilibrium (CGE) model of Taiwan to see how far-reaching the avoided/replaced costs, if spared for other non-wastewater treatment use, could alternatively affect the economy of the local and other domestic regions through inter-region linkage and the input-output relationship in the production and consumption processes. We aim to demonstrate the significant economic contribution of the seemingly low-economic-value land use type like the Kaomei Wetland could potentially make to the human wellbeing in the perspective of economics.
Keywords: multi-regional computable general equilibrium, ecosystem services, wastewater treatment, replacement cost, avoided cost.
4
1. Introdcution
Through the provision of ecosystem services, wetlands have long been supporting the human economy without receiving due appreciation, let alone monetary compensation. Studies in recent environmental economics literature has seen increased interest in the valuation of ecosystem service, which, as defined in Costanza et al. (1997), refers to the benefits human populations derive directly or indirectly from ecosystem functions. Table
1 tallies the contribution of wetland ecosystem service, as indicated in the TEEB (2010) and Millennium Ecosystem Assessment (2005).
In ecological engineering practices, ecosystem services offered by nature as well as constructed wetlands have been popularly accepted and untilized for wastewater
treatment, which allow for reduction in the use of non-renewable inputs for wastewater treatment. Although latent, economic value of the wetland is of significance to economic well-being of human societies. Humans have long been utilizing the ecosystem services provided by wetlands, yet at the same time disrupting the ecosystem in day-to-day economic activities.
According to Geber and Bjorklund (2002), ecosystem services used in wastewater treatment consist of three broad ecological functions: (a) biological: denitrification, nitrification, fermentation, plant uptake, and oxidization of organic matter; (b) chemical processes: ammonification, adsorption, and fixation; (c) physical: sedimentation,
evaporation, and transpiration. Geber and Bjorklund (2002) used emergy analysis to investigate the substitutablility of increased use of space (land area), time and
dependence on ecosystem services for purchased non-renewable inputs in wastewater treatment in Sweden—of three types: (1) conventional three-step treatment plant
(WWTP), (2) conventional menchanical /chemical treatment plant complemented with a constructed wetland (TP+CW), and (3) natural wetland (NW). Geber and Bjorklund (2002) found that total use of emergy per person equivalent and kg phosphorus was undifferentiated, and the emergy ratios of purchased to free renewable environmental inputs are 9:1, 141:1, and 3056:1, for NW, TP+CW, and WWTP, respectively. This study indicates the environmental efficiency of both natural and constructed wetlands in
serving for wastewater treatment.
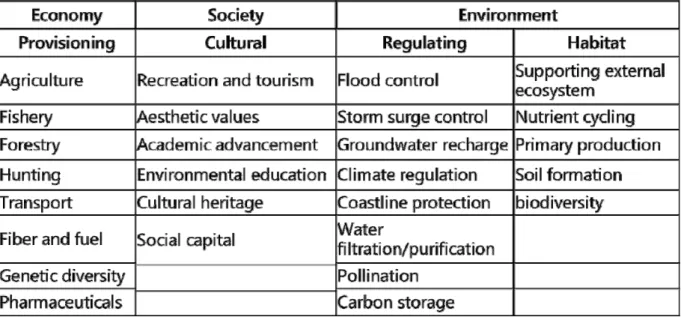
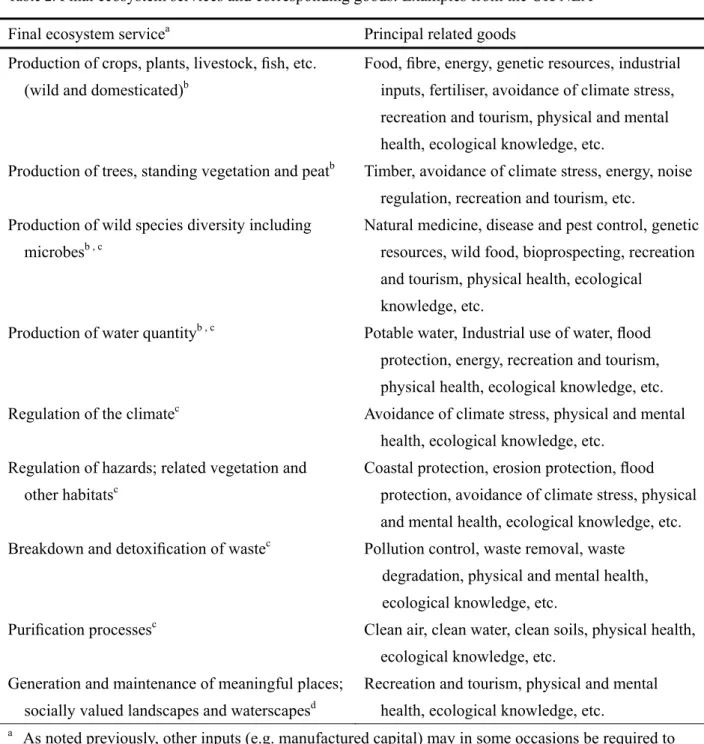
Bateman et al. (2011) reports the comprehensive study conducted for the UK case, and identified ecosystem services and corresponding goods (see Table 2). Bateman et al. (2011) also reviewed preceding literature and thereby proposed a general framework (see Figure 1) and nomenclature for integrating economic analyses within ecosystem service
5
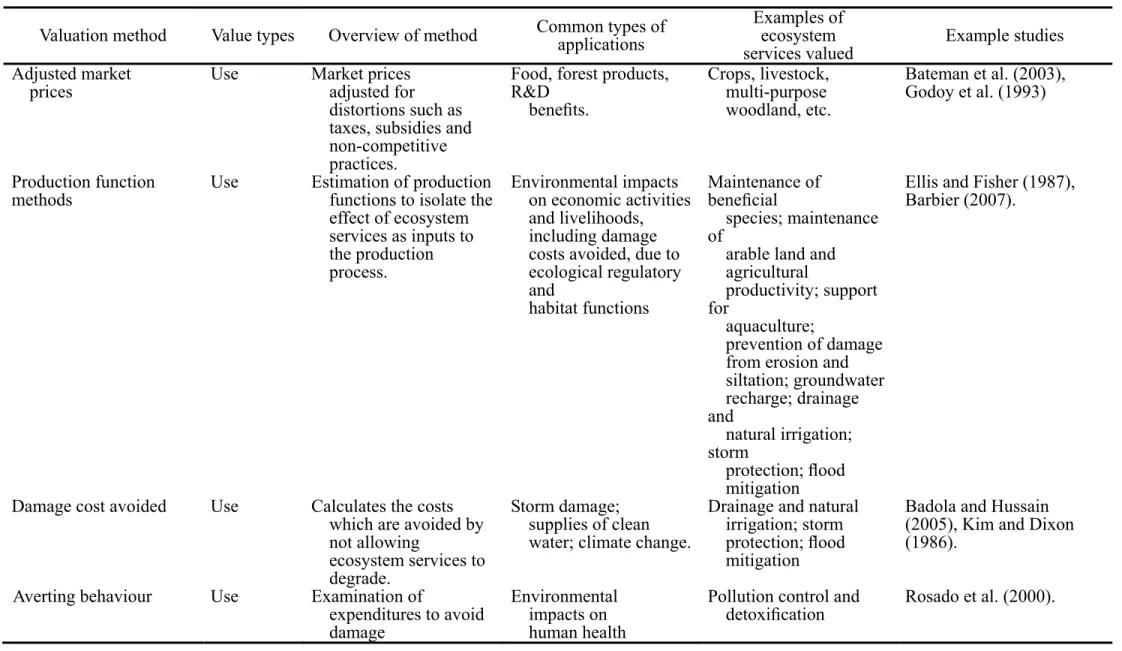
assessment. A comprehensive summary of valuation methods being applied to ecosystem services was provided in Bateman et al. (2011) – see Table 3. To our best knowledge of the literature, there has not yet seen any research applying Computable General
Equilbirium (CGE), nor Input-Outpu Analysis (IOA), for valuation of ecosystem service, particularly on the replacement cost.
We attempted to use a general equilibrium economic model as an alternative
approach to finding the economic value of ecosystem service being provided by the less human-disturbed Kaomei coastal wetland in central Taiwan.
In this study, we based on the idea as inspired by Leontief (1970) as well as the “broken window fallacy” to propose an approach of measuring the replacement cost as provided by the ecosystem service. In the subsequent sections, we first introduce in section 2 the case studied, the Kaomei coastal wetland, located in central Taiwan; section 3 introduces the inspiring ideas we derived from the “Broken Window Fallacy” and Leontief (1970); section 4 describes the mutli-region computable general equilibrium model; we show in section 5 some key results of the CGE assessment of the replacement cost offered from the ecosystem service, section 6 concludes the report.
Table 1. Contribution of the wetlands’ ecosystem service towards sustainable development
6
Table 2. Final ecosystem services and corresponding goods: Examples from the UK NEA Final ecosystem servicea Principal related goods
Production of crops, plants, livestock, fish, etc. (wild and domesticated)b
Food, fibre, energy, genetic resources, industrial inputs, fertiliser, avoidance of climate stress, recreation and tourism, physical and mental health, ecological knowledge, etc.
Production of trees, standing vegetation and peatb Timber, avoidance of climate stress, energy, noise
regulation, recreation and tourism, etc. Production of wild species diversity including
microbesb , c
Natural medicine, disease and pest control, genetic resources, wild food, bioprospecting, recreation and tourism, physical health, ecological
knowledge, etc.
Production of water quantityb , c Potable water, Industrial use of water, flood
protection, energy, recreation and tourism, physical health, ecological knowledge, etc. Regulation of the climatec Avoidance of climate stress, physical and mental
health, ecological knowledge, etc. Regulation of hazards; related vegetation and
other habitatsc
Coastal protection, erosion protection, flood protection, avoidance of climate stress, physical and mental health, ecological knowledge, etc. Breakdown and detoxification of wastec Pollution control, waste removal, waste
degradation, physical and mental health, ecological knowledge, etc.
Purification processesc Clean air, clean water, clean soils, physical health,
ecological knowledge, etc. Generation and maintenance of meaningful places;
socially valued landscapes and waterscapesd
Recreation and tourism, physical and mental health, ecological knowledge, etc.
a As noted previously, other inputs (e.g. manufactured capital) may in some occasions be required to
combine with final ecosystem services in the production of goods. Relating the final ecosystem services to the MA (2005) nomenclature:
b ‘Provisioning’ services; c ‘Regulating’ services;
d ‘Cultural’ services. ‘Supporting’ services relate to primary ecological services
7
Figure 1. Phases of a joint ecosystem assessment and economic analysis for a single scenario
Boundary conditions (e.g. elevation, climate) defining ecosystem spatio-temporal context
Ecosystem structure (e.g. plant species) Primary processes and intermediate ecosystem
services (e.g. nutrient cycling)
Final ecosystem services (e.g. growth of trees)
Goods (e.g. timber)
Isolating the contribution of ecosystem services
(e.g. contribution to timber production)
Economic valuation of use and non-use values (e.g. shadow value of
timber) Overall contribution of ecosystem services to wellbeing (benefits) Human and manufactured capital (e.g. labour) Non-monetary assessment (e.g. spiritual value of
environment)
Sustainability analysis
Source: Bateman et al. (2011).
Notes: (a) Examples given in parentheses; (b) solid lines indicate relations which always apply while dotted lines indicate relations.
8
Table 3. Various valuation methods applied to ecosystem services
Valuation method Value types Overview of method Common types of applications Examples ofecosystem
services valued Example studies Adjusted market
prices Use Market adjusted for prices distortions such as taxes, subsidies and non-competitive practices.
Food, forest products, R&D benefits. Crops, livestock, multi-purpose woodland, etc. Bateman et al. (2003), Godoy et al. (1993) Production function
methods Use Estimation of productionfunctions to isolate the effect of ecosystem services as inputs to the production process. Environmental impacts on economic activities and livelihoods, including damage costs avoided, due to ecological regulatory and habitat functions Maintenance of beneficial species; maintenance of
arable land and agricultural
productivity; support for
aquaculture;
prevention of damage from erosion and siltation; groundwater recharge; drainage and natural irrigation; storm protection; flood mitigation
Ellis and Fisher (1987), Barbier (2007).
Damage cost avoided Use Calculates the costs which are avoided by not allowing
ecosystem services to degrade.
Storm damage; supplies of clean water; climate change.
Drainage and natural irrigation; storm protection; flood mitigation
Badola and Hussain (2005), Kim and Dixon (1986).
Averting behaviour Use Examination of expenditures to avoid damage
Environmental impacts on human health
Pollution control and
9
Table 3 (continued)
Valuation method Value types Overview of method Common types of applications Examples of ecosystem services valued Example studies Revealed preference methods
Use Examine the expenditure made on ecosystem related goods (e.g. travel costs; property prices in low pollution areas). Recreation; environmental impacts on residential property and human health. Maintenance of beneficial species, productive ecosystems and biodiversity; storm protection; flood mitigation; air quality, peace and quiet, workplace risk.
See Bockstael and
McConnell (2006) for the travel cost method and Day et al. (2007) for hedonic pricing. Stated preference methods Use and non-use Uses surveys to ask individuals to make choices between different levels of environmental goods at different prices to reveal their
willingness to pay for those goods Recreation; environmental quality, impacts on human health, conservation benefits. Water quality, species conservation, flood prevention, air quality, peace and quiet.
See Carson et al. (2003) for contingent valuation and Adamowicz et al. (1994) for discrete choice experiment approach.
10
2. Case studied: Kaomei wetland
Kaomei wetland, taking up 701.3 ha and 3.5km stretch of coastline in central Taiwan, used to be a beach resort prior to the construction of the Taichung Harbor in
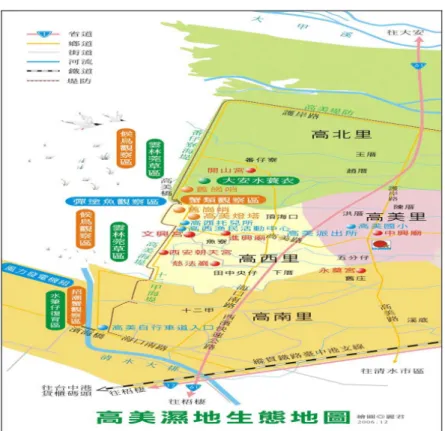
1976—which caused piling up of floating sands. Albeit losing swimmer visits afterwards, Kaomei became a paradise for wild creatures and migratory birds. As shown in Figure 2, Kaomei wetland is rich in biodiversity, with the endangered Platalea minor and various varieties of grass—including Bolboschoenus planiculmis (F.Schmidt) T. Koyama (雲林 莞草), Hygrophila pogonocalyx (大安水蓑衣), Platalea minor (黑面琵鷺), Mudskipper (彈塗魚), Kandelia mangrove (水筆仔), Beckoning crab (招潮蟹). In September 2004, the state Council of Agriculture officially declared the Kaomei wetland as a site for wildlife conservation.
Kaomei wetland, by its face, does not look of high economic value. From the ecological perspective, it has quite low human disturbance, which helps maintaining the rich biodiversity. For the perspective of economic development, an area of such low economic profile tends to be converted into built-up land for better economic payoff. However, with increasing awareness of and appreciation for ecosystem service, local ecologists contended with economic planners for conserving the Kaomei biodiversity by keeping Kaomei wetland as it is, rather than surrendering to industrial/commercial use for better economic payoff.
In this study, we attempted to give a value—based on the replacement cost method as suggested in the TEEB for the ecosystem service of water purification function—for keeping the seeming economically marginal yet low-LDI Kaomei wetland. We employed a multi-regional computable general equilibrium model (MR-CGE) of Taiwan to do the assessment and come up with an “extended” replacement cost estimate for the Kaomei wetland, as opposed to the conventional ecological engineering estimation.
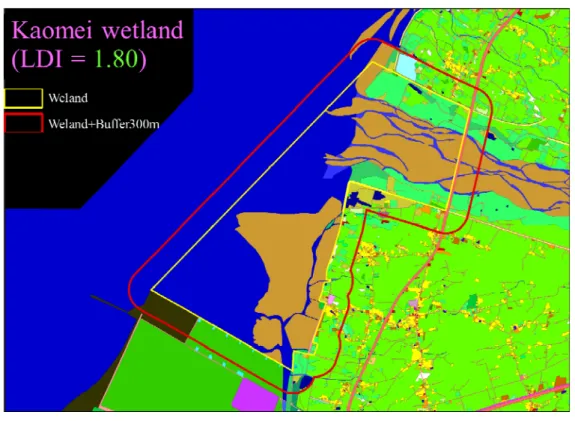
Lin et al. (2011) identified the degree of human influence on the Kaomei wetland using the landscape development intensity (LDI) index, which is proposed by Brown and Vivas (2005). The scope of LDI index calculation for the Kaomei wetland is shown in Figure 3. Based on emergy of human activities in a certain size of area during a certain period of time, covering consumption of electricity, coal, fertilizer, pesticide, tap water, and irrigation water, the LDI measures the degree of human disturbance to the wetland ecosystem. The formula for calculating LDI is as follows:
11
where LUi denotes the area of the land use type i;
LDIi denotes the land development intensity coefficient of the land use type i. Lin et al.(2011) used the National Land Use Survey Data (see Figure 4) for the variable LUi of Eq. 1, and the LDIi information (see Table 4) is borrowed from Brown and Vivas (2005) for the Florida case study—as so far there is not yet estimation of the land development intensity parameter for the Taiwan case. The LDI index for Kaomei wetland is calculated as 1.80, which indicates a rather low human disturbance. This corresponds with the official ranking made based on the criteria of 50% weighing of sepcies richness (biodiversity) across Taiwan’s 74 wetland sites of significance (Chen and Lin, 2011), among which Kaomei wetland ranked 7th.
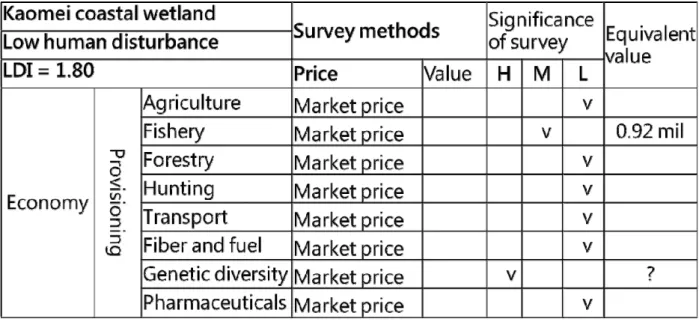
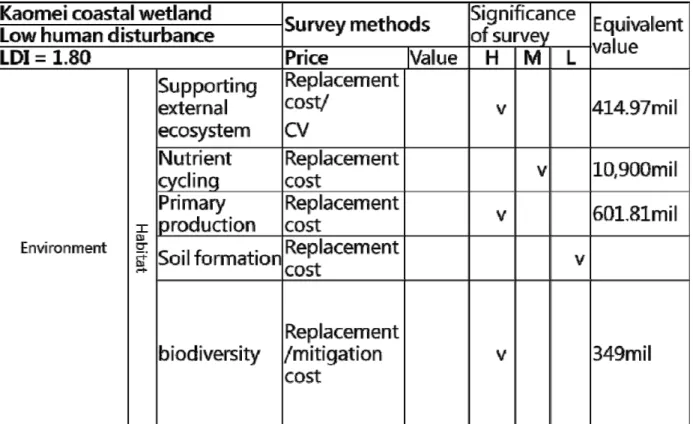
Lin et al.(2011) also assessed the values of various ecosystem services provided by the Kaomei wetland. Tables 5a - 5c tally the estimated values of the ecosystem services, among which we picked the ecosystem service of water purification to demonstrate an alternative approach to giving a value for the ecosystem service. The ecosystem service value of water purification was measured by the replacement cost—that is, the cost of building a conventional wastewater treatment plant of same processing capacity of the Kaomei wetland—which amounts to 10,900 million Taiwan dollars (see Table 5b).
Figure 2. Biodiversity map of the Kaomei wetland
12
Figure 3. Scope of LDI index calculation for the Kaomei wetland
Source: Lin et al. (2011).
Figure 4. Land use classification of the National Land Use Survey data of Taiwan
13
Table 4. Categories of the Florida land-use classification system and their LDI coefficients
Source: Brown and Vivas (2005).
Table 5a. Estimated value of ecosystem service of the Kaomei wetland
14
Table 5b. Estimated value of ecosystem service of the Kaomei wetland
15
3. The inspiring ideas in “Broken Window Fallacy” and Leontief (1970)
3.1 The “Broken Window Fallacy” (BWF)
Frédéric Bastiat (1850) essay titled as Ce qu'on voit et ce qu'on ne voit pas (That Which Is Seen and That Which Is Unseen) pointed out the opportunity cost of the broken
window. The center piece question is: would it help with economic growth by breaking a window of the bakery?
What is seen is that glazier gains business as the bakery shopkeeper had to order for window repair; glass producer thus gain business order from the glazier; the input
supplier to the glass producer in turn gains business as such; and so on. As the chain effect goes on and on for numerous runs, and affect various inter-linked sectors, GDP will go up, and employment increases of these positively affected sectors as well.
On the other hand, what is not seen is that shopkeeper loses money to window repair, which he would otherwise spend on a new pair of shoes; shoemaker thus loses business from the shopkeeper; the input supplier to the shoemaker in turn loss business as such; and so on. As the chain effect goes on and on for numerous runs, and affect various inter-linked sectors, GDP will go down, employment of these adversely affected sectors declines as well. In the end, the net benefit of a chain repercussions due to the broken window would not be enough to compensate the lost worth of the bakery’s broken window.
The chain repercussions indicated in the BWF correspond with those in the
Input-Output Analysis as developed by Leontief (1986). Leontief (1970) proposed a way of applying the Input-Output Analysis to environmental issues—in particular, pollution. We introduced the key ideas and inspiration we derived from Leontief (1970).
3.2 Key ideas derived from Leontief (1970)
Leontief (1970) addressed environmental repercussions within the economic structure with the Input-Output Approach he developed. The key conclusion revealed in Leontief (1970) is that there is a price (or cost) for environmental quality (as a good).
Leontief (1970) assumed that pollution cleaning took produced goods as inputs, e.g., fabric and labor. Based on the Input-Output analysis, requirement for pollution
elimination—that is, better environmental quality—ended up raising GDP, while real consumption remained constant. More demand for cleanness, more fabric and labor
16
needed, which in turn pushes up production of fabric, and thus pollution associated with fabric production. The increment in GDP (induced by the clean-up activities) turned out to be the payment for pollution elimination, as real consumption remains the same. That is, the gap between GDP and real consumption is the total cost of pollution elimination efforts (or cost of having certain level of environm. quality), defrayed by the final consumers, directly or indirectly.
Kaomei wetland plays a role similar to the window in the BWF. What is even more benevolent is that Kaomei wetland has been offering the environmental quality, yet free of charge. As we narrated previously, both Bastiat’s (1850) BWF and Leontief (1970) used the concept of inter-sector linkage through input-output demand/supply relationship. This coincidence prompted us to further pursuit an alternative way of assessing
ecosystem services. We hope this could offer a new perspective whenever the pursuit of environmental sustainability has to contend with the economic prosperity. In this study we attempted to find the “replacement cost” as in TEEB (2010) and in Boyer and Polasky (2004), yet “extended”, by using an input-output based multi-regional
computable general equilibrium (MR-CGE) model of the Taiwan economy. We believe this alternative approach to measuring the “extended” replacement cost commensurate with the value of the ecosystem services provided by wetlands adds upon the literature by revealing the society’s total “opportunity cost” of losing Kaomei wetland’s ecosystem services.
4. A mutli-region computable general equilibrium model
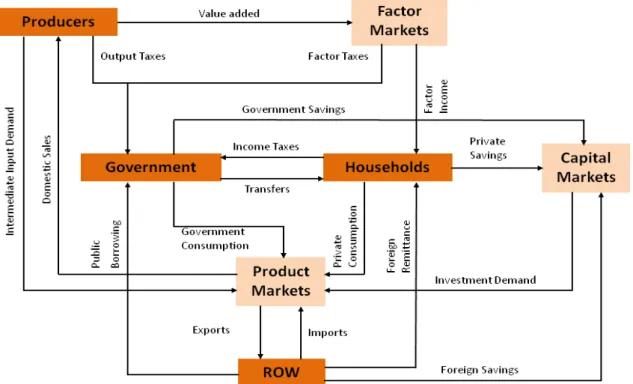
We constructed a multi-regional computable general equilibrium model of Taiwan covering four sub-regions of Taiwan: North, Central, South, East, and 52 producing sectors, consumption of private households, government and exports. The MR-CGE model describes the circular flows of the economy (as depicted by Figure 5), behavior of all economic agents (including producers and consumers, domestic and foreign), and the inter-sectoral linkage thru input-output demand and supply relations.
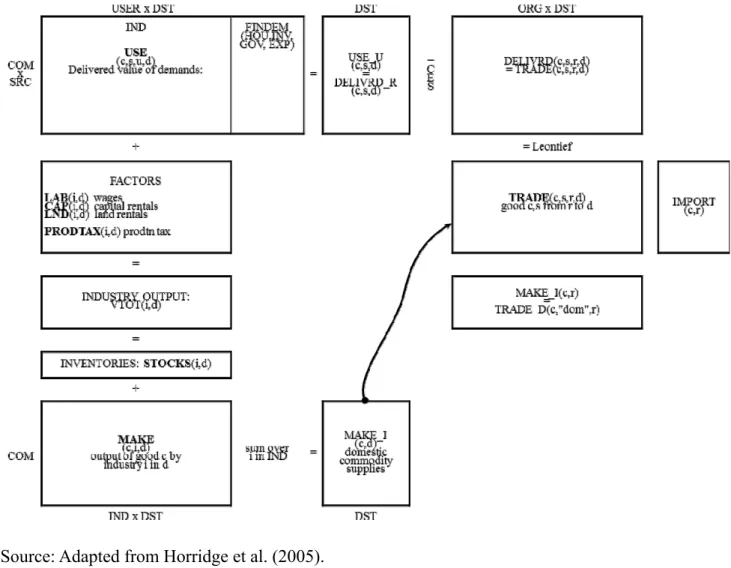
Figure 6 shows the format of the Input-Output and inter-region trade flows data used in the MR-CGE model for benchmarking. Figure 7 shows the production structure
specified in the model for the producing inductries in a sub-region; Figure 8 shows the final demand structure of consumers. Figure 9 shows the inter-region linkage thru in-flows and out-flows of goods/services. All agents act out the market mechanism of Neoclassic Economics, that is, the model assumes upward-slopping supply curves and
17
downward-slopping demand curves. This is much better assumption for the economic operation as opposed to that in Leontief (1970) Input-Output model, which assumed perfectly elastic supply of resources.
Figure 5. Circular flows in the economy
18
Figure 6. Input-Output accounts and inter-region trade flows data used in the MR-CGE model
19
Figure 7. Production structure of an industry in a region
20
Figure 9. Inter-region trade decision
5. Key results of the MR-CGE assessment of the “extended” replacement cost
We brought in the replacement cost of the Kaomei wetland’s ecosystem service for water purification as estimated by Lin et al. (2011), which is 10,900 million Taiwan dollars (see Table 5b). In the MR-CGE simulation, we assumed a neoclassical short-run closure and brought in the investment expenditure of 10,900 million Taiwan dollars. Table 6 shows the key simulation result of induced regional output increase due to the
investment expenditure on buiding a conventional wastewater treatment plant of same processing capacity as the Kaomei wetland.
Table 6 shows an 1.618 of nation-wide output multiplier for the estimated
replacement cost offered by Kaomei for water purification function. This indicats a much larger replacement cost than the one Lin et al. (2011) estimated, which is 10,900 million Taiwan dollars. This is because the estimates of the “extended replacement cost” is embedded with the concepts of “opportunity cost” as well as the “spillover effect”, to which are referred by Bastiat’s (1850) “Broken Window Fallacy” and Leontief (1970). In other words, our results from the MR-CGE model may imply potential underestimation of the replacement cost measured in a straightforward way like Lin et al. (2011).
21
Table 6. Induced regional output increase: “extended” replacement cost of Kaomei wetland’s ecosystem service for water purification
Should the Kaomei wetland being conserved, the spared expenditure for building the water purification facility of same processing capacity like Kaomei could be used instead for other good economic purposes, which would boost economic development of the regions and the nation, for example, more labor employment, more domestic
production, and thus more income for households.
6. Concluding remarks
Leontief (1970) demonstrated how environmental regulation increased GDP, in which cost of maintaining certain level of environmental quality turned out to be the top-up. Our MR-CGE results prompted us to further consider if GDP is a good measure of economic well-being. A misleading index for economic development may result in mis-allocation of limited resource of the economy as well as the free resource from the natural environment.
Kaomei was not paid a price (or value) commensurate with the brilliant job it has been quietly doing. Once the Kaomei wetland was converted into industrial/commercial built-up area, the government will have to build a surrogate water purification facility to
22
render same level of environmental quality. This will cost the economy not just the face value of the construction bill, but could well be twice or even more. If the Kaomei could be conserved, the spared budget could be used to generate much greater economic payoff than the replacement cost of building a water purification facility with Kaomei’s
processing capacity. Based on our study, it will be wise to not under-value ecosystem services, lest it may render mis-aligned strategy for sustainable development of the economy and the environment.
In addition, our study also suggested a need for recording in the economic
accounting, such as Green GDP, the contribution of ecosystem services being provided by the environment free of charge. For the case of Taiwan, valuation of ecosystem service is planned, but not yet accounted for (see Figure 10). Our approach offers an alternative measure for replacement cost in presenting the value of ecosystem services.
Figure 10. The accounting structure of Taiwan’s Green GDP accounts
23
References
Bastiat, Frédéric. (1850). "That Which Is Seen, and That Which Is Not Seen," essay.
Barbier EB (2007). Valuing ecosystem services as productive inputs. Econ Policy 22:177–229. Bateman, I., Mace, G., Fezzi, C., Atkinson, G., & Turner, K. (2011). Economic Analysis for
Ecosystem Service Assessments. Environmental and Resource Economics, 48(2), 177-218. doi: 10.1007/s10640-010-9418-x
Bateman IJ, Day BH, Dupont D, Georgiou S (2009) Procedural invariance testing of the one-and-one-halfbound dichotomous choice elicitation method. Rev Econ Stat 91(4):806–820. doi:10.1162/rest.91.4.806
Boyer, Tracy, and Polasky Stephen. (2004). Valuing Urban Wetlands: A Review of Non-Market Valuation Studies. Wetlands. vol.4, issue 24. December 2004. 744–755.
Brown, M. T., and M. B. Vivas. (2005). Landscape development intensity index. Environmental Monitoring and Assessment 101:289-309.
Chen, T.-S., & Lin, H.-J. (2011). Application of a Landscape Development Intensity Index for Assessing Wetlands in Taiwan. Wetlands, 31(4), 745-756. doi:
10.1007/s13157-011-0191-6
Costanza et al. (1997). The value of the world's ecosystem services and natural capital. Nature 387:253-260.
DGBAS. (2010). Green GDP Accounting of Taiwan, 2009. Directorate-General of Budget, Accounting and Statistics (DGBAS), Executive Yuan, Taiwan.
Geber, U., & Björklund, J. (2002). The relationship between ecosystem services and purchased input in Swedish wastewater treatment systems — a case study. Ecological Engineering, 19(1), 97-117. doi: 10.1016/s0925-8574(02)00079-4
Heal GM, Barbier EB, Boyle KJ, Covich AP, Gloss SP, Hershner CH, Hoehn JP, Pringle CM, Polasky S, Segerson K, Shrader-Frechette K (2005) Valuing ecosystem services: toward better environmental decision making. The National Academies Press, Washington. Horridge, J.M., Madden, J.R. and G. Wittwer (2005), "The impact of the 2002-03 drought on
Australia", Journal of Policy Modeling, Vol 27/3, pp. 285-308.
Kaval P (2010)Asummary of ecosystem service economic valuationmethods and
recommendations for future studies. Working paper series #10Department of Economics, University of Waikato.
Leontief, W. (1970). Environmental Repercussions and the Economic Structure: An Input-Output Approach. The Review of Economics and Statistics, 52(3), 262-271. Leontief, Wassily W. (1986) Input-Output Economics. 2nd ed., New York: Oxford University
Press.
Lin, H.-J. (2011). Valuation of Ecosystem Services of the Kaomei Wetland. Working paper. Millennium Ecosystem Assessment (MA) (2005) Ecosystems and human well-being: a
24
TEEB (2010) The Economics of Ecosystems and Biodiversity: Mainstreaming the Economics of Nature: A synthesis of the approach, conclusions and recommendations of TEEB.
25 計畫成果自評 本研究計畫小幅修改研究方向:本研究計畫修改原計畫書中之區域經濟影響評估方 向,嘗試以多區域經濟模型評估濕地之生態服務價值(以替代成本法為例)—此為文獻中尚 未有學者提議之做法,本研究立基於總計畫主持人所推估之濕地生態服務價值之替代成本 (replacement cost),試圖提議以投入產出分析方法及可計算一般均衡分析方法評估直接及 間接替代成本。本研究成果可再進一步與Regional Ecological Footprint Analysis 結合,分 析各產業部門之ecosystem service appropriation。
本研究計畫成果已於2011 年 11 月中旬受邀在東北大學全球頂尖大學計畫(Global Core of Excellence, GCOE)生態適應主題計畫所舉辦之 Ecosystem and Adaptation Forum 發表。目 前正在改寫成期刊論文。
26
可供推廣之研發成果資料表
□ 可申請專利 □ 可技術移轉 日期: 年 月 日 國科會補助計畫 計畫名稱: 計畫主持人: 計畫編號: 學門領域: 技術/創作名稱 (無) 發明人/創作人 技術說明 中文: (100~500 字) 英文: 可利用之產業 及 可開發之產品 技術特點 推廣及運用的價值 ※ 1.每項研發成果請填寫一式二份,一份隨成果報告送繳本會,一份送 貴單位 研發成果推廣單位(如技術移轉中心)。 ※ 2.本項研發成果若尚未申請專利,請勿揭露可申請專利之主要內容。 ※ 3.本表若不敷使用,請自行影印使用。1
國科會補助專題研究計畫項下出席國際學術會議心得報告
日期:100 年 7 月 30 日
一、 參加會議經過
2011 年 6 月 29 日至 7 月 2 日於 The University of Rome Tor Vergata, Rome, Italy 舉行的第 18 屆歐洲環境與資源經濟學會年會(18th Annual Conference of the European Association of Environmental and Resource Economists (EAERE))。會 議主題涵蓋相當廣闊,包含環境與資源經濟學相關領域議題,熱門議題如: 氣候變遷、京都議定書、能源供給、排放權交易、碳稅、CGE 模型與環境、 環境價值評估等,此外,相較冷門議題如:生態多樣性、有害廢棄物處理與 減量、氣候變遷調適等。
會議第一天(6 月 29 日)主要為 PRE CONFERENCE ON WASTE ECONOMICS 及 International Consortium on Applied Bioeconomy Research (ICABR)與 EAERE 共同舉辦之 Policy Session: Sustainability of Food, Agriculture and Bioenergy。會議第二-四天(6 月 30 日至 7 月 2 日)為為論文發表(parallel sessions),同時也各邀請 Prof. Sir Partha Dasgupta (University of Cambridge)發表 keynote speech: Modelling Individual Consumption;Prof. Dale Jorgenson (Harvard University)發表 Energy, the Environment and U.S. Economic Growth。此外,大會 也安排 IPCC Policy session: the IPCC Working Group III Special Report on
Renewable Energy Sources and Climate Change Mitigation (SRREN),由 Prof. Carlo Carraro 及 Prof. Richard Tol 發表 keynote speech。本研究就計畫主持人於會議中
計畫編號 NSC 99-2621-M-004-007- 計畫名稱 人工濕地生態系統功能與經濟效益評估-人工濕地對台灣整 體及區域經濟之衝擊影響及其溫室氣體減量潛力評估(III) 出國人員姓名 李慧琳 服務機構 及職稱 國立政治大學經濟學系 專任助理教授 會議時間 2011 年 6 月 29 日至 2011 年 7 月 2 日 會議地點 Rome, Italy 會議名稱 (中文)
(英文) 18th Annual Conference of the European Association of Environmental and Resource Economists (EAERE) 發表論文題目
(中文)
(英文) The Potential Impact of Climate Change on Global Rice Market and Food Security in Asia
每天的 Poster Session 發表” The Potential Impact of Climate Change on Global Rice Market and Food Security in Asia”一文。詳細議程如附件一。
二、與會心得與建議 歐洲環境與資源經濟學會年會為環境與資源經濟學領域重要國際研討會,文 章發表接受審查嚴格,本研究計畫主持人對於能獲接受於該會議中發表研究 結果感到相當榮幸。參與本次年會的學者多為全球深耕環境經濟分析與政策 議題相關研究領域多年的資深教研人員。本研究計畫主持人於此次會議中學 習獲益良多,透過聆聽演講學習與會研究者對於各國環境經濟領域最新研究 議題及成果,並進一步建立與國際上環境經濟學者之連結與交流,並建立未 來國際研究合作人脈。(註:本研究計畫主持人於此次會議中接受日本東北大 學 Global Center of Excellence (GCOE)生態適應計畫邀請於 2011 年 11 月中旬 前往日本東北大學 GCOE Ecosystem and Adaptation Forum 發表研究成果。)
三、攜回資料名稱及內容 研討會議程手冊。
四、研討會記實(Selective photos)
3
Fig. 2. Poster presentation (2): 聽眾
Fig. 4. Sir Partha Dasgupta at the International Consortium on Applied Bioeconomy Research
Fig. 5. Panel discussion at the International Consortium on Applied Bioeconomy Research
5
Fig. 6. Sir Partha Dasgupta keynote speech at the EAERE
Fig. 8. Prof. Carlo Carraro keynote speech at the IPCC Policy Session of the EAERE
The Potential Impact of Climate Change on Global Rice Market and Food Security in Asia
Huey-Lin Lee
*
and Ching-Cheng Chang
**
*
Dept. of Economics, National Chengchi University, Taipei Taiwan
**
Institute of Economics, Academia Sinica, Taipei, Taiwan
Abstract
Geographically diverse impact of climate change on crop yield affects directly both
producing and import-reliant countries of crops. Food security is of particular policy
concern for rice consuming and importing countries in Asia. We use a multi-region,
multi-sector computable general equilibrium model, in which crop suitability of farm
land is identified when allocating land between uses, to simulate the impact of
climate-induced yield change on global rice production and prices. Among Asian countries,
India gets the hardest hit of climate change in its rice production, and a huge increase
in the unit cost of rice production. China also has to increase rice imports, with a
relatively bigger magnitude than the other Asian countries. India and China have been
the world’s top rice-growing countries, and most of their rice production is consumed
domestically. Should negative effects of rice yield occur in these two major
rice-consuming countries, their raised demand for rice imports may push up global price of
rice, and in turn affect regions that are very much reliant on foreign supply. Climate
impact on Brazil’s rice production further exacerbates the food security problem for
Mexico and Latin American countries that are highly dependent on Brazilian rice. As
agricultural trade intensifies, impact of climate change, be it positive or negative,
occurring in one region will spill over into other regions, through the channels of trade.
As such, policy measures aimed to alleviate food insecurity problem should take into
account the geographically diverse impact of climate change on crop yield.
Research framework
Our study attempted to provide an integrated economic assessment on rice in the
global and regional context. We se a multi-region, multi-sector computable general
equilibrium (CGE) GTAP model—which also considers crop suitability and
agro-ecological zoning (AEZ) characteristics—to analyze the climate-change impact on
global rice market (supply-side shock through crop yield change), with the
consideration of changes in food demand due to population and economic growth.
Climate change would affect the supply curve of rice (domestic or imported), and
population and income growth affect the demand curve of rice. We consider changes in
both the supply and demand sides shocks to examine the impact of climate change by
2020 on the global rice market and food security should the world is developing as
plotted in the IPCC SRES scenario A2.
Implications
Key implications derived from the simulation results are:
1. Among Asian countries, India gets the hardest hit of climate change in its rice
production, and a huge increase in the unit cost of rice production. Thus India has to
rely heavily on imports from the world market to meet its domestic rice demand.
2. Though not as detrimental as that in India, the climate-induced rice yield change by
2020 is going to make China, the fastest growing economy in Asia, to increase rice
imports, with a relatively bigger magnitude than the other Asian countries.
3. India and China have been the world’s top rice-growing countries, and most of their
rice production is consumed domestically. Should negative effects of rice yield occur
in these two major rice-consuming countries, their raised demand for rice import
may push up the global price of rice, and in turn affect regions that are very much
reliant on foreign supply.
4. According to FAOSTAT statistics, Mexico and most Latin American countries have
been the top rice-importing regions of the world. Once India and China push up the
global rice price, Mexico and other Latin American countries would have to pay
more for their rice demand. In the estimates of Rosenzweig and Iglesias (2001),
Mexico and other Latin American countries may also be hit with loss in rice yield.
Likewise, climate change may inflict rice yield reduction upon Brazil—a key rice
exporter in this region—which would further exacerbates the food insecurity
problem for countries highly dependent on Brazilian rice.
5. As agricultural trade intensifies, impact of climate change, be it positive or negative,
occurring in one region will spill over into other regions, through the channels of
trade. As such, policy measures aimed to effectively alleviate food security problem
should also take into account the geographically diverse impact of climate change on
crop yields.
References
Hertel, T. W. (Ed.). (1997). Global Trade Analysis: Modeling and Applications. Cambridge:
Cambridge University Press.
Lee, H. L. (2009). The Impact of Climate Change on Global Food Supply and Demand, Food Prices,
and Land Use. Paddy and Water Environment, 7(4), 321-331.
Lee, H.-L., Hertel, T. W., Rose, S. K., and Avetisyan, M. (2009). An Integrated Global Land Use Data
Base for CGE Analysis of Climate Policy Options, in Hertel, T., Rose, S., and Tol, R. (eds)
Economic Analysis of Land Use in Global Climate Change Policy, Routledge.
Rosenzweig, C., & Iglesias, A. (2001). Potential Impacts of Climate Change on World Food Supply:
Data Sets from a Major Crop Modeling Study from
http://sedac.ciesin.columbia.edu/giss_crop_study/
Key results
Changes in crop yield
General Circulation Models
Global temp. and precip. change
Crop process model
Economic model: GTAP-LU
IPCC SRES scenarios: narrative storylines
Quantified SRES scenarios:
socioeconomic drivers
Integrated Assessment Model
GHG emissions scenarios
Supply shock
Demand shock
Pop./GDP growth
Leontief CESOutput levels
Intermediate
inputs
Primary
factors
Capital
Land
Natural
resources
Labor
Crop 1
Crop 2
Crop N
Crops
Forestry
Agriculture
Livestock
Land in AEZ i
CET
CET
CET
No. Regions
Rice
Wheat
Other
grains
Oilseeds
No.
Regions
Rice
Wheat
Other
grains
Oilseeds
1
CAN
0.00
-1.00
-3.00
12.00
11
SAS
-0.74
-6.14
-5.87
0.99
2
USA
-2.00
0.00
-13.00
1.00
12
IDN
1.00
0.00
-2.00
1.00
3
WEU
0.12
3.15
-2.28
1.60
13
PAS
1.59
4.29
-0.80
5.49
4
AUS
-1.00
6.00
4.00
8.00
14
MEA
-2.52
-2.15
-6.50
-3.64
5
JPN
6.00
1.00
0.00
12.00
15
BRA
-20.00
-18.00
1.00
-5.00
6
NZL
0.00
-3.00
-7.00
0.00
16
MEX
-11.00
-9.00
-3.00
-2.00
7
EEU_FSU
-14.00
-12.00
-14.00
-10.00
17
LAM
-14.70
-10.91
-3.00
-2.38
8
CHN
-1.00
6.00
-6.00
-5.00
18
ARG
2.00
4.00
0.00
9.00
9
CPA
3.00
4.00
0.00
4.00
19
AFR
-6.37
-1.79
-6.98
-4.97
10
IND
-8.00
-6.00
-8.00
-4.00
Estimates of climate-induced crop yield change (%) for the 19 regions of this study*
Source: Production share weighted average, over constituent countries, of estimates by Rosenzweig and Iglesias(2001).
* CO
2fertilization effect is included in these estimates.
Unit: %
(A)
(B)
(C)
(D)
No.
Regions
Production
Unit Cost
Export
Import
1
CAN
14.93
0.05
58.19
-4.71
2
USA
7.71
6.10
22.98
23.67
3
WEU
7.02
0.57
25.11
-3.14
4
AUS
-0.17
1.86
2.94
5.98
5
JPN
2.49
-6.21
45.59
-28.15
6
NZL
0.38
0.06
3.53
-0.09
7
EEU_FSU
-3.40
21.61
-61.74
139.77
8
CHN
0.12
1.37
8.67
9.91
9
CPA
2.79
-3.02
101.82
-2.12
10
IND
-1.09
16.59
-69.90
113.97
11
SAS
-0.01
1.29
5.96
2.39
12
IDN
0.14
-1.50
21.65
2.51
13
PAS
1.96
-1.13
39.37
-4.94
14
MEA
-0.69
3.19
15.78
0.84
15
BRA
-8.22
27.68
-72.48
63.61
16
MEX
-12.38
12.59
7.00
19.78
17
LAM
-7.82
20.64
-17.24
65.06
18
ARG
49.82
7.19
200.24
58.87
19
AFR
-6.21
7.56
-16.98
31.84
Global distribution of Agro-Ecological Zones (AEZ)
Production structure of the agricultural sectors
Nesting structure for AEZ-specific land supply
Simulation design with the GTAP land use CGE model
國科會補助計畫衍生研發成果推廣資料表
日期:2012/01/31國科會補助計畫
計畫名稱: 人工濕地對台灣整體及區域經濟之衝擊影響及其溫室氣體減量潛力評估(III) 計畫主持人: 李慧琳 計畫編號: 99-2621-M-004-007- 學門領域: 永續發展研究-人文及社會科學無研發成果推廣資料
99 年度專題研究計畫研究成果彙整表
計畫主持人:李慧琳 計畫編號: 99-2621-M-004-007-計畫名稱:人工濕地生態系統功能與經濟效益評估--人工濕地對台灣整體及區域經濟之衝擊影響及其 溫室氣體減量潛力評估(III) 量化 成果項目 實際已達成 數(被接受 或已發表) 預期總達成 數(含實際已 達成數) 本計畫實 際貢獻百 分比 單位 備 註 ( 質 化 說 明:如 數 個 計 畫 共 同 成 果、成 果 列 為 該 期 刊 之 封 面 故 事 ... 等) 期刊論文 0 0 100% 研究報告/技術報告 1 0 100% 研討會論文 0 0 100% 篇 論文著作 專書 0 0 100% 申請中件數 0 0 100% 專利 已獲得件數 0 0 100% 件 件數 0 0 100% 件 技術移轉 權利金 0 0 100% 千元 碩士生 0 0 100% 博士生 1 0 100% 博士後研究員 0 0 100% 國內 參與計畫人力 (本國籍) 專任助理 0 0 100% 人次 期刊論文 0 0 100% 研究報告/技術報告 0 0 100% 研討會論文 1 0 100% 篇 論文著作 專書 0 0 100% 章/本 申請中件數 0 0 100% 專利 已獲得件數 0 0 100% 件 件數 0 0 100% 件 技術移轉 權利金 0 0 100% 千元 碩士生 0 0 100% 博士生 0 0 100% 博士後研究員 0 0 100% 國外 參與計畫人力 (外國籍) 專任助理 0 0 100% 人次其他成果 (無法以量化表達之成 果如辦理學術活動、獲 得獎項、重要國際合 作、研究成果國際影響 力及其他協助產業技 術發展之具體效益事 項等,請以文字敘述填 列。) 無. 成果項目 量化 名稱或內容性質簡述 測驗工具(含質性與量性) 0 課程/模組 0 電腦及網路系統或工具 0 教材 0 舉辦之活動/競賽 0 研討會/工作坊 0 電子報、網站 0 科 教 處 計 畫 加 填 項 目 計畫成果推廣之參與(閱聽)人數 0
國科會補助專題研究計畫成果報告自評表
請就研究內容與原計畫相符程度、達成預期目標情況、研究成果之學術或應用價 值(簡要敘述成果所代表之意義、價值、影響或進一步發展之可能性)、是否適 合在學術期刊發表或申請專利、主要發現或其他有關價值等,作一綜合評估。 1. 請就研究內容與原計畫相符程度、達成預期目標情況作一綜合評估 ■達成目標 □未達成目標(請說明,以 100 字為限) □實驗失敗 □因故實驗中斷 ■其他原因 說明: 小幅修改研究方向: 本研究計畫修改原計畫書中之區域經濟影響評估方向, 嘗試以多區 域經濟模型評估濕地之生態服務價值(以替代成本法為例)--此為文獻中尚未有學者提議之做 法, 本研究立基於總計畫主持人所推估之濕地生態服務價值之替代成本(replacement cost), 試圖提議以投入產出分析方法及可計算一般均衡分析方法評估直接及間接替代成本. 2. 研究成果在學術期刊發表或申請專利等情形: 論文:□已發表 □未發表之文稿 ■撰寫中 □無 專利:□已獲得 □申請中 ■無 技轉:□已技轉 □洽談中 ■無 其他:(以 100 字為限) 3. 請依學術成就、技術創新、社會影響等方面,評估研究成果之學術或應用價 值(簡要敘述成果所代表之意義、價值、影響或進一步發展之可能性)(以 500 字為限) 本研究計畫嘗試以多區域經濟模型評估濕地之生態服務價值(以替代成本法為例)--此為 文獻中尚未有學者提議之做法, 本研究立基於總計畫主持人所推估之濕地生態服務價值 之替代成本(replacement cost),試圖提議以投入產出分析方法及可計算一般均衡分析方 法評估直接及間接替代成本.本研究成果可再進一步與 Regional Ecological Footprint Analysis 結合, 分析各產業 部門之 ecosystem service appropriation.